Abstract
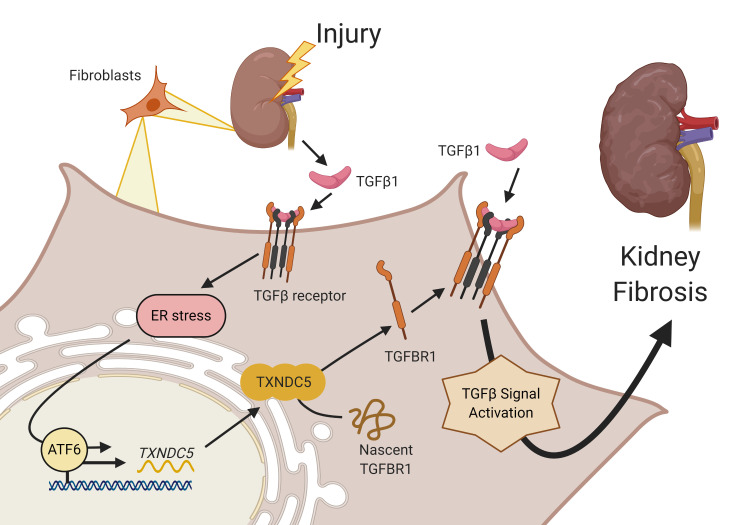
Renal fibrosis, a common pathological manifestation of virtually all types of chronic kidney disease (CKD), often results in diffuse kidney scarring and predisposes to end-stage renal disease. Currently, there is no effective therapy against renal fibrosis. Recently, our laboratory identified an ER-resident protein, thioredoxin domain containing 5 (TXNDC5), as a critical mediator of cardiac fibrosis. Transcriptome analyses of renal biopsy specimens from patients with CKD revealed marked TXNDC5 upregulation in fibrotic kidneys, suggesting a potential role of TXNDC5 in renal fibrosis. Employing multiple fluorescence reporter mouse lines, we showed that TXNDC5 was specifically upregulated in collagen-secreting fibroblasts in fibrotic mouse kidneys. In addition, we showed that TXNDC5 was required for TGF-β1–induced fibrogenic responses in human kidney fibroblasts (HKFs), whereas TXNDC5 overexpression was sufficient to promote HKF activation, proliferation, and collagen production. Mechanistically, we showed that TXNDC5, transcriptionally controlled by the ATF6-dependent ER stress pathway, mediated its profibrogenic effects by enforcing TGF-β signaling activity through posttranslational stabilization and upregulation of type I TGF-β receptor in kidney fibroblasts. Using a tamoxifen-inducible, fibroblast-specific Txndc5 knockout mouse line, we demonstrated that deletion of Txndc5 in kidney fibroblasts mitigated the progression of established kidney fibrosis, suggesting the therapeutic potential of TXNDC5 targeting for renal fibrosis and CKD.
Keywords: Cell Biology, Nephrology
Keywords: Fibrosis, Protein misfolding
Introduction
Renal fibrosis, characterized by tubulointerstitial fibrosis and glomerular sclerosis, is a common pathological manifestation of most, if not all, types of chronic kidney diseases (CKD) (1). The progression of renal fibrosis in patients with CKD leads to the gradual loss of kidney function, which could ultimately result in end-stage renal disease (ESRD) that requires dialysis or kidney transplantation (2). While multiple molecular determinants and pathways have been shown to contribute to the process of kidney fibrosis, transforming growth factor beta (TGF-β) is generally regarded as the master regulator of renal fibrogenesis (3). Following injury to the kidney, damaged tubular epithelial cells (TECs) are arrested in G2/M phase and secrete large amounts of TGF-β, triggering the activation and transformation of adjacent renal fibroblasts into myofibroblasts (4–6). Activated myofibroblasts, featured by the expression of α-smooth muscle actin (αSMA), are highly proliferative and produce extracellular matrix (ECM) proteins like fibrillar collagen, elastin, fibronectin, and CCN2 (commonly known as connective tissue growth factor, CTGF) (7, 8). During the early stages of kidney injury, fibrosis was initiated as an adaptive and self-limited physiological response that helps repair tissue and maintain structural integrity (9). However, following chronic, repeated renal injury, the activation and proliferation of myofibroblasts persist, resulting in excessive ECM production and accumulation, leading to the loss of functional kidney parenchyma and ultimately, kidney failure (10, 11).
In spite of the advances in modern medicine, few clinical therapies are proven effective against kidney fibrosis. Angiotensin-converting enzyme inhibitors (ACEIs) and angiotensin receptor blockers (ARBs), for example, have been shown to reduce proteinuria, ameliorate renal fibrosis, and slow down the progression of CKD (12, 13). Pentoxifylline, a nonspecific phosphodiesterase inhibitor, on the other hand, has been shown to inhibit TGF-β1–induced ECM and CCN2 expression, leading to attenuated tubulointerstitial fibrosis (14). The use of ACEIs and ARBs, however, is limited by their hypotensive effects and potential adverse effects like hyperkalemia. In addition, neither ACEIs/ARBs nor pentoxifylline treatment could halt the progression of renal fibrosis and CKD (15, 16). It is, therefore, imperative to identify novel mediators or pathways that are critical for the pathogenesis of renal fibrosis to develop effective therapeutics against CKD.
Recently, we identified thioredoxin domain containing 5 (TXNDC5), an ER-resident, fibroblast-enriched protein with the enzyme activity of a protein disulfide isomerase (PDI), as a critical mediator of cardiac fibrosis (17). We showed that excessive TXNDC5 promotes the development of cardiac fibrosis through redox-dependent cardiac fibroblast activation and ECM production. Genetic deletion of Txndc5 ameliorates cardiac fibrosis and contractile dysfunction induced by β agonist in mice (17). Based on the observed essential role of TXNDC5 in myocardial fibrogenesis, we hypothesized that TXNDC5 could also contribute critically to the development of tissue fibrosis in noncardiac organs, particularly kidney fibrosis.
In the present study, we showed that TXNDC5 was highly upregulated in both human and mouse fibrotic kidneys, specifically in the collagen-secreting renal fibroblasts. Global deletion of Txndc5 markedly attenuated the extent of renal fibrosis in multiple mouse models of kidney injury. Mechanistically, we demonstrated that excessive TXNDC5, induced by TGF-β1 via ATF6-dependent ER stress pathway, augments renal fibrosis by promoting kidney fibroblast activation/proliferation and ECM production through posttranslational stabilization and upregulation of TGF-β receptor type I (TGFBR1). Importantly, we showed that inducing fibroblast-specific deletion of Txndc5 effectively ameliorated the development and progression of kidney fibrosis induced by various types of injuries in mice, suggesting that targeting TXNDC5 could be a novel and powerful approach to treat renal fibrosis and preserve kidney function.
Results
TXNDC5 was significantly upregulated in human and mouse fibrotic kidneys.
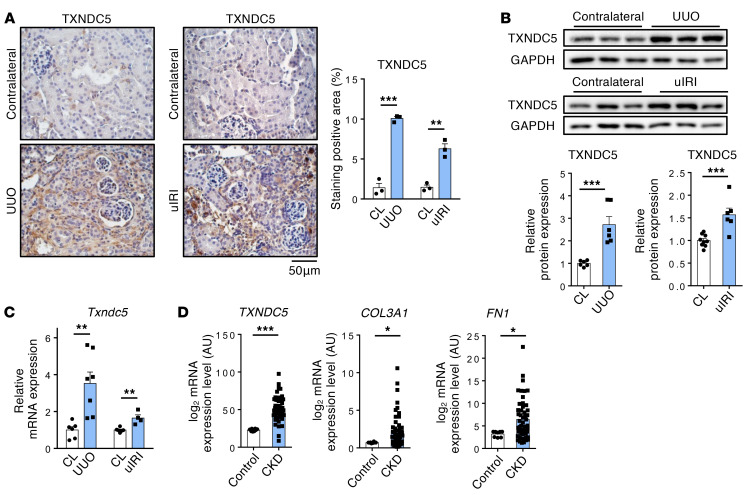
To investigate the potential involvement of TXNDC5 in the pathogenesis of kidney fibrosis, we first determined its protein expression levels in the fibrotic mouse kidney tissues induced by unilateral ureteral obstruction (UUO), unilateral ischemia-reperfusion injury (uIRI), or by the administration of folic acid (FA). Immunohistochemistry studies revealed marked increases in the intensity of TXNDC5 staining in the kidney sections from all 3 mouse models of renal fibrosis (Figure 1A and Supplemental Figure 1A; supplemental material available online with this article; https://doi.org/10.1172/JCI143645DS1). Immunoblotting and quantitative reverse transcription PCR (RT-PCR) also showed significant upregulation of the protein (Figure 1B) and transcript (Figure 1C and Supplemental Figure 1B) expression levels of TXNDC5 in fibrotic mouse kidneys. Consistent with these results, reanalysis of microarray data obtained from renal biopsy specimens of patients with CKD (GSE66494) (18) showed that the expression levels of TXNDC5 (by 2.24 fold, P < 0.001), as well as of markers for kidney fibrosis such as COL3A1 and FN1, were also significantly increased in the kidney samples from patients with CKD compared with those from healthy controls (Figure 1D and Supplemental Figure 1C). Taken together, the observed upregulation of TXNDC5/Txndc5 expression in fibrotic human/mouse kidneys and its positive correlation with fibrogenic ECM protein genes suggest a potential role of TXNDC5 in the pathogenesis of kidney fibrosis.
Figure 1. TXNDC5 was significantly upregulated in mouse fibrotic kidneys and kidney specimens from patients with CKD.
(A) IHC staining (n = 3) and (B) immunoblots (n = 6) showed protein expression of TXNDC5 was upregulated in mouse fibrotic kidneys induced by UUO or uIRI, compared with contralateral kidneys (CL). Scale bar: 50 μm. (C) Quantitative RT-PCR showed Txndc5 transcript was upregulated in mouse fibrotic kidneys induced by UUO and uIRI (n = 4–7). (D) Reanalyses of microarray data on human kidney specimens from patients with CKD (GSE66494) showed that TXNDC5, COL3A1, and FN1 were significantly upregulated in the kidney tissues from CKD patients (healthy control n = 8, CKD n = 51). For A–C, data are representative of 3 or more independent experimental replicates. For all panels, data are presented as mean ± SEM. *P < 0.05, **P < 0.01, ***P < 0.001 by 2-sided t test (A–C) or Mann-Whitney test (D).
TXNDC5 was highly enriched in collagen-secreting renal fibroblasts in the fibrotic kidneys.
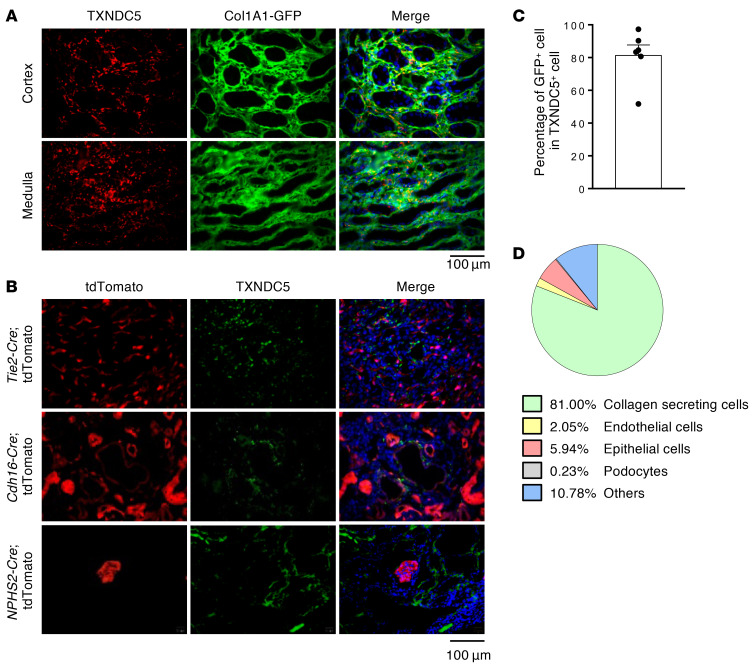
Multiple types of kidney cells have been implicated in the process of kidney fibrogenesis. Following kidney injuries, resident (19) and perivascular (20) renal fibroblasts were shown to differentiate into active myofibroblasts and result in the accumulation of ECM. TECs and endothelial cells were also reported to contribute to the development of kidney fibrosis through epithelial- and endothelial-to-mesenchymal transition, respectively (10, 21). To determine the cell types where TXNDC5 was expressed during the process of renal fibrosis, multiple reporter mouse lines that allow fluorescence labeling of renal fibroblasts (Col1a1-GFPTg, GFP driven by Col1a1 enhancer/promoter, ref. 22), TECs (Cdh16-Cre ROSA26-tdTomato), endothelial cells (Tie2-Cre/ERT2 ROSA26-tdTomato), and podocytes (NPHS2-Cre ROSA26-tdTomato) were subjected to UUO, uIRI, or FA treatment to induce kidney fibrosis. Immunofluorescence (IF) staining of the kidney sections from these animals revealed that TXNDC5 was markedly upregulated and highly colocalized with GFP-positive, collagen-secreting renal fibroblasts in fibrotic mouse kidneys induced by UUO (81%) (Figure 2, A and C), uIRI (76.8%), and FA treatment (73.4%) (Supplemental Figure 2, A and B). In UUO-induced fibrotic kidneys, TXNDC5 was only expressed sporadically in TECs (5.94%), podocytes (0.63%), and endothelial cells (2.05%) (Figure 2, B and D). Flow cytometry analysis of fibroblasts isolated from mouse kidneys subjected to UUO revealed a marked expansion in TXNDC5+ kidney fibroblasts as well as a significant upregulation of TXNDC5 in these cells, compared with those from contralateral control kidneys (Supplemental Figure 2C). The observed strong enrichment of TXNDC5 in renal fibroblasts in fibrotic kidneys suggests that TXNDC5 could contribute to kidney fibrosis by regulating the activity/behavior of these collagen-secreting fibrogenic cells.
Figure 2. TXNDC5 was highly upregulated in renal fibroblasts, but not in TECs, endothelial cells, or podocytes, of the fibrotic kidneys.
(A and C) IF staining of TXNDC5 (red) on sections of fibrotic kidneys induced by UUO in Col1a1-GFPTg mice showed TXNDC5 was mainly expressed in collagen-secreting renal fibroblasts (green), both in renal cortex and medulla (n = 6). Cell nuclei were stained with DAPI (blue). Scale bar: 100 μm. (B) IF staining of TXNDC5 (green) on section of fibrotic kidneys induced by UUO in Cdh16-Cre, NPHS2-Cre, and Tie2-Cre/ERT2 tdTomato mice. Cell nuclei were stained with DAPI (blue). Scale bar: 100 μm. (D) A pie chart to illustrate the proportion of TXNDC5+ cells in different types of kidney cells in the UUO-induced fibrotic kidneys. Data are representative of 3 or more independent experimental replicates. Data in C are presented as mean ± SEM.
TXNDC5 was both essential and sufficient to induce the activation, proliferation, and ECM production of kidney fibroblasts.
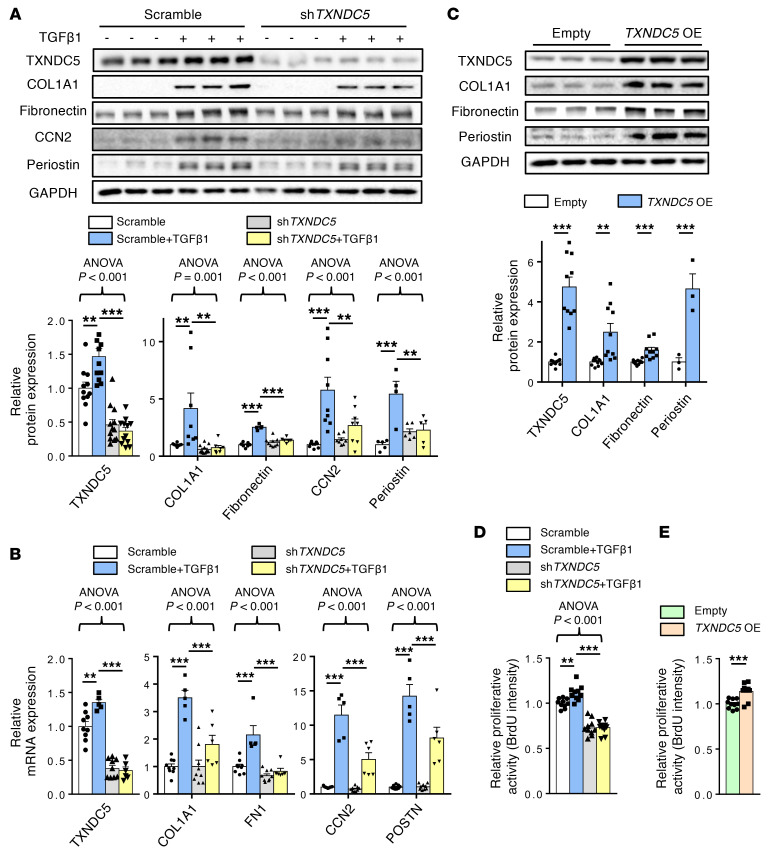
Next, we determined the functional role of TXNDC5 in kidney fibroblasts. Primary human kidney fibroblasts (HKFs) stimulated with TGF-β1 (10 ng/mL) showed strong upregulation in the protein (Figure 3A) and transcript (Figure 3B) expression levels of TXNDC5, as well as of fibroblast activation marker periostin and ECM proteins (COL1A1, fibronectin, and CCN2). Knockdown of TXNDC5 with shRNA significantly attenuated TGF-β1–induced protein/mRNA upregulation of periostin and multiple ECM proteins in HKFs (Figure 3, A and B). In addition, TGF1 treatment enhanced the proliferative activity of HKFs, which was abrogated completely by TXNDC5 knockdown (Figure 3D). These results suggest that TXNDC5 is essential for TGF-β1–induced HKF activation, proliferation, and ECM production. Overexpression of TXNDC5, on the other hand, resulted in marked upregulation of periostin, COL1A1, and fibronectin (Figure 3C), as well as increased proliferative activity (Figure 3E) in HKFs. Collectively, these results demonstrate that TXNDC5, downstream of TGF-β1, is both essential and sufficient to promote the activation, proliferation, and ECM production of kidney fibroblasts.
Figure 3. Knockdown of TXNDC5 attenuated TGF-β1–induced HKF activation and ECM production; overexpression of TXNDC5 was sufficient to trigger HKF activation and ECM production.
(A) Protein and (B) transcript expression levels of fibroblast activation marker (periostin) and ECM proteins (COL1A1, fibronectin, and CCN2) were increased in control (Scramble) HKFs following TGF-β1 (10 ng/mL) treatment. Knockdown of TXNDC5 attenuated the upregulation of these fibrogenic markers induced by TGF-β1 in HKFs (n = 5–10). (C) Overexpression of TXNDC5 was sufficient to induce upregulation of fibroblast activation marker (Periostin) and ECM proteins (COL1A1, fibronectin) in HKFs (n = 3–10). (D) Treatment of TGF-β1 (10 ng/mL) increased the cellular proliferation activity of HKFs, which was abrogated by TXNDC5 knockdown. (E) Overexpression of TXNDC5 increased the cellular proliferation activity of HKFs. In D and E, n = 10. Data are representative of 3 or more independent experimental replicates. For all panels, data are presented as mean ± SEM. The statistical significance of differences for 2 groups was determined by 2-sided t test and among 3 or more groups it was determined using 1-way ANOVA, followed by Sidak’s post hoc tests. *P < 0.05, **P < 0.01, ***P < 0.001.
Global deletion of Txndc5 protected against kidney fibrosis.
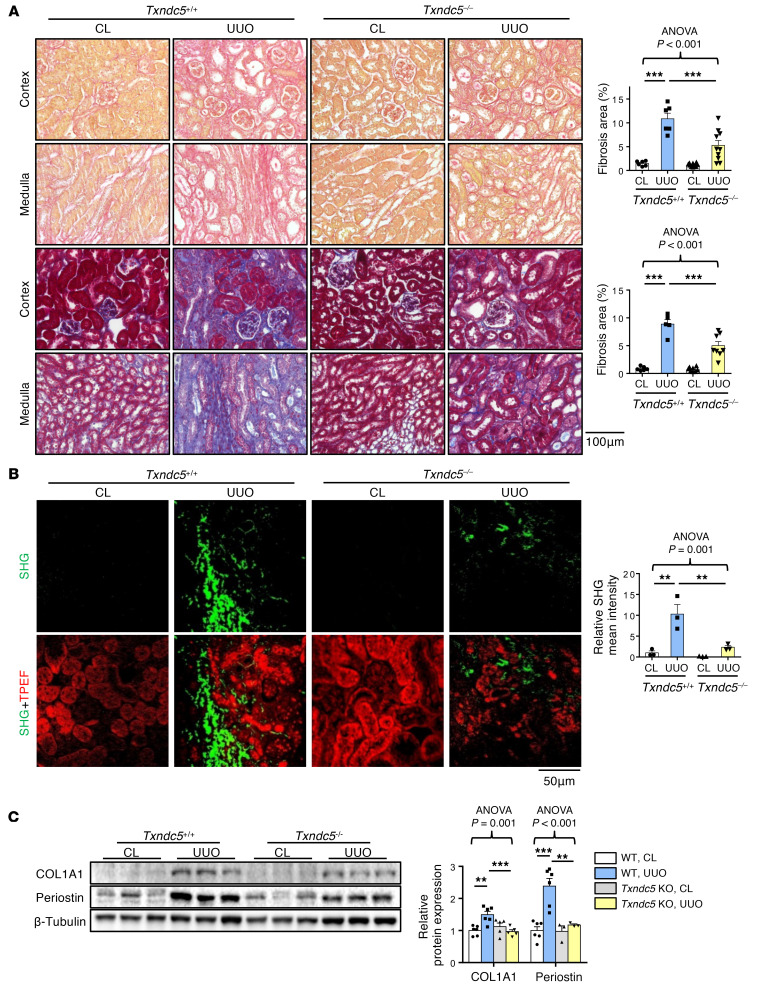
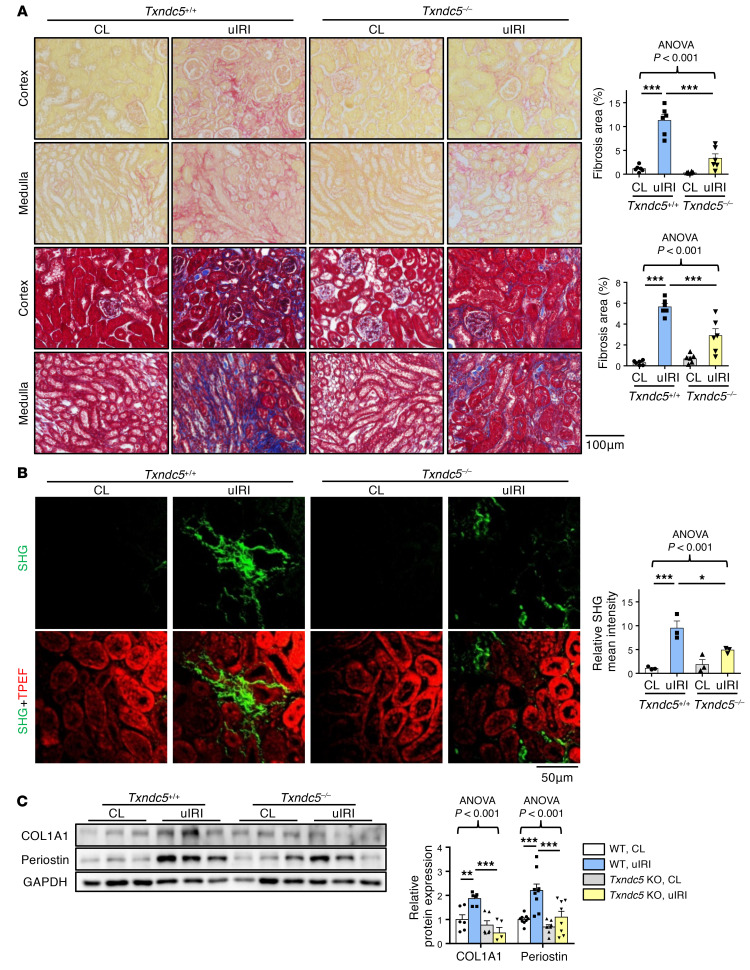
To determine the requirement of TXNDC5 in the development of kidney fibrosis in vivo, WT and Txndc5–/– mice were subjected to UUO, uIRI, and FA treatment. Picrosirius red and Masson’s trichrome staining on the kidney sections showed extensive renal fibrosis in WT mice following UUO (Figure 4A), uIRI (Figure 5A), and the administration of FA (Supplemental Figure 3A). Global deletion of Txndc5 significantly reduced the extent of renal fibrosis in all 3 kidney injury models (Figure 4A, Figure 5A, and Supplemental Figure 3A).
Figure 4. Deletion of Txndc5 attenuated renal fibrosis induced by UUO.
(A) Picrosirius red staining (top 2 panels) and Masson’s trichrome staining (bottom 2 panels) of kidney sections from WT and Txndc5–/– mice 10 days after UUO. Bar graphs of the quantitative results of Picrosirius red and Masson’s trichrome staining areas are shown on the right (n = 5–10). Scale bar: 100 μm. (B) SHG images of the kidney sections from WT and Txndc5–/– mice 10 days after UUO. The quantitative results of SHG-positive areas showed increased accumulation of fibrillar collagen (green) in WT but not in Txndc5–/– mice kidneys following injury. For each of the kidney sections imaged for SHG, TPEF imaging was obtained to show the profile of the scanned tissue (red color in bottom panels) (n = 3). Scale bar: 50 μm. (C) Immunoblots showed protein expression levels of fibroblast activation marker (Periostin) and ECM (COL1A1) in the whole-kidney extract from WT and Txndc5–/– mice 10 days after UUO (n = 3–6). Data are representative of 3 or more independent experimental replicates. For all panels, data are presented as mean ± SEM. The statistical significance of differences among 3 or more groups was determined using 1-way ANOVA, followed by Sidak’s post hoc tests. **P < 0.01, ***P < 0.001.
Figure 5. Deletion of Txndc5 ameliorated renal fibrosis induced by uIRI.
(A) Picrosirius red staining (top 2 panels) and Masson’s trichrome staining (bottom 2 panels) of kidney sections from WT and Txndc5–/– mice 28 days after uIRI. Bar graphs of the quantitative results of Picrosirius red and Masson’s trichrome staining areas are shown on the right (n = 6). Scale bar: 100 μm. (B) SHG images of the kidney sections from WT and Txndc5–/– mice 28 days after uIRI. The quantitative results of SHG-positive areas showed increased accumulation of fibrillar collagen (green) in WT but not in Txndc5–/– mice kidneys following injury. For each of the kidney sections imaged for SHG, TPEF imaging was obtained to show the profile of the scanned tissue (red color in bottom panels) (n = 3). Scale bar: 50 μm. (C) Immunoblots showed protein expression levels of fibroblast activation marker (Periostin) and ECM (COL1A1) in the whole-kidney extract from WT and Txndc5–/– mice 28 days after uIRI (n = 5–9). Data are representative of 3 or more independent experimental replicates. For all panels, data are presented as mean ± SEM. The statistical significance of differences among 3 or more groups was determined using 1-way ANOVA, followed by Sidak’s post hoc tests. *P < 0.05, **P < 0.01, ***P < 0.001.
To quantify pathogenic fibrillar collagen (type I and III) specifically and to avoid overestimation of fibrotic areas with traditional staining methods, second harmonic generation (SHG) microscopy, a novel optical tissue imaging system that allows visualization of fibrillar, but not non-fibrillar, collagen in fibrotic organs (23, 24), was employed to assess the extent of fibrosis in WT and Txndc5–/– mouse kidneys following injury. Consistent with the aforementioned results, SHG microscopy showed marked increases in fibrillar collagen deposition in WT kidneys following UUO (Figure 4B), uIRI (Figure 5B), and FA treatment (Supplemental Figure 3B), the extent of which was significantly reduced in Txndc5–/– mice (Figure 4B, Figure 5B, and Supplemental Figure 3B).
Consistent with the attenuated postinjury fibrotic response in Txndc5–/– mouse kidneys observed by imaging studies, deletion of Txndc5 also mitigated the upregulation of ECM protein genes, including Col1a1, Eln, Fn1, and Ccn2 in the mouse kidneys following injury (Supplemental Figure 3, C–E). Immunoblots of whole-kidney tissue lysates also showed reduced protein level of ECM (COL1A1) and fibroblast activation marker (periostin) in Txndc5–/– mice compared with WT mice following UUO and uIRI (Figure 4C and Figure 5C).
To determine if the reduced renal fibrosis observed in Txndc5–/– mice was due to lessened severity of acute injury, serological, tissue, and histological markers of acute kidney injury were quantified in Txndc5–/– and WT mice 1 day after uIRI. As shown in Supplemental Figure 3F, the serum level of neutrophil gelatinase–associated lipocalin (Ngal), a biomarker of acute kidney injury, was similarly elevated in WT and Txndc5–/– mice 1 day after uIRI surgery. In addition, transcript expression levels of acute kidney injury markers Ngal and Kim-1 (kidney injury molecule 1) were both significantly increased in the kidney tissues from WT and Txndc5–/– mice following uIRI (Supplemental Figure 3G). PAS staining of the kidney sections also did not reveal significant differences in the areas of tubular necrosis in WT and Txndc5–/– mice following uIRI (Supplemental Figure 3H). Collectively, these results suggest that the protective effects of Txndc5 deletion against renal fibrosis are not mediated through reducing the extent and severity of acute renal injury.
TXNDC5 augmented fibrogenic TGF-β signaling by increasing TGFBR1 protein expression in kidney fibroblasts.
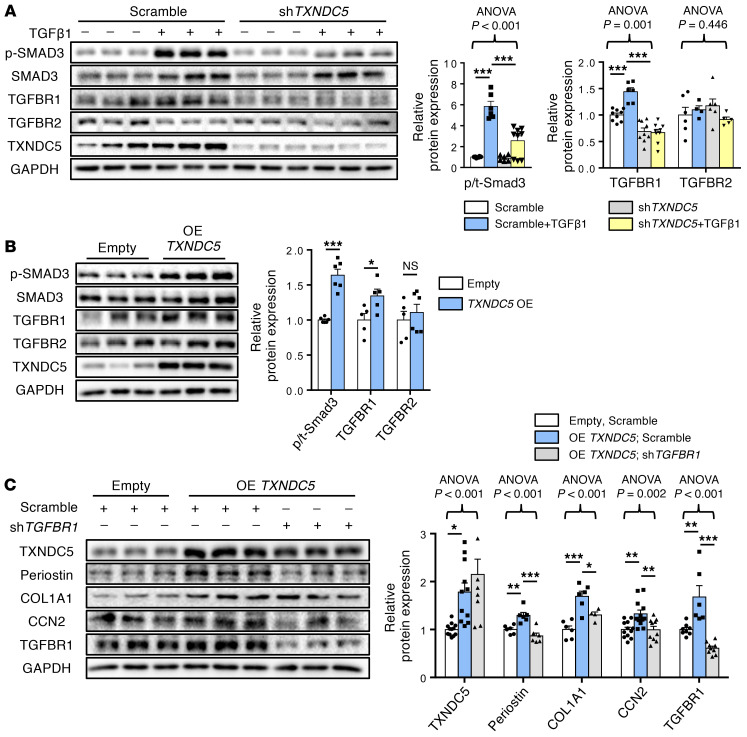
Because TXNDC5 was essential for TGF-β1–induced HKF activation and ECM production, we speculated that TXNDC5 could mediate its fibrogenic effects through regulating signaling effectors downstream of TGF-β1. Consistent with this hypothesis, knocking down TXNDC5 in HKFs led to reduced SMAD3 phosphorylation induced by TGF-β1 stimulation (10 ng/mL, Figure 6A), whereas TXNDC5 overexpression per se was sufficient to increase SMAD3 phosphorylation/activation in HKFs (Figure 6B). Because TGF-β1–mediated SMAD3 activation is strictly dependent on transmembrane TGF-β receptor type I (TGFBR1) and TGFBR2, we first determined if TXNDC5 would regulate TGFBR1 and TGFBR2. Indeed, knockdown of TXNDC5 blocked TGF-β1–induced upregulation of TGFBR1 without affecting TGFBR2 (Figure 6A), whereas overexpression of TXNDC5 led to marked upregulation of TGFBR1 but not TGFBR2 (Figure 6B) in HKFs. Consistent with these in vitro observations, global deletion of Txndc5 also abolished SMAD3 phosphorylation and TGFBR1 upregulation induced by UUO (Supplemental Figure 4A) or uIRI (Supplemental Figure 4B) in the mouse kidneys. Furthermore, knockdown of TGFBR1 (Figure 6C) or treatment with TGFBR1 inhibitor LY364947 (10 μM for 24 hours, Supplemental Figure 4C) repressed fibroblast activation (reflected by periostin expression level), SMAD3 phosphorylation and ECM (COL1A1, CCN2) production induced by TXNDC5 overexpression in HKFs. In addition, a cell-surface biotinylation assay was performed in HKFs with TXNDC5 knockdown or overexpression, followed by immunoblotting for TGFBR1. As shown in Supplemental Figure 4, D and E, TXNDC5 knockdown reduced, whereas TXNDC5 overexpression increased, cell surface expression of TGFBR1 in HKF. These results demonstrate that TXNDC5 modulates the functional expression levels of TGFBR1 on the cell surface of kidney fibroblasts. Taken together, these data suggest that TXNDC5 augments fibrogenic TGF-β1 signaling through increasing TGFBR1 expression levels in kidney fibroblasts.
Figure 6. TXNDC5-induced fibrogenic responses are mediated through TGFBR1.
(A) Immunoblots showed that treatment of TGF-β1 (10 ng/mL) induced upregulation of TGFBR1 and phosphorylation of SMAD3, whereas TGFBR2 was not affected. Knockdown of TXNDC5 abolished TGFBR1 upregulation and SMAD3 phosphorylation was induced by TGF-β1 in HKFs (n = 5–11). (B) Overexpression of TXNDC5 was sufficient to upregulate TGFBR1 and phospho-SMAD3 in HKFs (n = 5–6). (C) Knockdown of TGFBR1 abolished the upregulation of fibroblast activation markers and ECM proteins induced by TXNDC5 overexpression (n = 6–12). Data are representative of 3 or more independent experimental replicates. For all panels, data are presented as mean ± SEM. The statistical significance of differences for 2 groups was determined by 2-sided t test and among 3 or more groups it was determined using 1-way ANOVA, followed by Sidak’s post hoc tests. *P < 0.05, **P < 0.01, ***P < 0.001.
TXNDC5 increases TGFBR1 expression by enhancing TGFBR1 protein folding and stability.
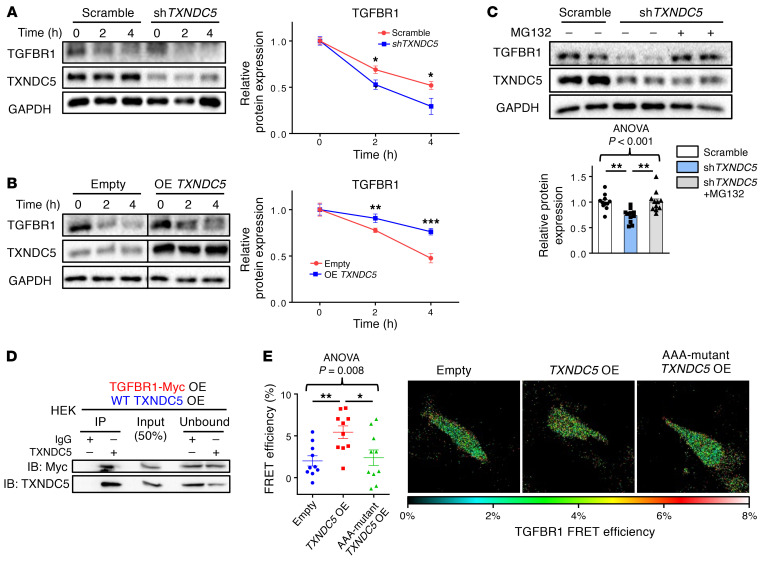
We sought to determine how TGFBR1 protein expression was affected by TXNDC5 in kidney fibroblasts. A cycloheximide (CHX) protein chase assay was performed to evaluate TGFBR1 protein stability in HKFs with TXNDC5 knockdown or overexpression. With the treatment of protein synthesis inhibitor CHX, knockdown of TXNDC5 in HKFs was shown to accelerate the degradation of TGFBR1 (Figure 7A), while overexpression of TXNDC5 delayed the degradation of TGFBR1 (Figure 7B). These results suggest that TXNDC5 increases the protein stability of TGFBR1 in kidney fibroblasts.
Figure 7. TXNDC5 enhances the protein folding and stability of TGFBR1.
(A) Cycloheximide chase assay showed that knockdown of TXNDC5 accelerated degradation of TGFBR1 in HKFs (n = 6). (B) Overexpression of TXNDC5 slowed down the degradation of TGFBR1 in HKFs. The 2 groups of samples were loaded and run on the same gel but not in neighboring lanes (n = 6). (C) Treatment of proteasome inhibitor MG132 restored the downregulation of TGFBR1 induced by TXNDC5 depletion in HKFs (n = 11). (D) Protein Co-IP experiments in HEK cells with ectopic expression of TXNDC5 and Myc-tagged TGFBR1 showed physical interaction between TXNDC5 and TGFBR1. (E) A dual fluorescence–labeled human TGFBR1 construct (CFP-TGFBR1-YFP) was used for FRET-based protein folding assay in HEK293 cells. Overexpression of TXNDC5 showed increased FRET efficiency compared with empty vector–transfected control cells, whereas AAA-mutant TXNDC5 transfection failed to increase the FRET signal (n = 10). Data are representative of 3 or more independent experimental replicates. For all panels, data are presented as mean ± SEM. The statistical significance of differences for 2 groups was determined by 2-sided t test and among 3 or more groups it was determined using 1-way ANOVA, followed by Sidak’s post hoc tests. *P < 0.05, **P < 0.01, ***P < 0.001.
It has been demonstrated that nascent polypeptides destined for the cell membrane or secretory pathway are correctly folded in the ER by chaperones or PDIs; misfolded proteins, however, are subjected to degradation via the ubiquitin-proteasome system (25–27). Because TXNDC5 is a member of the PDI family, we hypothesized that TXNDC5 facilitates the folding of TGFBR1 in the ER, thereby promoting the maturation and delivery of TGFBR1 to the cell membrane. Loss of TXNDC5, as a result, would lead to TGFBR1 misfolding and subsequent degradation by the proteasome. Consistent with this hypothesis, TXNDC5 depletion-induced TGFBR1 downregulation in HKFs was reversed with the treatment of proteasome inhibitor MG132 (Figure 7C). In addition, both protein coimmunoprecipitation experiments (Figure 7D and Supplemental Figure 5A) in human embryonic kidney cells 293 (HEK293 cells) with ectopic expression of TXNDC5 and myc-tagged TGFBR1 and a proximity ligation assay (Supplemental Figure 5B) in HKFs showed physical binding between TXNDC5 and TGFBR1.
Furthermore, the direct impact of TXNDC5 on the folding of TGFBR1 was determined using a fluorescence resonance energy transfer–based (FRET-based) protein folding assay that has been shown to successfully assess protein folding and unfolding in cells (17, 28). Human TGFBR1 fused with cyan fluorescence protein (CFP) at the N terminus and yellow fluorescence protein (YFP) at the C terminus (CFP-TGFBR1-YFP) was expressed in HEK293 cells, with or without TXNDC5 overexpression; effective FRET from CFP to YFP would only be detected when the CFP-TGFBR1-YFP fusion protein folds properly and brings CFP and YFP into close proximity. A standard acceptor photobleaching FRET protocol in cells expressing the TGFBR1 ternary fusion protein revealed that overexpression of TXNDC5 significantly increased FRET efficiency (Figure 7E), indicating enhanced TGFBR1 protein folding with elevated TXNDC5 levels. Importantly, overexpression of a mutant TXNDC5 that lacks PDI activity (AAA mutant TXNDC5: cysteine-to-alanine mutations were introduced in both ends of each of its 3 thioredoxin domains [CGHC to AGHA], thereby abolishing its PDI activity, ref. 17) failed to increase the extent of TGFBR1 folding (Figure 7E), suggesting that TXNDC5-mediated folding of TGFBR1 is dependent on its PDI activity. In line with these findings, forced expression of AAA mutant TXNDC5 also failed to increase the protein expression levels of TGFBR1, ECM protein (COL1A1) and fibroblast activation marker (periostin) in HKF (Supplemental Figure 5C).
Taken together, these results demonstrate that TXNDC5, as a protein disulfide isomerase, functions to maintain proper folding and stability of TGBFR1 protein in kidney fibroblasts. With the depletion of TXNDC5, TGFBR1 becomes unfolded and subsequently degraded by proteasome. In addition, TXNDC5-mediated regulation of TGFBR1 expression, ECM production and fibroblast activity is dependent on its PDI activity.
TGF-β1 induces TXNDC5 expression through increased ER stress and ATF6-dependent transcriptional control in kidney fibroblasts.
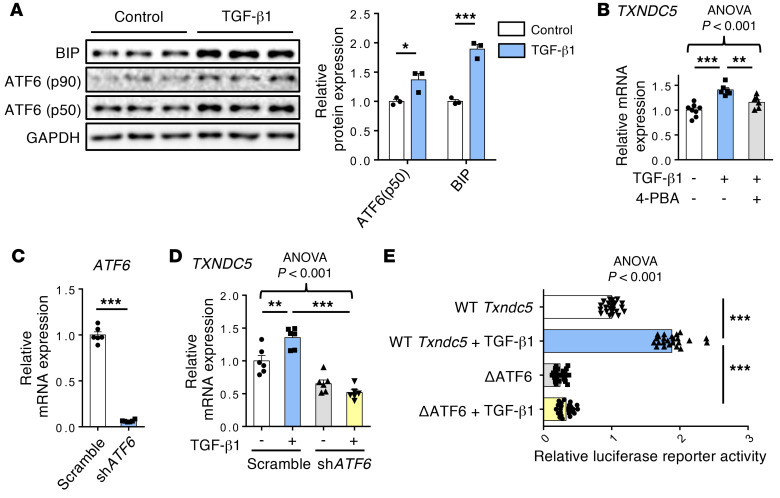
Next, we went on to determine how TXNDC5 is regulated by TGF-β1 in kidney fibroblasts. Because both the mRNA and protein expression levels of TXNDC5 were upregulated in response to TGF-β1 treatment in HKFs, we hypothesized that TGF-β1 controls TXNDC5 expression through transcriptional regulation. In cardiac fibroblasts, we have previously demonstrated that TGF-β1 treatment upregulates TXNDC5 through increased ER stress pathway activity and activating transcription factor 6–dependent (ATF6-dependent) transcriptional control (17). Consistent with these findings, TGF-β1 treatment induced elevated ER stress in HKFs, as evidenced by a marked increase in BIP and activated ATF6 (ATF6-p50), 2 ER stress markers (Figure 8A), which was accompanied by significant upregulation of TXNDC5 transcript (Figure 8B). The treatment of ER stress inhibitor 4–phenylbutyrate (4-PBA), however, blocked the transcriptional upregulation of TXNDC5 induced by TGF-β1 (Figure 8B). These results indicate that TGF-β1–induced TXNDC5 expression in kidney fibroblasts is dependent on increased ER stress.
Figure 8. TGF-β1 induces TXNDC5 expression through ER stress– and ATF6-dependent transcriptional regulation.
(A) ER stress components including BiP and activated ATF6 (ATF6-p50) were upregulated following the treatment of TGF-β1 (10 ng/mL) in HKFs (n = 3). (B) ER stress inhibitor 4-PBA blocked TXNDC5 transcript upregulation induced by TGF-β1 (10 ng/mL) (n = 6–8). (C) Quantitative real-time PCR showed effective ATF6 knockdown by shATF6 in HKFs (n = 6). (D) Depletion of ATF6 reversed TXNDC5 transcript upregulation induced by TGF-β1 (10 ng/mL) (n = 6). (E) In NIH-3T3 cells, TGF-β1 treatment increased the transcriptional activity of WT but not ATF6 binding–deleted mouse Txndc5 promotor (n = 24). Data are representative of 3 or more independent experimental replicates. For all panels, data are presented as mean ± SEM. The statistical significance of differences for 2 groups was determined by 2-sided t test and among 3 or more groups it was determined using 1-way ANOVA, followed by Sidak’s post hoc tests. *P < 0.05, **P < 0.01, ***P < 0.001.
In line with the observed ER stress–dependent transcriptional regulation of TXNDC5 in HKFs, analyses of human and mouse TXNDC5/Txndc5 promoter sequences identified putative binding sites of ER stress pathway transcription factor ATF6 (17, 29). Knockdown of ATF6 in HKFs with shRNA completely abrogated the upregulation of TXNDC5 transcript induced by TGF-β1 (Figure 8, C and D). Furthermore, WT and ATF6 binding site–deleted (TGACGTGG, +769~+780–deleted; ΔATF6) mouse Txndc5 promoter luciferase reporter constructs were transfected into mouse embryonic fibroblast NIH-3T3 followed by TGF-β1 stimulation. WT Txndc5 promoter activity was increased with the treatment of TGF-β1, whereas deletion of ATF6 binding site led to repressed Txndc5 transcriptional activity and completely abrogated its response to TGF-β1 stimulation (Figure 8E). Taken together, these data demonstrate that TGF-β1 induces TXNDC5 expression through increased ER stress and ATF6-mediated transcriptional control in kidney fibroblasts.
Renal fibroblast-specific deletion of Txndc5 markedly attenuated the extent of kidney fibrosis following injury.
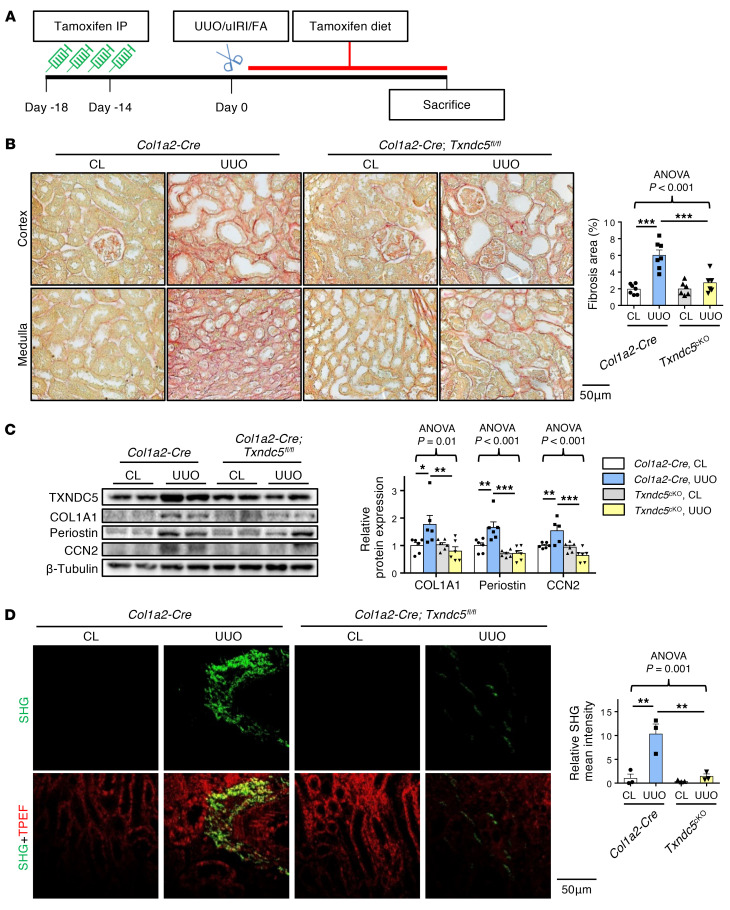
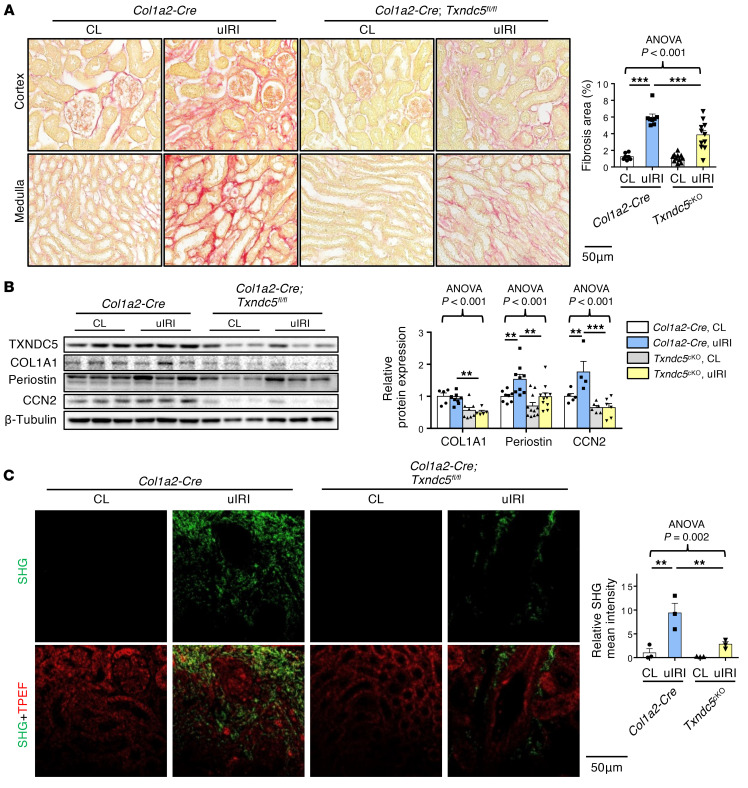
In the previous section, we showed that TXNDC5 was mainly distributed in collagen-secreting kidney fibroblasts. To determine the in vivo contribution of TXNDC5 in renal fibroblasts to the development of kidney fibrosis, we generated an inducible, fibroblast-specific Txndc5 knockout mice (Col1a2-Cre/ERT2*Txndc5fl/fl, abbreviated as Txndc5cKO). Tamoxifen (80 mg/kg/day intraperitoneally for 4 consecutive days) was administered to induce Txndc5 deletion in kidney fibroblasts. Two weeks after tamoxifen-induced Txndc5 deletion, Txndc5cKO were subjected to UUO, uIRI, or FA. These animals were kept on tamoxifen diet until the time of sacrifice to ensure deletion of Txndc5 in active and proliferating myofibroblasts throughout the course (Figure 9A). In these experiments, tamoxifen-treated Col1a2-Cre/ERT2 (Col1a2-Cre) mice were used as controls. Targeted deletion of Txndc5 in kidney fibroblasts markedly reduced the extent of kidney fibrosis induced by UUO, uIRI, or FA, compared with control mice (Figure 9B and Figure 10A, and Supplemental Figure 6A). In addition, the expression levels of ECM proteins COL1A1 and CCN2, as well as the fibroblast activation marker periostin, were also significantly decreased in Txndc5cKO compared with control mice following UUO or uIRI (Figure 9C and Figure 10B). Consistent with these findings, SHG also revealed reduced fibrillar collagen deposition in the kidneys from Txndc5cKO compared with that from control mice in response to UUO and uIRI (Figure 9D and Figure 10C).
Figure 9. Targeted deletion of Txndc5 in renal fibroblasts attenuated kidney fibrosis.
(A) Illustration of experimental design to induce Txndc5 deletion specifically in renal fibroblasts. (B) Picrosirius red staining of kidney sections from WT and Txndc5cKO mice 10 days after UUO (n = 6–7). Scale bar: 50 μm. (C) Immunoblots to quantify fibroblast activation marker (POSTN) and ECM (COL1A1 and CCN2) proteins in whole-kidney lysates from Col1a2-Cre and Txndc5cKO mice 10 days after UUO (n = 5–6). (D) SHG images of kidney sections from Col1a2-Cre and Txndc5cKO mice 10 days after UUO. The quantitative results of SHG-positive areas showed accumulation of fibrillar collagen in Col1a2-Cre kidneys, which was ameliorated in Txndc5cKO mice (n = 3). Scale bar: 50 μm. Data are representative of 3 or more independent experimental replicates. For all panels, data are presented as mean ± SEM. The statistical significance of differences among 3 or more groups was determined using 1-way ANOVA, followed by Sidak’s post hoc tests. *P < 0.05, **P < 0.01, ***P < 0.001.
Figure 10. Targeted deletion of Txndc5 in renal fibroblasts mitigated kidney fibrosis induced by uIRI.
(A) Picrosirius red staining of kidney sections from WT and Txndc5cKO mice 28 days after uIRI (n = 7–11). Scale bar: 50 μm. (B) Immunoblots to quantify fibroblast activation marker (POSTN) and ECM (COL1A1 and CCN2) proteins in whole-kidney lysates from Col1a2-Cre and Txndc5cKO mice 28 days after uIRI (n = 4–11). (C) SHG images of kidney sections from Col1a2-Cre and Txndc5cKO mice 28 days after uIRI. The quantitative results of SHG-positive areas showed accumulation of fibrillar collagen in Col1a2-Cre kidneys, which was ameliorated in Txndc5cKO mice (n = 3). Scale bar: 50 μm. Data are representative of 3 or more independent experimental replicates. For all panels, data are presented as mean ± SEM. The statistical significance of differences among 3 or more groups was determined using 1-way ANOVA, followed by Sidak’s post hoc tests. **P < 0.01, ***P < 0.001.
To exclude the possibility that TXNDC5 expressed in other renal cell types such as TECs, podocytes, and endothelial cells might still contribute to the development of renal fibrosis, we generated Txndc5 conditional knockout mice specific to TECs (Cdh16-cre*Txndc5fl/fl, or Txndc5Epi-cKO), podocytes (NPHS2-cre*Txndc5fl/fl, or Txndc5Podo-cKO), and endothelial cells (Tie2-cre/ERT2*Txndc5fl/fl, or Txndc5Endo-cKO). In experiments using Txndc5Epi-cKO and Txndc5Podo-cKO mice, Txndc5fl/fl mice were used as controls; in experiments on Txndc5Endo-cKO mice, Txndc5 deletion was induced using tamoxifen as described in Figure 9A, where tamoxifen-treated Tie2-Cre/ERT2 mice were used as controls. Targeted deletion of Txndc5 in TECs, podocytes, or endothelial cells, however, did not impact the extent of kidney fibrosis induced by UUO or FA (Supplemental Figure 6, B–E). These results suggest that TXNDC5 expressed in TECs, podocytes, and endothelial cells contributes little, if any, to the pathogenesis of kidney fibrosis.
Deletion of Txndc5 in kidney fibroblasts protects against TEC apoptosis in response to kidney injury.
In the process of renal fibrosis, injured TECs lose mitochondrial function and apicobasal polarity, followed by apoptosis and cell death (30). To investigate if deletion of Txndc5 impacts apoptosis of TECs in response to injury, we conducted TUNEL staining on WT and Txndc5–/– mouse kidney sections 10 days following UUO. The number of apoptotic TECs increased significantly in the UUO-induced fibrotic kidneys of WT mice, whereas deletion of Txndc5 attenuated the extent of TEC apoptosis (Supplemental Figure 7A). It has been reported that activated kidney fibroblasts could induce TEC apoptosis through paracrine effects (31). Because Txndc5 is barely expressed in TECs (Figure 2B), it is likely that the reduced TEC apoptosis observed in Txndc5–/– mice following UUO was not a cell autonomous effect but rather secondary to reduced interstitial fibrosis and hence fewer proapoptotic signals from surrounding kidney fibroblasts. Consistent with this hypothesis, fibroblast-specific deletion of Txndc5 (Txndc5cKO) attenuated TEC apoptosis to an extent similar to that observed in Txndc5–/– mice 10 days following UUO (Supplemental Figure 7B). In contrast to the observed reduction in TEC apoptosis, the number of F4/80-positive macrophages (Supplemental Figure 7C) and CD31-positive endothelial cells (Supplemental Figure 7D) were comparable in WT and Txndc5–/– mouse kidneys, with or without UUO, suggesting that Txndc5 deletion does not impact macrophage infiltration or peritubular capillary density in the mouse kidneys. Taken together, these data suggest that the renoprotective effects of Txndc5 deletion result from reduced tubular interstitial fibrosis and TEC apoptosis, without affecting renal capillary density or macrophages.
Induced deletion of Txndc5 in renal fibroblasts lessened the progression of established kidney fibrosis.
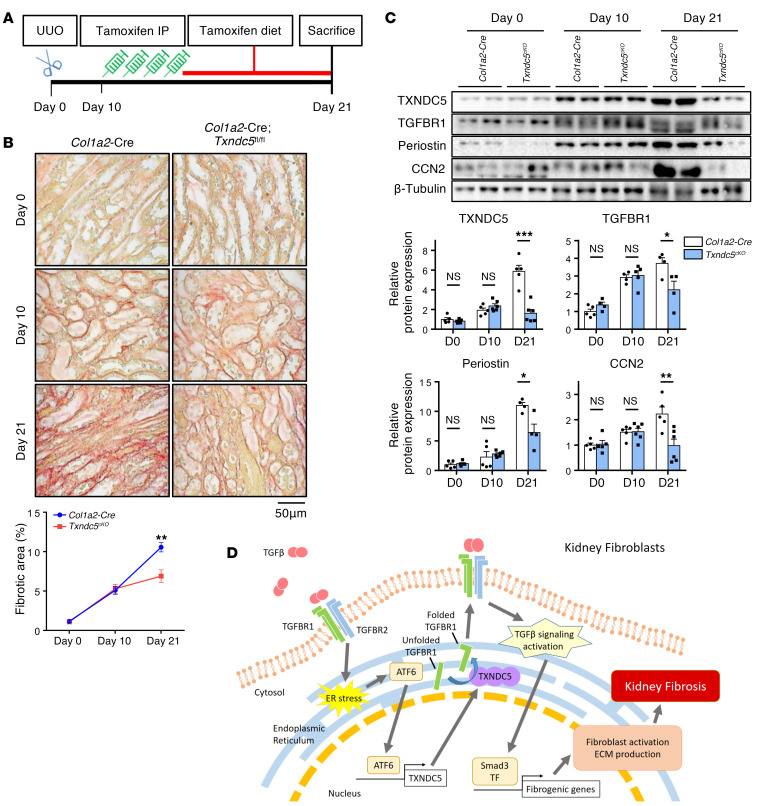
To determine if targeting Txndc5 in renal fibroblasts could be beneficial in established renal fibrosis, Txndc5 deletion in renal fibroblasts was induced in Txndc5cKO mice 10 days after UUO, a time point when extensive renal fibrosis can be observed (Figure 11A). In these experiments, tamoxifen-treated Col1a2-Cre mice were used as controls. As shown in Figure 11B, Col1a2-Cre and Txndc5cKO mice had a similar extent of renal fibrosis 10 days following UUO prior to tamoxifen treatment. Eleven days after tamoxifen injection, however, the extent of renal fibrosis continued to progress in control mice (fibrotic area increased from 5.1% to 10.6%), whereas the progression of kidney fibrosis was nearly halted (fibrotic area changed from 5.3% to 6.9%, Figure 11B) in Txndc5cKO mice. Immunoblotting also showed markedly attenuated upregulation of CCN2, periostin, and TGFBR1 in Txndc5cKO mice compared with control mice between D10 and D21 after UUO (Figure 11C). These results demonstrate that interventional deletion of Txndc5 in renal fibroblasts significantly lessens the progression of kidney fibrosis, suggesting that in vivo targeting of TXNDC5 could be a novel and powerful therapeutic approach to ameliorate kidney fibrosis and to slow down the progression of CKD.
Figure 11. Induced deletion of Txndc5 in renal fibroblasts mitigated the progression of established kidney fibrosis.
(A) Illustration of experimental design to induce Txndc5 deletion specifically in renal fibroblasts in mouse kidneys with established fibrosis. (B) Picrosirius red staining of kidney sections from Col1a2-Cre and Txndc5cKO mice. Ten days after UUO, Col1a2-Cre and Txndc5cKO mice showed a similar extent of renal fibrosis prior to tamoxifen injection. Eleven days after tamoxifen treatment, the fibrotic areas more than doubled (increased from 5.1% to 10.6%) in Col1a2-Cre, but barely changed in Txndc5cKO (changed from 5.3% to 6.9%) mouse kidneys (n = 5–6). Scale bar: 50 μm. (C) Protein expression levels of fibroblast activation marker (periostin), ECM (CCN2), and TGFBR1 in whole-kidney lysate from Col1a2-Cre and Txndc5cKO mice (n = 4–6). (D) Schematic summary of the proposed profibrotic mechanisms by which TXNDC5 contributes to the pathogenesis of renal fibrosis. TF: transcription factor. Data are representative of 3 or more independent experimental replicates. For all panels, data are presented as mean ± SEM. *P < 0.05, **P < 0.01, ***P < 0.001 by 2-sided t test.
Discussion
In this study, we demonstrate that TXNDC5, an ER-resident protein disulfide isomerase enriched in renal fibroblasts, contributes critically to the pathogenesis of renal fibrosis. TXNDC5 was upregulated both in the kidneys from patients with CKD and from mouse models of renal fibrosis induced by UUO, uIRI, or FA treatment. Mechanistic investigations showed that TXNDC5 promotes renal fibrogenesis by enhancing profibrotic TGF-β signaling through increasing the protein folding and stability of TGFBR1, leading to the activation and proliferation of renal fibroblasts that produce excessive ECM proteins. In addition, TGF-β1 induces TXNDC5 expression through increased ER stress level and ATF6-dependent transcriptional control in renal fibroblasts. Consistent with the profibrogenic effects of TXNDC5 observed in kidney fibroblasts, global deletion of Txndc5 protects against renal fibrosis induced by UUO, uIRI, or FA. Targeted deletion of Txndc5 in collagen-secreting renal fibroblasts, but not in TECs, endothelial cells, and podocytes, could mitigate the establishment and lessen the progression of renal fibrosis in response to injury. Taken together, these results reveal a novel causal role of TXNDC5 in the development of renal fibrosis through the regulation of TGFBR1 and TGF-β1 signaling. These data also suggest that targeting TXNDC5 is a potential powerful therapeutic approach to treat or prevent renal fibrosis and CKD. A schematic in Figure 11D illustrates the regulation and fibrogenic function of TXNDC5 in kidney fibroblasts.
TGF-β1 signaling plays an essential role in the development of renal fibrosis (32–34). Following insults to the kidneys, TGF-β1 is released from injured TECs and triggers the activation of TGF-β1 signaling in surrounding kidney fibroblasts (4). TGF-β1 binds to TGFBR2, which recruits, phosphorylates, and activates TGFBR1. Phosphorylated TGFBR1 then activates SMAD3-dependent canonical TGF-β1 signaling, as well as Ras and TAK1, constituents of SMAD-independent, noncanonical TGF-β1 signaling (35). Pharmacological inhibition of TGF-β signaling using neutralizing antibodies (36–38) or inhibitors (39, 40) has shown protective effects against renal fibrosis in preclinical models. In particular, pentoxifylline, a nonspecific phosphodiesterase inhibitor clinically proven to slow down the decline of glomerular filtration rate and to improve proteinuria (16, 41), was found to attenuate renal fibrosis by blocking the Smad3/4-mediated fibrogenic effects (14). Although TGF-β1 pathway inhibition appears to be an attractive strategy to treat renal fibrosis, most, if not all, pharmacological agents targeting TGF-β1 or TGF-β receptors directly failed in clinical trials (42). Because TGF-β signaling plays essential physiological roles in development, cell differentiation, tissue homeostasis, and immune response (43), direct inhibition of TGF-β signaling could lead to impaired physiological functions and adverse reactions including liver (44) and cardiac toxicity (45, 46). The results presented here reveal a novel positive feedback loop of the TGF-β1/ATF6/TXNDC5/TGFBR1 signaling axis in kidney fibroblasts, where TGF-β1 induces the upregulation of TXNDC5 through ER stress and ATF6-mediated transcriptional control. Increased TXNDC5 level further enhances the folding and stability of TGFBR1, leading to amplified TGF-β1 signaling and subsequent fibrogenic response. Targeting TXNDC5, therefore, could repress fibrogenic TGF-β1 signaling by breaking this positive feedback loop and hence attenuating renal fibrogenesis. The fibroblast-restricted nature of TXNDC5 also makes it a favorable drug target to avoid the risk of disturbing TGF-β–dependent physiological functions in nonfibroblast cells.
Exploiting a global Txndc5 deletion mouse line, we demonstrated that loss of TXNDC5 could prevent renal fibrogenesis in response to kidney injuries. However, it is more clinically pertinent to determine if targeting TXNDC5 could deter or even resolve existing kidney fibrosis. To address this question, a tamoxifen-inducible, fibroblast-specific Txndc5 conditional knockout mouse line (Txnd5cKO) was utilized, and it showed that the induction of Txndc5 deletion in kidney fibroblasts 10 days after UUO, a time point when renal fibrosis was established (Figure 11B), significantly eased the progression and expansion of renal fibrosis than in control mice. These data strongly suggest the potential of targeting TXNDC5 as a novel therapeutic approach to halt the progression of renal fibrosis in patients with CKD. Of note, serum levels of blood urea nitrogen (BUN) and creatinine were not measured in the mouse models used in the current study owing to the fact that BUN/creatinine levels are unaffected in UUO and uIRI models and are somewhat variable in the folic acid nephropathy model (47–49). Further studies are required to determine the impact of Txndc5 deletion on renal function using CKD mouse models induced by 5/6 nephrectomy and/or cyclosporin/cisplatin treatment, models with apparent changes in BUN and creatinine levels (48).
The magnitude of fibrotic area reduction observed in Txndc5cKO mice was relatively lower than that observed in Txndc5–/– mice. This could be owing to incomplete deletion of Txndc5 in renal fibroblasts related to the efficiency of cre-mediated recombination. Although residential renal fibroblasts are considered the major source of scar-forming myofibroblasts in fibrogenic kidney diseases (50), epithelial-to-mesenchymal transition (EMT, refs. 51, 52) and endothelial-to-mesenchymal transition (EndoMT, ref. 53) have been shown to contribute to the development of renal fibrosis. Because TXNDC5 was also expressed in a fraction of TECs and endothelial cells, we could not exclude the possibility that TXNDC5 could also contribute to kidney fibrogenesis through promoting EMT or EndoMT in these cells. Further studies are required to test this hypothesis directly. The tamoxifen-inducible, fibroblast-specific conditional knockout mouse line used in the present study, however, allows deletion of Txndc5 in collagen-producing active myofibroblasts regardless of their origins (i.e., from TECs or endothelial cells). The notion that fibroblast-specific deletion of Txndc5 effectively eased the development and progression of postinjury renal fibrosis in mice, therefore, remains unchanged whether TXNDC5 plays any role in EMT- or EndoMT-mediated kidney fibrogenesis.
Although TGF-β signaling is generally considered a central mediator of renal fibrosis, TGF-β signaling per se can be essential to maintain the homeostasis and health of kidney tissue. Conditional deletion of Tbgbr2 in renal tubular cells, for example, leads to increased NF-kB signaling and renal inflammation (54). Deletion of Tbgbr2 in collecting ducts exacerbates renal fibrosis in response to UUO, possibly by enhancing paracrine TGF-β signaling between epithelial and interstitial cells (55). In a study by Neelisetty et al, selective deletion of Tbgbr2 in matrix-producing interstitial cells using Col1a2-Cre/ERT2*Tgfbr2fl/fl and Tenascin C-Cre/ERT*Tgfbr2fl/fl mice did not show protection against renal fibrosis induced by UUO or aristolochic acid (56), suggesting that abrogating TGF-β signaling in renal fibroblasts may not be sufficient to reduce postinjury renal fibrosis. Here, we showed that fibroblast-specific Txndc5 deletion (using Col1a2-Cre/ERT2*Txndc5fl/fl) results in reduced TGFBR1, TGF-β signaling activity and fibrosis in the kidneys. The observation that deletion of Txndc5, but not Tgfbr2, in renal fibroblasts/interstitial cells reduces renal fibrosis suggests that deletion of Txndc5 may have additional antifibrotic effects that are independent of TGF-β signaling. Indeed, we have previously shown that in cardiac fibroblasts, TXNDC5, as a PDI, also promotes fibrogenesis through facilitating the folding and production of ECM proteins (17). It is also possible that Txndc5 deletion could result in additional inhibition of fibrogenic signaling pathways independent of TGF-β receptors such as PDGF, CCN2, Hedgehog, and HIF-1α signaling (57), thereby potentiating its antifibrotic effects in the kidneys. Further experiments will be required to test these hypotheses directly.
In conclusion, the present study revealed an essential and previously unrecognized role of renal fibroblast-enriched ER protein TXNDC5 in the pathogenesis of renal fibrosis. Experimental evidence suggests that TXNDC5 promotes renal fibrosis by augmenting TGF-β signaling activity through enhancing the folding and stability of TGFBR1 in renal fibroblasts, leading to excessive myofibroblast transdifferentiation, proliferation, and ECM production. Targeted deletion of Txndc5 in renal fibroblasts protects against the development and progression of postinjury renal fibrosis. These results suggest that targeting TXNDC5 could be a novel and powerful approach to treat or prevent renal fibrosis and CKD.
Methods
Generation of Txndc5–/– mice, Txndc5fl/fl mice, and cell type–specific Txndc5 conditional knockout mice.
The generation of Txndc5–/– mice has been previously described (17). Txndc5fl/fl mice were generated using CRISPR/Cas9 genome editing (Supplemental Figure 8A). To generate floxed Txndc5 (at exon 2 and 3) allele via homology directed repair, Cas9 mRNA, 2 single-guide RNAs (sgRNA) targeting intron 1 and intron 3 of Txndc5, and 2 single-strand donor oligodeoxynucleotides (ssODNs) carrying a loxP site to be knocked-in at introns 1 and 3, respectively, were coinjected into C57BL/6J mouse zygotes. In short, 2 sgRNAs flanking exon2 (sgRNA1) and exon3 (sgRNA2) of Txndc5 were designed using CRISPR tool website (http://tools.genome-engineering.org) and plugged into the pX458 vectors. The resulting sequences are sgRNA1: 5′ggaaacagaAATATCACACGTTTACTCGGaggtcaa3′ and sgRNA2: 5′tcagaggttCAATCCA GTATCATCAAGGCaggaacatg 3′. T7 promoter sequence was then added to the Cas9 coding region and the sgRNAs by PCR amplification. T7-Cas9 and T7-sgRNA PCR products were served as templates for in vitro transcription with mMESSAGE mMACHINE T7 ULTRA kit (Thermo Fisher Scientific). Both the Cas9 mRNA and the sgRNAs were purified by MEGAclear kit (Thermo Fisher Scientific). Two ssODNs carrying a loxP site that were to be inserted into intron 1 or intron 3 of Txndc5 were designed: 5′loxP ODN (for intron 1): 5′-TGAGCTCCAGGGGCACAACAAGCTATACGTTCCAGGAAACAGAAATATCACACGTTTACTGAATTCATAACTTCGTATAATGTATGCTATA CGAAGTTATCGGAGGTCAATTAAAAGTCTAGGAGGCAGGGTCTGGCATAGAGGTCAAAAAAGAATACTA-3′, and 3′loxP ODN (for intron 3): 5′-GAGGATAACATTTAATTGGGGCTGGTGTATAGGTTCAGAGGTTCAATCCAGTATCATCAGAATTCATAACTTCGTATAATGTATGCTATACGAAGTTATGG CAGGAACATGGCAGCATCCAGGCAGGCATGGTGCAGAAGGAGCTGAGAGTTCTGTATC-3′.
Purified Cas9 mRNA, sgRNA1, sgRNA2, 5′loxP ODN, and 3′loxP ODN were coinjected into 1-cell mouse zygotes (C57BL6/J) in M2 media (Millipore Corp) using a Piezo impact-driven micromanipulator. The injected blastocysts (2.5 dpc) were transferred into the uterus of pseudopregnant female mice. The preparation of mouse zygotes, pronuclei microinjection of Cas9 mRNA/sgRNAs, blastocysts transfer, and initial breeding of the Txndc5fl/fl animals were performed by the Transgenic Mouse Core Laboratory in National Taiwan University. To confirm the presence of an allele in founder with successful knock-in of 2 loxP sites that flanked exons 2 and 3 of Txndc5, PCR primers were designed to identify 2 loxP knock-in sequences at the intended target site, as indicated by the presence of mutant PCR amplicons (5′loxP: 487 bp, 5VF1+5VR1; 3′loxP: 449 bp, 3VF2+3VR2, Supplemental Figure 8, A–C). PCR, TA cloning, and DNA sequencing confirmed the presence of the successfully loxP knocked-in allele. The potential off-target mutagenesis of CRISPR was assayed by RFLP/sequencing analysis at off-target sites predicted by CRISPR Design Tool. This founder was crossed to WT C57BL/6J mice to obtain Txndc5fl/+ offspring; the F1 Txndc5fl/+ progenies were then crossed to generate homozygous Txndc5fl/fl mice. F2 Txndc5fl/fl mice were born at the expected Mendelian frequency and, at baseline, showed no detectable structural anomalies or developmental defects.
To generate the inducible, fibroblast, or endothelial cell–specific Txndc5 conditional knockout mouse lines, Txndc5fl/fl mice were bred with Col1a2-Cre/ERT2 (purchased from Jackson Laboratory, #029567) or Tie2-Cre/ERT2 (purchased from National Laboratory Animal Center, NARLabs) transgenic mice, respectively. To activate the Cre-ERT system, tamoxifen (80 mg/kg/day, dissolved in olive oil) was injected intraperitoneally for 4 consecutive days 2 weeks before the induction of renal fibrosis in control, Txndc5cKO, and Txndc5Endo-cKO mice. After UUO, uIRI, or FA, tamoxifen diet was administered until sacrifice in order to ensure the deletion of Txndc5 in newly generated myofibroblasts.
To generate TECs or a podocyte-specific conditional Txndc5 knockout mouse line, Txndc5fl/fl mice were bred with Cdh16-Cre (purchased from National Laboratory Animal Center, NARLabs) or NPHS2-Cre (purchased from Jackson Laboratory, #008523) transgenic mice, respectively.
Generation of cell type–specific fluorescence reporter mice.
Col1a1-GFPTg mice (20) were provided by David Brenner (Department of Medicine, University of California) and were applied to label active renal fibroblasts with GFP. Cdh16-Cre, NPHS2-Cre, and Tie2-Cre/ERT2 mice were crossed with tdTomato reporter mice (B6.Cg-Gt(ROSA)26Sortm14(CAG-tdTomato)Hze/J, purchased from Jackson Laboratory, #007914; ref. 58) to label TECs, podocytes, and endothelial cells with tdTomato, respectively. For Tie2-Cre/ERT2 tdTomato mice, tamoxifen was injected (80 mg/kg/day i.p. for 4 days) to induce the labeling of endothelial cells.
Mice kidney fibrotic models.
Male C57BL/6 mice, 8 to 10 weeks old, Txndc5–/–, Txndc5fl/fl, and cell type–specific conditional knockout mice were subjected to various kidney injury models to induce renal fibrosis. UUO was performed by permanent ligation of the right ureter with 6-0 silk. Ureter-ligated kidneys and contralateral kidneys (CLs), used as nonfibrotic controls, were collected 10 days after surgery. To establish uIRI, left renal pedicles were clamped with microaneurysm clips for 30 minutes followed by reperfusion. During uIRI surgery, mice were placed on a heating pad to maintain body temperature at 37°C. Injured and contralateral kidneys were collected 1 day or 28 days after surgery for analyses. Folic acid–induced renal fibrosis (FA) was conducted by single intraperitoneal injection of 250 mg/kg folic acid (Sigma-Aldrich, 7876) dissolved in 0.3M sodium bicarbonate, and mice were sacrificed 14 days after FA treatment. Mice injected with sodium bicarbonate served as vehicle control.
Histology.
Mouse kidneys were fixed in 10% formaldehyde, embedded in paraffin, and sectioned in 5 μm thickness for Masson’s trichrome (Sigma-Aldrich), Picrosirius red (Abcam), or Periodic Acid-Schiff (Muto Pure Chemical) staining. Measurement of the fibrotic area was quantified with ImageJ software (NIH, http://rsbweb.nih.gov/ij/).
Immunohistochemical (IHC) staining.
Mouse kidneys were fixed in 10% formaldehyde for at least 24 hours and embedded in paraffin. Embedded kidney samples were sliced in 5 μm thickness and proceeded to IHC staining by Novolink Polymer Detection System (Leica Biosystems) as previously described (17). In brief, mouse kidney sections were deparaffinized followed by antigen retrieval, treated with Peroxidase Block, incubated with anti-TXNDC5 (1:1500, Proteintech, 19834-1-AP) primary antibody overnight at 4°C. Tissue sections were then washed, incubated with Post Primary for 1 hour at room temperature, and treated with Novolink Polymer for 15 minutes. The sections were then developed with DAB solution, counterstained with hematoxylin, and mounted with mounting medium. Measurement of the staining area was performed using ImageJ.
Immunofluorescence (IF) staining.
Mouse kidneys were fixed in 4% paraformaldehyde for 3–4 hours, dehydrated in 30% sucrose, and embedded in Tissue-Tek O.C.T. (SAKURA). Frozen kidney samples were sliced in 5 μm thickness and proceeded to IF staining as previously described (17). In short, kidney sections were permeabilized and blocked with 0.1% Tween 20 in 2% BSA for 1 hour, incubated with rabbit anti-TXNDC5 (1:1500, Proteintech, 19834-1-AP), rat anti-F4/80 (1:1000, Abcam, ab6640), or rabbit anti-CD31 (1:500, Abcam, ab24590) primary antibody overnight at 4°C. After washing, the sections were treated with Alexa Fluor 594–labeled or DyLight 488–labeled anti-rabbit or anti-rat secondary antibodies at room temperature for 1 hour. The sections were then washed and mounted with ProLong Gold (Thermo Fisher Scientific). Measurement of the fluorescence staining area was performed using ImageJ.
TUNEL staining.
Mouse kidneys were fixed in 10% formaldehyde for at least 24 hours and embedded in paraffin. Embedded kidney samples were sliced in 5μm thickness and proceeded to TUNEL staining by TUNEL Assay Kit (Abcam, ab66110). In brief, mouse kidney sections were deparaffinized followed by antigen retrieval, labeled with Br-dUTP for 1 hour at 37°C, and incubated with anti–BrdU-Red antibody for 30 minutes at room temperature. The sections were then washed and mounted with ProLong Gold (Thermo Fisher Scientific). Measurement of the staining area was performed using ImageJ.
Human primary kidney fibroblasts (HKFs).
Human primary kidney fibroblasts (Cell Biologics, H-6016) were seeded in 1% gelatin–coated (Sigma-Aldrich, G1393) plates and maintained in complete Fibroblast Medium-2 (ScienCell, 2331) in a humidified incubator supplemented with 95% air/5% CO2 at 37°C.
Human embryonic kidney 293 cells (HEK293).
Human embryonic kidney 293 cells were purchased from American Type Culture Collection (ATCC) and maintained in HyClone Dulbecco’s Modified Eagle Medium (Cytiva, SH30022) with 10% FBS, 1% glutamine, and 1% penicillin/streptomycin solution in a humidified incubator supplemented with 95% air/5% CO2 at 37°C.
NIH-3T3 mouse fibroblasts.
NIH-3T3 mouse fibroblasts were purchased from ATCC and maintained in Dulbecco’s Modified Eagle Medium (Gibco, 12100061) with 10% FBS and 1% penicillin/streptomycin solution in a humidified incubator supplemented with 95% air/5% CO2 at 37°C.
TGF-β1 stimulation.
HKFs were incubated in TGF-β1 (PeproTech) at 10 ng/μL for 48 hours followed by downstream experiments. For SMAD3 phosphorylation assessment, cell lysates were collected 6 hours after TGF-β1 treatment.
Lentiviral transduction for gene knockdown and overexpression.
Lentivirus particles packed with shRNAs pLKO-shTXNDC5 (#TRCN0000333258), pLKO-shATF6 (#TRCN0000416318), and pLKO-shTGFBR1 (#TRCN0000196326) were applied to knockdown TXNDC5, ATF6, and TGFBR1, respectively. Lentiviral particles containing pLKO-shScr (#TRC001) were used as nontargeting control (MOI = 10). To overexpress TXNDC5, lentiviral particles containing full-length human TXNDC5 cDNA (pLAS2w.pPuro-TXNDC5) were used, where lentiviral particles expressing an empty pLAS2w.pPuro vector were used as control.
RNA extraction and quantitative real-time PCR (qRT-PCR).
Total RNA was extracted from cells and kidney tissue using TRIzol (Thermo Fisher Scientific) according to the manufacturer’s protocols. Maxima First Strand cDNA Synthesis Kit (Thermo Fisher Scientific) was used for RNA reverse transcription and SYBR Green–based qRT-PCR was performed as previously described (17). The transcript expression level of each gene was normalized to that of endogenous control gene GAPDH and expressed as a relative ratio to the mean values of control samples.
Immunoblot analysis.
Cells and mouse kidney tissues were homogenized in 1X Cell Lysis Buffer (Cell Signaling Technology) supplemented with protease and phosphatase inhibitors (Omics). After being centrifuged for 15 minutes (10,000g) at 4°C, the supernatant was collected and the protein concentrations were quantified using Pierce BCA Protein Assay Kit (Thermo Fisher Scientific) according to the manufacturer’s recommendation. Protein lysates were mixed with 4× protein loading buffer (Omics) and boiled for 5 minutes at 95°C. Protein samples were fractionated on 8% or 10% SDS-PAGE gel, transferred to PVDF membranes, and blocked in blocking buffer (5% BSA, 0.1% Tween 20 in PBS). Membranes were incubated with primary antibodies (list provided below) overnight at 4°C. Blots were developed using HRP-conjugated anti-mouse or anti-rabbit IgG secondary antibodies (1:10000, Thermo Fisher Scientific) and WesternBright ECL HRP substrate (Advansta). Protein bands were imaged using ChemiDoc MP system (BioRad Laboratories). The intensity of protein bands was quantified with ImageLab software version 5.1.
List of antibodies used in immunoblots.
COL1A1 (1:1000, Aviva Systems Biology, OAAB10798, for mouse species), COL1A1 (1:1000, OriGene, TA309096, for human species), CCN2, TGFBR2 (1:1000, OriGene, TA323092, TA311643), POSTN, ATF6, N-cadherin (1:1000, 1:1000, 1:3000, GeneTex, GTX100602, GTX104820, GTX127345), FN1 (1:1000, BD Biosciences, 610077), TXNDC5, β-tubulin (1:30000, 1:5000, Proteintech, 19834-1-AP, 66240-1-Ig), BiP (1:1000, Cell Signaling Technology, 3177), p-SMAD3 (1:1000, Abcam, ab40854), total-SMAD3 (1:1000, Cell Signaling Technology, 9523, for mouse species), total-SMAD3 (1:1000, Abcam, ab52903, for human species), TGFBR1 (1:1000, Thermo Fisher Scientific, PA5-32631, for human species), TGFBR1 (1:1000, Abcam, ab31013, for mouse species), and GAPDH (1:5000, Thermo Fisher Scientific, MA5-15738).
Fibroblast proliferation assay.
Fibroblast proliferation rates were accessed using a Cell Proliferation ELISA BrdU kit (Sigma-Aldrich) according to the manufacturer’s recommendations. In short, HKFs were seeded in a 96-well plate (3000 cells/well), labeled with 10 μmol/L bromodeoxyuridine (BrdU) in a 96-well plate for 48 hours at 37°C, followed by a colorimetric ELISA assay using a spectrophotometer (absorbance at 370 nm, reference wavelength 492 nm).
Protein stability assay.
TGFBR1 protein stability was measured using a cycloheximide pulse chase assay as previously described (17). In short, scramble, empty, TXNDC5 knockdown, or TXNDC5-overexpressed HKFs were treated with 100 μg/mL cycloheximide to block protein translation. TGFBR1 protein levels were quantified with immunoblotting at 0, 2, 4 hours after cycloheximide treatment and expressed as percentages relative to time 0.
TXNDC5 promoter luciferase activity assay.
TXNDC5 promoter luciferase activity assay was conducted as previously described (17). Mouse WT (pGL3-mTxndc5, –1000 to +1000, WT Txndc5) and ATF6 binding site–deleted (pGL3-mTxndc5, +769 to +780 deleted, ΔATF6) Txndc5 promotor constructs were transfected into NIH3T3 cells for 24 hours followed by TGF-β1 (10 ng/mL) treatment for 48 hours. Luciferase activity measurement was processed using Luc-Pair Luciferase Assay Kit 2.0 (GeneCopoeia) according to the manufacturer’s instruction.
Coimmunoprecipitation (Co-IP).
Human TXNDC5 (pLAS2w-p.puro-TXNDC5) and myc-tagged human TGFBR1 (pCMV-Myc-TGFBR1) were cotransfected into HEK293 cells for 48 hours. Protein lysates were incubated with rabbit anti-TXNDC5 (Proteintech, 19834-1-AP) or mouse IgG isotype control (Cell Signaling Technology, 5415S). Immunoprecipitation of TXNDC5 was conducted using a magnetic IP kit (Thermo Fisher Scientific), where protein Co-IP with TXNDC5 was eluted and subjected to immunoblotting using the antibodies and protocols described above.
In situ proximity ligation assay (PLA).
To determine the physical interaction between proteins (TXNDC5 and TGFBR1), Duolink in situ PLA (Sigma-Aldrich) was conducted according to the manufacturer’s instructions. Briefly, 4% PFA–fixed HKFs were permeabilized and blocked with 0.1% Tween 20 in 2% BSA for 1 hour, followed by incubation with anti-TXNDC5 (1:1500, Proteintech, 19834-1-AP) and anti-TGFBR1 (1:100, Abnova, H00007046-A01) overnight at 4°C. After washing, cells were incubated with PLA probes for 1 hour at 37°C, followed by ligation and amplification. Physical interaction between TXNDC5 and TGFBR1 was detected by PLA signals (red fluorescence) imaged by a fluorescence microscope. HKFs incubated with anti-TXNDC5 and anti-GAPDH (1:500, Thermo Fisher Scientific, MA5-15738) antibodies or without antibodies were used as negative controls.
FRET-based protein folding assay.
Plasmids encoding human TGFBR1 fused with a CFP at the N′ terminus and a YFP at the C′ terminus were constructed (CFP-TGFBR1-YFP) and transfected into HEK293 cells. When TGFBR1 is corrected, folded fluorescence resonance energy will be transferred from donor (CFP) to acceptor (YFP) fluorophore. In these experiments, a plasmid encoding a fusion protein that connects CFP and YFP with a short connecting peptide of 15 amino acid residues (CFP-YFP) was used as a positive control, whereas a plasmid with a dicistronic operon for coexpression of isolated CFP and YFP (CFP-IRES-YFP) was used as a negative control. WT and AAA-mutant TXNDC5- or empty vector–expressed HEK293 cells were transfected with CFP-TGFBR1-YFP for 48 hours before image acquisition.
A standard photobleaching FRET protocol was conducted using a Carl Zeiss Confocal Laser Scanning Microscope 780 (LSM 780) to determine FRET efficiency (17, 59, 60). Photobleaching was performed by repeated laser scanning at a selected target cell using 514 nm at maximal intensity. For CFP, an excitation wavelength of 458 nm and an emission wavelength of 470 to 500 nm were used. For YFP, an excitation wavelength of 514 nm and an emission wavelength of 525 to 545 nm were used. ZEN Black 2.3 software (Carl Zeiss) was used to quantify and analyze the FRET signals. The difference between total fluorescence before and after photobleaching was divided to postbleaching total fluorescence of the entire target cell as FRET efficiency. For each experimental condition, a nonbleached cell was used as the control.
Cell surface protein isolation.
Cell surface protein was isolated with the Cell Surface Protein Isolation Kit (BioVision, K295-10) according to the manufacturer’s instructions. In brief, the cell surface protein of HKFs was labeled with biotin and isolated with Streptavidin beads. The bound surface protein was then released from beads by incubating with DTT solution. Isolated surface protein lysates were mixed with 4× protein loading buffer (Omics) and boiled for 5 minutes at 60°C, followed by the protocol described in “Immunoblot analysis,” above. Cell surface TGFBR1 level was expressed relative to that of endogenous control membranous protein N-cadherin.
Mouse kidney cell isolation and flow cytometry analysis.
Mouse kidney cells were dissociated and prepared in single-cell suspensions using magnetic-activated cell sorting (MACS, Miltenyi Biotec) according to manufacturer’s instructions. In brief, mouse kidneys were incubated with digestion buffer from Multi Tissue Dissociation Kit 2 (catalog 130-098-463) and dissociated with gentleMACS Dissociator (catalog 130-093-235). To remove cell debris and dead cells, Debris Removal Solution (catalog 130-109-398) and the Dead Cell Removal Kit (catalog 130-090-101) were used for isolated kidney cell suspension. The cell debris and dead cell–free cell suspension were then fixed, permeabilized, and stained with anti-TXNDC5 (1:150, Proteintech, 19834-1-AP) and anti-Vimentin (1:70, Abcam, ab8978) for 1 hour at room temperature. After washing, the cell suspension was incubated with Alexa Fluor 594–labeled anti-rabbit and DyLight 488–labeled anti-mouse secondary antibodies at room temperature for 30 minutes. The cell suspension was then subjected to downstream flow cytometry analysis (LSRFortessa Flow Cytometer, Becton Dickinson). Analysis of the acquired data was performed using FlowJo.
Multiphoton microscopy and second-harmonic generation (SHG) imaging.
The SHG imaging of the kidney tissue sections was performed using a multiphoton microscopic system as previously described (61, 62). In short, the excitation source was set up through a wavelength-tunable Ti:Sapphire laser (Mai-Tai DeepSee Tsunami; Spectra Physics) pumped by a diode-pumped solid-state laser (Millennia X; Spectra Physics). A Galvanometer-driver x-y mirror scanning system (Southport Corporation) was used to scan the 950 nm output of the Ti:Sapphire laser in the focal plane. The laser power was set to be about 61 mW on the tissue section to optimize image quality without laser ablation. High-numerical-aperture water immersion 20×/NA1.0 objective lens (XLUMPHLFLN-W) was used for high-resolution imaging. In addition, the SHG signals were spectrally separated by bandpass filters of 473/10 nm (FF01-473/10-25). The scan resolution was set to 1024 × 1024 pixels. For each of the kidney sections scanned for SHG, 2-photon–excited fluorescence (TPEF) imaging was obtained to show the profile of the scanned tissue.
Statistics.
All experimental data were presented as means ± SEM. The statistical significance of differences among 3 or more groups was determined using 1-way ANOVA, followed by Sidak’s post hoc test. For the statistical significance of differences in 2 groups, 2-sided t test or Mann-Whitney test was conducted. P values < 0.05 are considered statistically significant.
Graphical abstract creation.
The graphical abstract was created with BioRender.com.
Study approval.
All the animal experiments were conducted following the protocols approved by the IACUC of National Taiwan University.
Author contributions
YTC, PYJ, CTH, SJL, WCC, SLL and KCY designed the experiments, conducted the experiments and analyzed the data. YTC, YFW, and SJL acquired SHG images. YTC and KCY wrote the manuscript. All authors reviewed and edited the manuscript.
Supplementary Material
Acknowledgments
We thank the staff of the Biomedical Resource and the Imaging Cores at First Core Labs, National Taiwan University College of Medicine, for technical assistance. We also thank the Transgenic Mouse Model Core facility and the National RNAi Core Facility at Academia Sinica, Taiwan, for technical services. We thank David Brenner at the University of California San Diego for providing Col1a1-GFPTg mice. This work was funded by Taiwan Ministry of Science Technology grants 105-2628-B-002 -042-MY4, 108-2314-B-002-199-MY3, 109-2628-B-002-032 (to KCY), and 108-2314-B-002-078-MY3 (to SLL); a grant from the Taiwan Health Foundation (to SLL); innovative research grant NHRI-EX109-10936SI from Taiwan National Health Research Institute (to KCY); CRC translational research grant IBMS-CRC108-P03 from the Institute of Biomedical Sciences at Academia Sinica, Taiwan (to KCY); grants NTUH.106-P02, 105-CGN01, UN106-026, 106-N3740, VN106-12, 107-T02, UN107-019, 107-N4062, VN107-03, 108-T16, VN108-06, VN109-07, VN110-01, NTUH.108-P04, 108-N4198, 108-S4247, 108-EDN03, 109-S4576 (to KCY) from National Taiwan University Hospital; grant NSCCMOH-131-41 from the Excellent Translation Medicine Research Projects of National Taiwan University College of Medicine and National Taiwan University Hospital (to KCY); and career development grant 109L7872 from National Taiwan University (to KCY). The funding agencies had no role in the study design, data collection/analyses, preparation of the manuscript, or the decision to publish.
Version 1. 01/19/2021
In-Press Preview
Version 2. 03/01/2021
Electronic publication
Footnotes
Conflict of interest: The authors have declared that no conflict of interest exists.
Copyright: © 2021, American Society for Clinical Investigation.
Reference information: J Clin Invest. 2021;131(5):e143645.https://doi.org/10.1172/JCI143645.
See the related Commentary at A clear pathway to tubulointerstitial disease: is an exclusive focus on fibrosis justified?.
Contributor Information
Yen-Ting Chen, Email: tim010393@gmail.com.
Pei-Yu Jhao, Email: r05443009@ntu.edu.tw.
Chen-Ting Hung, Email: oh510230@gmail.com.
Yueh-Feng Wu, Email: d02548013@ntu.edu.tw.
Sung-Jan Lin, Email: drsjlin@ntu.edu.tw.
Wen-Chih Chiang, Email: d88421006@ntu.edu.tw.
Shuei-Liong Lin, Email: linsl@ntu.edu.tw.
Kai-Chien Yang, Email: kcyang@ntu.edu.tw.
References
- 1.Liu Y. Renal fibrosis: new insights into the pathogenesis and therapeutics. Kidney Int. 2006;69(2):213–217. doi: 10.1038/sj.ki.5000054. [DOI] [PubMed] [Google Scholar]
- 2.Cho MH. Renal fibrosis. Korean J Pediatr. 2010;53(7):735–740. doi: 10.3345/kjp.2010.53.7.735. [DOI] [PMC free article] [PubMed] [Google Scholar]
- 3.Meng XM, et al. TGF-β: the master regulator of fibrosis. Nat Rev Nephrol. 2016;12(6):325–338. doi: 10.1038/nrneph.2016.48. [DOI] [PubMed] [Google Scholar]
- 4.Liu BC, et al. Renal tubule injury: a driving force toward chronic kidney disease. Kidney Int. 2018;93(3):568–579. doi: 10.1016/j.kint.2017.09.033. [DOI] [PubMed] [Google Scholar]
- 5.Macconi D, et al. Key fibrogenic mediators: old players. Renin-angiotensin system. Kidney Int Suppl (2011) 2014;4(1):58–64. doi: 10.1038/kisup.2014.11. [DOI] [PMC free article] [PubMed] [Google Scholar]
- 6.Yang L, et al. Epithelial cell cycle arrest in G2/M mediates kidney fibrosis after injury. Nat Med. 2010;16(5):535–543. doi: 10.1038/nm.2144. [DOI] [PMC free article] [PubMed] [Google Scholar]
- 7.Kendall RT, Feghali-Bostwick CA. Fibroblasts in fibrosis: novel roles and mediators. Front Pharmacol. 2014;5:123. doi: 10.3389/fphar.2014.00123. [DOI] [PMC free article] [PubMed] [Google Scholar]
- 8.Strutz F, Zeisberg M. Renal fibroblasts and myofibroblasts in chronic kidney disease. J Am Soc Nephrol. 2006;17(11):2992–2998. doi: 10.1681/ASN.2006050420. [DOI] [PubMed] [Google Scholar]
- 9.Thannickal VJ. Aging, antagonistic pleiotropy and fibrotic disease. Int J Biochem Cell Biol. 2010;42(9):1398–1400. doi: 10.1016/j.biocel.2010.05.010. [DOI] [PMC free article] [PubMed] [Google Scholar]
- 10.LeBleu VS, et al. Origin and function of myofibroblasts in kidney fibrosis. Nat Med. 2013;19(8):1047–1053. doi: 10.1038/nm.3218. [DOI] [PMC free article] [PubMed] [Google Scholar]
- 11.Falke LL, et al. Diverse origins of the myofibroblast—implications for kidney fibrosis. Nat Rev Nephrol. 2015;11(4):233–244. doi: 10.1038/nrneph.2014.246. [DOI] [PubMed] [Google Scholar]
- 12.Brenner BM, et al. Effects of losartan on renal and cardiovascular outcomes in patients with type 2 diabetes and nephropathy. N Engl J Med. 2001;345(12):861–869. doi: 10.1056/NEJMoa011161. [DOI] [PubMed] [Google Scholar]
- 13.Koo JW. Renal interstitial fibrosis and angiotensin inhibition. Electrolyte Blood Press. 2006;4(1):35–43. doi: 10.5049/EBP.2006.4.1.35. [DOI] [PMC free article] [PubMed] [Google Scholar]
- 14.Lin SL, et al. Pentoxifylline attenuates tubulointerstitial fibrosis by blocking Smad3/4-activated transcription and profibrogenic effects of connective tissue growth factor. J Am Soc Nephrol. 2005;16(9):2702–2713. doi: 10.1681/ASN.2005040435. [DOI] [PubMed] [Google Scholar]
- 15.Breyer MD, Susztak K. The next generation of therapeutics for chronic kidney disease. Nat Rev Drug Discov. 2016;15(8):568–588. doi: 10.1038/nrd.2016.67. [DOI] [PMC free article] [PubMed] [Google Scholar]
- 16.Perkins RM, et al. Effect of pentoxifylline on GFR decline in CKD: a pilot, double-blind, randomized, placebo-controlled trial. Am J Kidney Dis. 2009;53(4):606–616. doi: 10.1053/j.ajkd.2008.11.026. [DOI] [PubMed] [Google Scholar]
- 17.Shih YC, et al. Endoplasmic reticulum protein TXNDC5 augments myocardial fibrosis by facilitating extracellular matrix protein folding and redox-sensitive cardiac fibroblast activation. Circ Res. 2018;122(8):1052–1068. doi: 10.1161/CIRCRESAHA.117.312130. [DOI] [PMC free article] [PubMed] [Google Scholar]
- 18.Nakagawa S, et al. Molecular markers of tubulointerstitial fibrosis and tubular cell damage in patients with chronic kidney disease. PLoS One. 2015;10(8):e0136994. doi: 10.1371/journal.pone.0136994. [DOI] [PMC free article] [PubMed] [Google Scholar]
- 19.Sato Y, Yanagita M. Resident fibroblasts in the kidney: a major driver of fibrosis and inflammation. Inflamm Regen. 2017;37:17. doi: 10.1186/s41232-017-0048-3. [DOI] [PMC free article] [PubMed] [Google Scholar]
- 20.Lin SL, et al. Pericytes and perivascular fibroblasts are the primary source of collagen-producing cells in obstructive fibrosis of the kidney. Am J Pathol. 2008;173(6):1617–1627. doi: 10.2353/ajpath.2008.080433. [DOI] [PMC free article] [PubMed] [Google Scholar]
- 21.Lovisa S, et al. Epithelial-to-mesenchymal transition induces cell cycle arrest and parenchymal damage in renal fibrosis. Nat Med. 2015;21(9):998–1009. doi: 10.1038/nm.3902. [DOI] [PMC free article] [PubMed] [Google Scholar]
- 22.Yata Y, et al. DNase I-hypersensitive sites enhance alpha1(I) collagen gene expression in hepatic stellate cells. Hepatology. 2003;37(2):267–276. doi: 10.1053/jhep.2003.50067. [DOI] [PubMed] [Google Scholar]
- 23.Mostaco-Guidolin L, et al. Imaging collagen in scar tissue: developments in second harmonic generation microscopy for biomedical applications. Int J Mol Sci. 2017;18(8):1772. doi: 10.3390/ijms18081772. [DOI] [PMC free article] [PubMed] [Google Scholar]
- 24.Strupler M, et al. Second harmonic microscopy to quantify renal interstitial fibrosis and arterial remodeling. J Biomed Opt. 2008;13(5):054041. doi: 10.1117/1.2981830. [DOI] [PubMed] [Google Scholar]
- 25.Buck TM, et al. The activities and function of molecular chaperones in the endoplasmic reticulum. Semin Cell Dev Biol. 2007;18(6):751–761. doi: 10.1016/j.semcdb.2007.09.001. [DOI] [PMC free article] [PubMed] [Google Scholar]
- 26.Walter P, Johnson AE. Signal sequence recognition and protein targeting to the endoplasmic reticulum membrane. Annu Rev Cell Biol. 1994;10:87–119. doi: 10.1146/annurev.cb.10.110194.000511. [DOI] [PubMed] [Google Scholar]
- 27.Ellgaard L, Helenius A. Quality control in the endoplasmic reticulum. Nat Rev Mol Cell Biol. 2003;4(3):181–191. doi: 10.1038/nrm1052. [DOI] [PubMed] [Google Scholar]
- 28.Philipps B, et al. FRET-based in vivo screening for protein folding and increased protein stability. J Mol Biol. 2003;327(1):239–249. doi: 10.1016/S0022-2836(03)00077-9. [DOI] [PubMed] [Google Scholar]
- 29.Horna-Terron E, et al. TXNDC5, a newly discovered disulfide isomerase with a key role in cell physiology and pathology. Int J Mol Sci. 2014;15(12):23501–23518. doi: 10.3390/ijms151223501. [DOI] [PMC free article] [PubMed] [Google Scholar]
- 30.Kumar S. Cellular and molecular pathways of renal repair after acute kidney injury. Kidney Int. 2018;93(1):27–40. doi: 10.1016/j.kint.2017.07.030. [DOI] [PubMed] [Google Scholar]
- 31.Zhou Y, et al. Secreted fibroblast-derived miR-34a induces tubular cell apoptosis in fibrotic kidney. J Cell Sci. 2014;127(Pt 20):4494–4506. doi: 10.1242/jcs.155523. [DOI] [PubMed] [Google Scholar]
- 32.Rhyu DY, et al. Role of reactive oxygen species in transforming growth factor-beta1-induced extracellular matrix accumulation in renal tubular epithelial cells. Transplant Proc. 2012;44(3):625–628. doi: 10.1016/j.transproceed.2011.12.054. [DOI] [PubMed] [Google Scholar]
- 33.Grynberg K, et al. The JNK signaling pathway in renal fibrosis. Front Physiol. 2017;8:829. doi: 10.3389/fphys.2017.00829. [DOI] [PMC free article] [PubMed] [Google Scholar]
- 34.Meng XM, et al. TGF-beta/Smad signaling in renal fibrosis. Front Physiol. 2015;6:82. doi: 10.3389/fphys.2015.00082. [DOI] [PMC free article] [PubMed] [Google Scholar]
- 35.Derynck R, Zhang YE. Smad-dependent and Smad-independent pathways in TGF-beta family signalling. Nature. 2003;425(6958):577–584. doi: 10.1038/nature02006. [DOI] [PubMed] [Google Scholar]
- 36.Miyajima A, et al. Antibody to transforming growth factor-beta ameliorates tubular apoptosis in unilateral ureteral obstruction. Kidney Int. 2000;58(6):2301–2313. doi: 10.1046/j.1523-1755.2000.00414.x. [DOI] [PubMed] [Google Scholar]
- 37.Sharma K, et al. Neutralization of TGF-beta by anti-TGF-beta antibody attenuates kidney hypertrophy and the enhanced extracellular matrix gene expression in STZ-induced diabetic mice. Diabetes. 1996;45(4):522–530. doi: 10.2337/diab.45.4.522. [DOI] [PubMed] [Google Scholar]
- 38.McGaraughty S, et al. Targeting anti-TGF-β therapy to fibrotic kidneys with a dual specificity antibody approach. J Am Soc Nephrol. 2017;28(12):3616–3626. doi: 10.1681/ASN.2017010013. [DOI] [PMC free article] [PubMed] [Google Scholar]
- 39.Petersen M, et al. Oral administration of GW788388, an inhibitor of TGF-beta type I and II receptor kinases, decreases renal fibrosis. Kidney Int. 2008;73(6):705–715. doi: 10.1038/sj.ki.5002717. [DOI] [PubMed] [Google Scholar]
- 40.Moon JA, et al. IN-1130, a novel transforming growth factor-beta type I receptor kinase (ALK5) inhibitor, suppresses renal fibrosis in obstructive nephropathy. Kidney Int. 2006;70(7):1234–1243. doi: 10.1038/sj.ki.5001775. [DOI] [PubMed] [Google Scholar]
- 41.Rodriguez-Moran M, et al. Effects of pentoxifylline on the urinary protein excretion profile of type 2 diabetic patients with microproteinuria: a double-blind, placebo-controlled randomized trial. Clin Nephrol. 2006;66(1):3–10. doi: 10.5414/cnp66003. [DOI] [PubMed] [Google Scholar]
- 42.Isaka Y. Targeting TGF-β signaling in kidney fibrosis. Int J Mol Sci. 2018;19(9):E2532. doi: 10.3390/ijms19092532. [DOI] [PMC free article] [PubMed] [Google Scholar]
- 43.Santibanez JF, et al. TGF-β/TGF-β receptor system and its role in physiological and pathological conditions. Clin Sci (Lond) 2011;121(6):233–251. doi: 10.1042/CS20110086. [DOI] [PubMed] [Google Scholar]
- 44.Mora AL, et al. Emerging therapies for idiopathic pulmonary fibrosis, a progressive age-related disease. Nat Rev Drug Discov. 2017;16(11):810. doi: 10.1038/nrd.2017.225. [DOI] [PMC free article] [PubMed] [Google Scholar]
- 45.Herbertz S, et al. Clinical development of galunisertib (LY2157299 monohydrate), a small molecule inhibitor of transforming growth factor-beta signaling pathway. Drug Des Devel Ther. 2015;9:4479–4499. doi: 10.2147/DDDT.S86621. [DOI] [PMC free article] [PubMed] [Google Scholar]
- 46.Anderton MJ, et al. Induction of heart valve lesions by small-molecule ALK5 inhibitors. Toxicol Pathol. 2011;39(6):916–924. doi: 10.1177/0192623311416259. [DOI] [PubMed] [Google Scholar]
- 47.Scarfe L, et al. Long-term outcomes in mouse models of ischemia-reperfusion-induced acute kidney injury. Am J Physiol Renal Physiol. 2019;317(4):F1068–F1080. doi: 10.1152/ajprenal.00305.2019. [DOI] [PMC free article] [PubMed] [Google Scholar]
- 48.Cao W, et al. Contrast-enhanced ultrasound for assessing renal perfusion impairment and predicting acute kidney injury to chronic kidney disease progression. Antioxid Redox Signal. 2017;27(17):1397–1411. doi: 10.1089/ars.2017.7006. [DOI] [PubMed] [Google Scholar]
- 49.Yang HC, et al. Models of chronic kidney disease. Drug Discov Today Dis Models. 2010;7(1–2):13–19. doi: 10.1016/j.ddmod.2010.08.002. [DOI] [PMC free article] [PubMed] [Google Scholar]
- 50.Pan SY, et al. Microvascular pericytes in healthy and diseased kidneys. Int J Nephrol Renovasc Dis. 2014;7:39–48. doi: 10.2147/IJNRD.S37892. [DOI] [PMC free article] [PubMed] [Google Scholar]
- 51.Carew RM, et al. The role of EMT in renal fibrosis. Cell Tissue Res. 2012;347(1):103–116. doi: 10.1007/s00441-011-1227-1. [DOI] [PubMed] [Google Scholar]
- 52.Allison SJ. Fibrosis: Targeting EMT to reverse renal fibrosis. Nat Rev Nephrol. 2015;11(10):565. doi: 10.1038/nrneph.2015.133. [DOI] [PubMed] [Google Scholar]
- 53.Piera-Velazquez S, et al. Role of endothelial-mesenchymal transition (EndoMT) in the pathogenesis of fibrotic disorders. Am J Pathol. 2011;179(3):1074–1080. doi: 10.1016/j.ajpath.2011.06.001. [DOI] [PMC free article] [PubMed] [Google Scholar]
- 54.Meng XM, et al. Diverse roles of TGF-β receptor II in renal fibrosis and inflammation in vivo and in vitro. J Pathol. 2012;227(2):175–188. doi: 10.1002/path.3976. [DOI] [PubMed] [Google Scholar]
- 55.Gewin L, et al. TGF-beta receptor deletion in the renal collecting system exacerbates fibrosis. J Am Soc Nephrol. 2010;21(8):1334–1343. doi: 10.1681/ASN.2010020147. [DOI] [PMC free article] [PubMed] [Google Scholar]
- 56.Neelisetty S, et al. Renal fibrosis is not reduced by blocking transforming growth factor-β signaling in matrix-producing interstitial cells. Kidney Int. 2015;88(3):503–514. doi: 10.1038/ki.2015.51. [DOI] [PMC free article] [PubMed] [Google Scholar]
- 57.Venkatachalam MA, Weinberg JM. Fibrosis without fibroblast TGF-β receptors? Kidney Int. 2015;88(3):434–437. doi: 10.1038/ki.2015.170. [DOI] [PMC free article] [PubMed] [Google Scholar]
- 58.Ackerman ME, et al. A robust, high-throughput assay to determine the phagocytic activity of clinical antibody samples. J Immunol Methods. 2011;366(1–2):8–19. doi: 10.1016/j.jim.2010.12.016. [DOI] [PMC free article] [PubMed] [Google Scholar]
- 59.Zheng YB, et al. Live-cell visualization of intracellular interaction between a nuclear migration protein (hNUDC) and the thrombopoietin receptor (Mpl) PLoS One. 2012;7(12):e51849. doi: 10.1371/journal.pone.0051849. [DOI] [PMC free article] [PubMed] [Google Scholar]
- 60.Karpova TS, et al. Fluorescence resonance energy transfer from cyan to yellow fluorescent protein detected by acceptor photobleaching using confocal microscopy and a single laser. J Microsc. 2003;209(Pt 1):56–70. doi: 10.1046/j.1365-2818.2003.01100.x. [DOI] [PubMed] [Google Scholar]
- 61.Wu YF, et al. Intravital multiphoton microscopic imaging platform for ocular surface imaging. Exp Eye Res. 2019;182:194–201. doi: 10.1016/j.exer.2019.02.016. [DOI] [PubMed] [Google Scholar]
- 62.Wu YF, et al. Long-term intravital imaging of the cornea, skin, and hair follicle by multiphoton microscope. Methods Mol Biol. 2020;2150:131–140. doi: 10.1007/7651_2019_227. [DOI] [PubMed] [Google Scholar]
Associated Data
This section collects any data citations, data availability statements, or supplementary materials included in this article.


