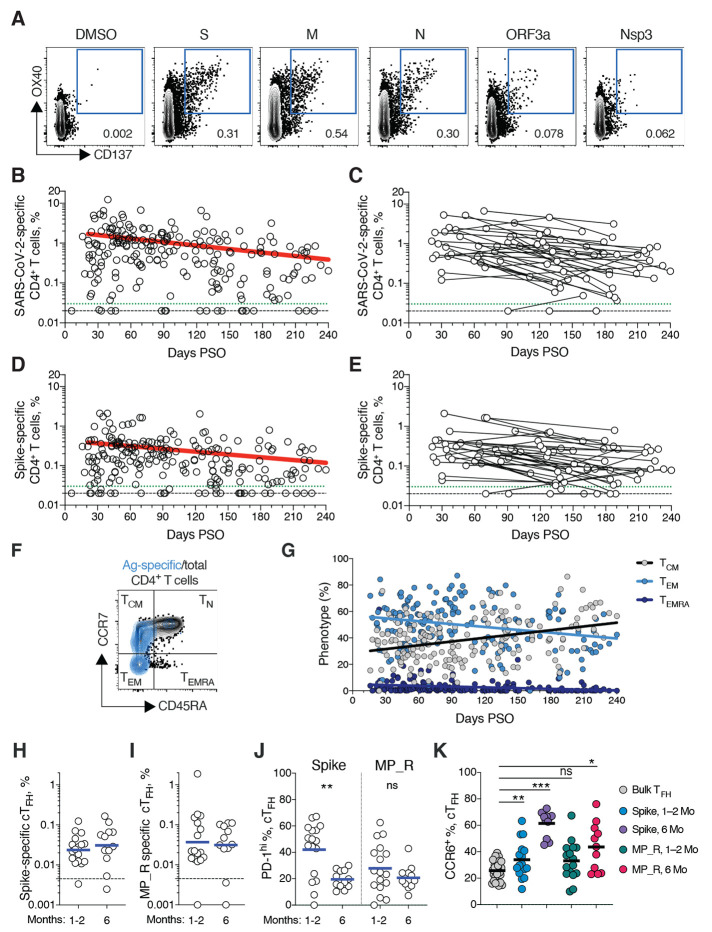
Fig. 4. SARS-CoV-2 circulating memory CD4+ T cells.
(A) Representative flow cytometry plots of SARS-CoV-2-specific CD4+ T cells (CD137+ OX40+, See fig. S4 for gating) after overnight stimulation with S, N, M, ORF3a, or nsp3 peptide pools, compared to negative control (DMSO). (B) Cross-sectional analysis of frequency (% of CD4+ T cells) of total SARS-CoV-2-specific CD4+ T cells. Continuous decay preferred fit model, t1/2 = 94 days. R = -0.29, p<0.0001. (C) Longitudinal analysis of total SARS-CoV-2-specific CD4+ T cells in paired samples from the same subjects. (D) Cross-sectional analysis of Spike-specific CD4+ T cells. Linear decay preferred model, t1/2 = 139 days. R = -0.26, p<0.0001. (E) Longitudinal analysis of Spike-specific CD4+ T cells in paired samples from the same subjects. (F, G) Distribution of central memory (TCM), effector memory (TEM), and terminally differentiated effector memory cells (TEMRA) among total SARS-CoV-2-specific CD4+ T cells. (H, I) Quantitation of SARS-CoV-2-specific circulating T follicular helper (cTFH) cells (surface CD40L+ OX40+, as % of CD4+ T cells. See fig. S5 for gating) after overnight stimulation with (H) Spike (S) or (I) MP_R peptide pools. (J) PD-1hi SARS-CoV-2-specific TFH at 1-2 months (mo) and 6 mo PSO. (K) CCR6+ SARS-CoV-2-specific cTFH in comparison to bulk cTFH cells in blood. For (A-E), n = 169 COVID-19 subjects (n = 215 data points, white circles) for cross-sectional analysis, n = 37 COVID-19 subjects (n = 83 data points, white circles) for longitudinal analysis. The dotted black line indicates limit of detection (LOD). The dotted green line indicates limit of sensitivity (LOS). For (H-J), n = 29 COVID-19 subject samples (white circles), n = 17 COVID-19 subjects at 1-2 mo, n = 12 COVID-19 subjects at 6 mo. The dotted black line indicates limit of detection (LOD). Statistics by (J) Mann-Whitney U test and (K) Wilcoxon signed-rank test. * p<0.05, **p<0.01, *** p<0.001.

