Abstract
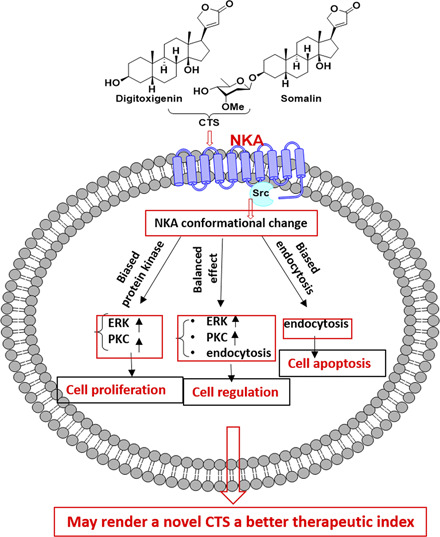
Recent studies have revealed that Na/K-ATPase (NKA) can transmit signals through ion-pumping–independent activation of pathways relayed by distinct intracellular protein/lipid kinases, and endocytosis challenges the traditional definition that cardiotonic steroids (CTS) are NKA inhibitors. Although additional effects of CTS have long been suspected, revealing its agonist impact through the NKA receptor could be a novel mechanism in understanding the basic biology of NKA. In this study, we tested whether different structural CTS could trigger different sets of NKA/effector interactions, resulting in biased signaling responses without compromising ion-pumping capacity. Using purified NKA, we found that ouabain, digitoxigenin, and somalin cause comparable levels of NKA inhibition. However, although endogenous ouabain stimulates both protein kinases and NKA endocytosis, digitoxigenin and somalin bias to protein kinases and endocytosis, respectively, in LLC-PK1 cells. The positive inotropic effects of CTS are traditionally regarded as NKA inhibitors. However, CTS-induced signaling occurs at concentrations at least one order of magnitude lower than that of inotropy, which eliminates their well known toxic actions on the heart. The current study adds a novel mechanism that CTS could exert its biased signaling properties through the NKA signal transducer.
SIGNIFICANCE STATEMENT
Although it is now well accepted that NKA has an ion-pumping–independent signaling function, it is still debated whether direct and conformation-dependent NKA/effector interaction is a key to this function. Therefore, this investigation is significant in advancing our understanding of the basic biology of NKA-mediated signal transduction and gaining molecular insight into the structural elements that are important for cardiotonic steroid’s biased action.
Introduction
Cardiotonic steroids (CTS), including digitalis drugs such as digoxin and ouabain, are specific inhibitors of Na/K-ATPase (NKA) (Schatzmann, 1953; Skou, 1988; Lingrel and Kuntzweiler, 1994). The positive inotropic effect of CTS on myocardial contractility is due to the inhibition of NKA and subsequent increases in intracellular Ca2+ (Eisner and Smith, 1992). Like other inotropes, the U.S. Food and Drug Administration-approved digoxin produces impressive hemodynamic effects in patients with chronic heart failure. However, it distinguishes itself from other pure inotrope drugs because it does not increase mortality for patients with chronic heart failure, most likely due in part to the recently appreciated signaling through cardiac NKA (Pierre et al., 2007; Li and Xie, 2009).
Over the last decade, studies have revealed that NKA has an ion-pumping–independent signaling function (Xie et al., 2013). Precisely, binding of CTS to NKA activates protein and lipid kinases and induces the endocytosis of NKA by changing the function of NKA-interacting proteins (Kometiani et al., 1998; Haas et al., 2000; Liu et al., 2000; Xie, 2001). For example, we have demonstrated that the binding of ouabain to the NKA/Src receptor complex results in the transactivation of the epidermal growth factor receptor (EGFR), resulting in activation of the Ras/Raf/MEK/ERK cascade (Haas et al., 2002). Src activation also leads to stimulation of phospholipase C γ and subsequent activation of protein kinase C (PKC) isozymes and inositol trisphosphate–mediated Ca2+ signaling (Mohammadi et al., 2001; Yuan et al., 2005; Liu et al., 2007). Moreover, ouabain was found to stimulate phosphoinositide 3-kinase, resulting in the endocytosis of NKA (Liu et al., 2004). CTS activation of NKA-mediated signaling represents a novel mechanism for the modulation of cell growth and apoptosis. It is involved in normal cardiac physiology (Xie et al., 1999) and disease progression such as ventricular hypertrophy and fibrosis (Elkareh et al., 2007; Drummond et al., 2016, 2018). Importantly, CTS activates these signaling events at concentrations at least an order of magnitude lower than that of inotropy induction.
Several endogenous CTS, including ouabain and marinobufagenin, have been identified, and they play an essential role in the regulation of cardiac structure and function at concentrations that stimulate NKA signaling without affecting cellular pumping capacity (Hamlyn et al., 1982; Hamlyn et al., 1998; Scheiner-Bobis and Schoner, 2001). At the molecular level, we suggested that receptor NKA regulates protein/protein interaction in a conformation-dependent manner (Ye et al., 2013). Structurally, CTS shares a steroid core, a varying number of substituents including a sugar moiety, and a 5- or 6-membered lactone ring, each of which has specific influences on the binding properties to NKA (Cornelius et al., 2013). Although all CTS bind to the phosphorylated form of the Na/K-ATPase in E2 (E2P) state, they induce different NKA structural changes (Yatime et al., 2011; Laursen et al., 2015). As a consequence, the allosteric control by individual CTS may stabilize NKA in a unique conformation, leading to biased activation of a specific signaling pathway. The growing appreciation that G protein–coupled receptors (GPCRs) can mediate physiologically relevant effects via both G protein and non–G protein effectors has prompted the search for ligands that can “bias” downstream signaling in favor of one pathway over another. Interestingly, animal and clinical studies indicate that the biased β-blocker carvedilol may be a better drug than balanced β-blockers, which also emphasizes the therapeutic value of biased ligands. In support of this CTS bias concept, in this study, we tried to identify diverse structures of CTS that exhibit comparable levels of inhibition of NKA and then test whether these compounds exhibit biased signaling properties in vitro and, if so, whether biased signaling capacity alters their in vivo pharmacology in mice.
Materials and Methods
Materials.
Thedigitoxigenin, somalin, periplogenin, and periplogenin 3-O-β-d-cymaroside were isolated from the Chinese medicinal herb Streptocaulon juventas (Lour) Merr. The compounds' structures were determined by nuclear magnetic resonance (NMR) spectroscopy, and the spectroscopic data were given in Supplemental Materials in section 1. The CTS digoxin, digoxigenin, ouabain, and ouabagenin were obtained from Millipore Sigma (Burlington. MA). Structural formulas of compounds were shown in Table 1. The pig renal proximal tubule cell line LLC-PK1 was originally from the American Tissue Type Culture Collection (Manassas, VA). Cell culture media, fetal bovine serum, and trypsin were purchased from Invitrogen (Grand Island, NY); the enhanced chemiluminescence supersignal kit was purchased from Pierce; phospho-p44/42 MAPK (ERK1/2, 9101) (Thy 202/204) and p44/42 MAPK (ERK1/2, 4695) (137F5) rabbit antibody were from Cell Signaling Technology. Anti-PKCε rabbit polyclonal (c-15, sc-214-G), goat anti-rabbit (lot TK274616), and goat anti-mouse secondary antibodies (lot TI272496) were from Invitrogen (Thermo Fisher Scientific).
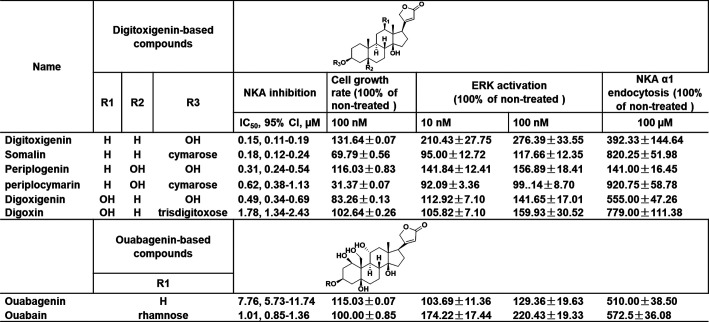
TABLE 1.
Chemical structures of CTS and effects of CTS on Na/K-ATPase inhibition, cell growth rate, ERK activation, and Na/K-ATPase α1 endocytosis
Na/K-ATPase Purification and Na/K-ATPase Activity Assay.
The purified Na/K-ATPase was isolated from the outer medulla of pig kidney. The concentration of purified pig kidney enzyme (PKE) was determined using bovine serum albumin as the protein standard. The ATPase activity of the PKE was determined according to the assay described below. The specific activities of the Na/K-ATPase of various kidney preparations were in the range of 900–1100 μmol Pi/mg per hour, which was more than 95% of the total ATPase activity. The purity of the PKE was verified by SDS-PAGE, which showed only two bands, one at 110 kDa and the other at 55 kDa, indicative of the α- and β-subunits, respectively, after staining with Coomassie Blue.
ATPase inhibitory assay was conducted in glass tubes with the final reaction volume of 1900 μl containing the following components: 100 mM NaCl, 20 mM KCl, 1 mM MgCl2, 1 mM EGTA, 20 mM Tris-HCl, pH 7.4, and 0.5 μg of purified Na/K-ATPase. After the compounds were added, the mixtures were incubated at 37°C for 15 minutes, and the reaction was initiated by adding 2 mM ATP-Mg2+ mixture. Reactions were carried out for 15 minutes and then stopped by the addition of 900 μl of ice-cold 8% trichloroacetic acid. Reaction mixtures were cleared by centrifugation and assayed for released phosphate by using the BIOMOL Green reagent according to the manufacturer’s instructions. In addition, control Na/K-ATPase activity was measured in the presence and absence of 1 mM ouabain and taken as 0% and 100%, respectively. Furthermore, 1 mM ouabain and 0.1% DMSO were included in each plate as a positive and vehicle control, respectively. Control experiments showed that ATP hydrolysis catalyzed by the Na/K-ATPase was in a linear range within 30 minutes of incubation under the above experimental conditions.
Cell Culture and ERK Activation Assay.
LLCPK1 cells were cultured in Dulbecco’s modified Eagle’s medium supplemented with 10% fetal bovine serum, 100 U/ml penicillin, 100 μg/ml streptomycin, and 1 μg/ml puromycin. The cultured cells were routinely tested for possible mycoplasma contamination. When cells reached 90%–95% confluence, they were serum-starved overnight and used for experiments. In studies using ouabain and other CTS compounds, duration of exposure for the concentration-dependent curve was 10 minutes for ERK activation in all experiments.
PKCε Translocation Assay.
LLCPK1 cells were cultured in complete Dulbecco’s modified Eagle’s medium (containing 10% fetal bovine serum, 100 U/ml penicillin, 100 μg/ml streptomycin, and 1 μg/ml puromycin). When cells reached 90%–95% confluence, they were serum-starved overnight. Cell lysates were homogenized in buffer A containing (in millimoles per liter) EGTA(10), EDTA(1), Dithiothreitol(0.5), PhenylMethylSulfonyl Fluoride(1), proteinase inhibitor cocktail, and Tris-HCl(20), pH 7.5. Homogenates were centrifuged at 100,000g for 1 hour at 4°C. The supernatant designated as the cytosolic fraction was removed and saved. The pellet was sonicated and centrifuged at 25,000g in buffer A containing 1% Triton. The supernatant was collected as the particulate fraction, as we previously described (Duan et al., 2018). Cytosolic and particulate fractions were separated by sodium dodecyl sulfate (SDS)-polyacrylamide gel electrophoresis (SDS-PAGE) and transferred to a nitrocellulose membrane. Anti-PKCε antibody C-15 (Santa Cruz, CA) primary antibodies diluted 1:1000.
Western Blot Analysis.
The cells were washed with phosphate-buffered saline and solubilized in ice-cold radioimmune precipitation assay buffer containing 1% Nonidet P-40, 1% sodium deoxycholate, 150 mM NaCl, 1 mM EDTA, 1 mM phenylmethylsulfonyl fluoride, 1 mM sodium orthovanadate, 1 mM NaF, 10 μg/ml aprotinin, 10 μg/ml leupeptin, and 50 mM Tris-HCl, pH 7.4. The cell lysates were then centrifuged at 14,000 rpm, and the supernatants were used for protein assay and subjected to Western blot analysis. The samples were separated on SDS-PAGE (30 μg/lane) and transferred to a cellulose membrane. The membranes were blocked with a mixture of 1% nonfat dried milk and 1% bovine serum albumin in a mixture of Tris-Buffered Saline (TBS) and Tween 20 buffer. (10 mM Tris-HCl, 150 mM NaCl, 0.05% Tween 20, pH 8.0) for 1 hour at room temperature and probed with specific antibodies. The protein signals were detected using an enhanced chemiluminescence kit, and relative quantitation of protein levels was normalized to total protein loading of signal intensities using ImageJ (National Institutes of Health).
Cell Viability Assay.
To assess the response of LLC-PK1 cells to CTS treatment and stimuli, we used a cell viability assay to measure the number of live cells in a population. We used the trypan blue exclusion method to distinguish viable cells from nonviable cells. The cells were subcultured in 12-well plates at 50,000 cells per well, serum-starved overnight, and then treated with different concentrations of compounds for indicated time periods. Three wells of control or treated cells were trypsinized and counted manually using a hemocytometer. For distinguishing between dead and viable cells, the samples were diluted with trypan blue so that, while viewed under a microscope, dead cells would appear dark blue.
The Quantitation of Endocytosed NKA α1.
To analyze NKA endocytosis, we used a YFP-α1-TCN cell line generated from TCN23-19 cells by first knocking down endogenous NKA and then rescuing NKA expression with YFP-tagged rat α1, which was developed in our laboratory and reported previously (Cai et al., 2008; Chen et al., 2011; Xu et al., 2021). To test the effect of different structural CTS on the endocytosis of NKA α1, YFP-α1-TCN cells on glass coverslips were treated with indicated concentrations of CTS for 6 hours and were fixed with 100% prechilled methanol for 30 minutes at room temperature and washed twice with PBS solution. The coverslips were then mounted. The number of endocytosed NKA α1 was determined in random sections from images captured by fluorescent microscopy acquired at the same magnification. More than 40 cells were examined for each section. For semiquantitative analysis of the accumulation of NKA in the intracellular compartment, fluorescence intensity of total cell area (Ft) and the intracellular region (Fi) were measured by ImageJ, and the percentage of endocytosed NKA α1 was calculated by (Ft − Fi)/Ft. All the data points in the control groups were rescaled to 100%. Values are means ± S.D. from 40 cells in at least three independent experiments.
Labeling of Cell Surface Na/K-ATPase by Biotinylation.
Cell surface protein biotinylation was performed as described before (Liu et al., 2005). Briefly, control and treated LLC-PK1 cells were washed twice with ice-cold PBS-Ca-Mg (PBS containing 100 mmol/l CaCl2 and 1 mmol/l MgCl2). Cells were then biotinylated with N -Hydroxysulfosuccinimide-ss-Biotin (EZ-Link Sulfo-NHS-SS-Biotin, Thermo Scientific) at a working concentration of 1.5 mg/ml. Cells were then washed with PBS-Ca-Mg-100 mM glycine for 25 minutes at 4°C. We then collected cell lysate with lysis buffer and added streptavidin beads to each supernatant. They were incubated overnight (12–16 hours) at 4°C with end-over-end rotation. Proteins bound to the ImmunoPure immobilized streptavidin-agarose beads were eluted and then resolved on SDS-PAGE followed by immunoblotting.
The Quantification of CTS Bias in NKA α1 Signaling.
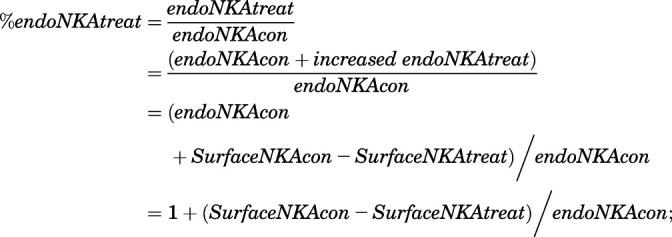
Based on the given assay in NKA signaling (ERK activation vs. NKA endocytosis), we used two general approaches to identify CTS-induced signaling bias, which aids validation in GPCRs (Rajagopal et al., 2011). For using the originally proposed qualitative approach, referred to as “equimolar comparison” (Gregory et al., 2010; Rajagopal et al., 2011), we first collected the concentration curve from ERK activation pathway and NKA α1 endocytosis pathway (Fig. 2D and Fig. 3). The responses of these two different assays at the same concentration of ouabain, somalin, or digitoxigenin are then plotted against each other. This curve’s shape is a direct comparison of the signaling through the ERK activation and NKA endocytosis. To transform the cell surface NKA α1 to endocytosed NKA α1, three steps were taken: 1) we first performed and quantitated the ratio of endocytosed NKA over surface NKA for nontreated LLC-PK1 cells by running biotinylation assay with ouabain as a positive control. The ratio of endocytosed NKA α1 (endoNKA) over cell surface NKA α1 (SurfaceNKA) was obtained as 1.306129 in nontreated (con) cells (endoNKAcon/SurfaceNKAcon = 1.306129, see Supplemental Section 2), which is also referenced with our previously reported work (Liu et al., 2004, 2005); 2) we then quantitated the ratio of cell surface NKA α1 (SurfaceNKA) in the CTS-treated group over the nontreated group (SurfaceNKAtreat/SurfaceNKAcon) from Fig. 2, C and D. As the total NKA is constantly unchanged, the increased endoNKA in the CTS-treated group is established as eq. 1; 3) the percentage of endoNKA in CTS-treated groups (Fig. 6A x-axis) was then calculated as eq. 2. From step 1, the endoNKAcon = 1.306129*SurfaceNKAcon, and the percentage of endoNKA in CTS-treated groups (Fig. 6A x-axis) was then finally calculated as eq. 3:
| (1) |
 |
(2) |
 |
(3) |
Therefore, “endocytosed NKA α1” used in the calculation of “NKA endocytosis” in Fig. 6A was calculated from the cell surface NKA α1 in Fig. 2, C and D using eq. 3. The second approach is the quantification of bias factors (eq. 4) by using the equiactive model used by Robert J. Lefkowitz and coworkers (Rajagopal et al., 2011). In this approach, the doses of ligand (lig) required for an equiactive response for pathway 1 (ERK activation, P1) and 2 (NKA α1 endocytosis, P2) are extrapolated from fits of each concentration-response curve (Fig. 2D and Fig. 3). A bias factor, denoted β, is calculated as the logarithm of the ratio of relative intrinsic activities for a ligand at two different assays compared with a reference agonist. In our case, this comparison was performed using eq. 1, which can be calculated from the maximal response (Emax) obtained from experiment and the concentration of CTS that provokes a half response (EC50) calculated on Prism (GraphPad). The bias factor quantifies the relative stabilization of ERK activation over NKA α1 endocytosis compared with endogenous ouabain, which is the reference ligand (ref).
 |
(4) |
Fig. 2.
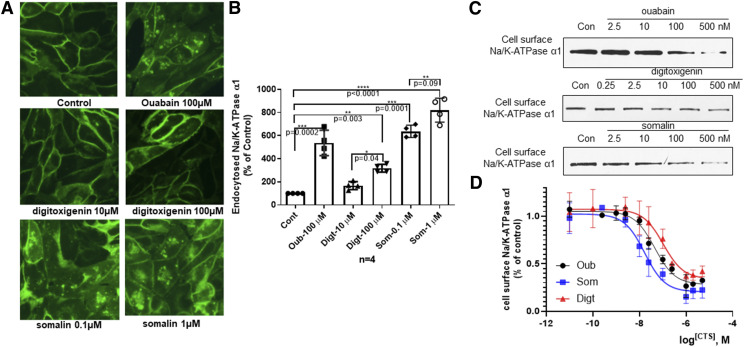
CTS effects on Na/K-ATPase α1 endocytosis. (A) TCN-YFP-α1 cells were treated with ouabain (Oub), somalin (Som), digitoxigenin (Digt), and driving solution (Cont) for 6 hours and imaged under a fluorescence microscope. (B) Semiquantitative endocytosed NKA α1 was calculated by counting the accumulation of NKA in the intracellular compartments. Data were quantified from four independent experiments and standardized to vehicle control. Individual values are presented as means ± S.D. Data were analyzed with one-way ANOVA followed by Sidak’s multiple comparisons test to determine statistical significance. **P < 0.01; ***P < 0.001; ****P < 0.0001. (C) Cell surface NKA α1 was measured by the biotinylation assay described in the Materials and Methods. Protein was collected after treatment with different concentrations of CTS. Cell lysates were separated by SDS-PAGE and analyzed by Western blot for NKA α1. (D) Quantitative dose-response endocytosed NKA α1 was calculated from three to five independent experiments for each concentration. The individual data points are means ± S.D.
Fig. 3.
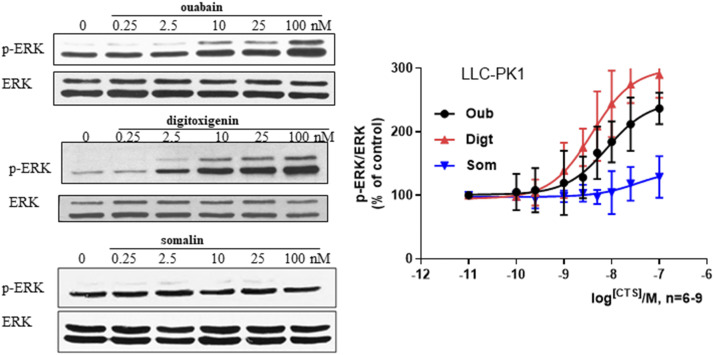
CTS effects on ERK activation in LLC-PK1 cells. Cells were treated with indicated concentration of CTS and probed for active ERK (p-ERK) by Western blot. Upper panel: representative Western blot. Lower panel: dose curve for respective CTS treatment presented as means ± S.D.; n = 6 for ouabain (Oub) group, and n = 9 for somalin (Som) and digitoxigenin (Digt). The EC50 values for Oub and Digt are 6.52 nM, 95% Confidence Interval (CI) 3.98–13.80 nM, and 3.85 nM, 95% CI 1.96–7.408 nM, respectively.
Fig. 6.
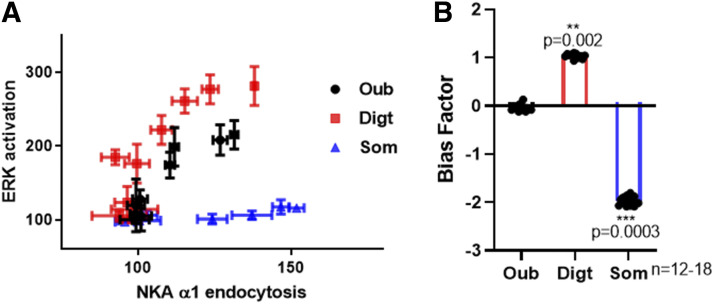
Identification of CTS-induced bias in NKA α1 signaling. (A) An equimolar comparison between the ERK activation and the endocytosis of NKA α1 demonstrate that sommalin (Som) is dramatically biased to NKA endocytosis, and digitoxigenin (Digt) is slightly biased to ERK activation compared with reference-balanced ouabain (Oub). (B) Bias factors were calculated by using the equiactive model as described in the Materials and Methods. Equiactive comparison between ERK activation and NKA α1 endocytosis demonstrate biased effect of Digt and Som. Data are presented as means ± S.D. **P < 0.01 by t test.
Statistical Analyses.
For NKA inhibition, calculation of IC50 was determined by log(concentration) versus response curves using the nonlinear iterative three-parameter concentration-response curve. Curve fitting was performed with GraphPad Prism 7 (GraphPad Software Inc., San Diego, CA). The quantitative data were subjected to statistical analyses using GraphPad and are presented as means ± S.D. for all studies repeated at least three times. The differences between groups were determined by ANOVA (multiple groups) followed by multiple comparisons test. Student’s t tests were performed to compare two groups. A value of P < 0.05 was considered to indicate significant differences between groups. The nature of the experiments is exploratory, and as such, they are not testing a prespecified null hypothesis. P values are, therefore, meant to be descriptive in their interpretation. The number of experimental repetitions was either predetermined based on the level of variation observed in previous work or combined with accumulated data that was generated as positive control, and each experiment was reproduced for the number of times indicated.
Results
Cardiotonic Steroids with Similar Inhibitory Effects on Purified NKA Exhibit Different Patterns of Activation of NKA Signaling.
To test the possible biased activity of CTS, we first measured ouabain-sensitive ATPase activities of four pairs of CTS aglycones and glycosides, followed by cell viability assays. As shown in Table 1, CTS exhibited a large difference in their ability to inhibit Na/K-ATPase, as previously reported (Paula et al., 2005). For example, whereas the IC50 values between somalin and ouabagenin are different by about 50-fold, the IC50 values for digitoxigenin and somalin are similar: 0.15 ± 0.04 and 0.18 ± 0.04 μM, respectively, which is about 5-fold more potent than ouabain. Second, we measured the effect of diverse CTS on renal epithelial (LLC-PK1) cell viability at 100 nM. As shown in Table 1, two glycosides, periplogenin 3-O-β-d-cymaroside and somalin, which share the same cymarose sugar moiety, exhibited more cell toxicity. Unlike somalin, which was cytotoxic, digitoxigenin promotes cell growth at 100 nM, whereas ouabain, an endogenous NKA ligand, did not affect cell activity. This data indicated a disconnect between the IC50 of CTS in NKA inhibition and their biologic effects on cells, suggesting the possible biased biologic action of CTS.
To gain further evidence of biased action of CTS, we compared the effects of diverse CTS on ERK activation at 10 and 100 nM. Surprisingly, unlike the other CTS, which activates ERK in a concentration-response manner, periplogenin 3-O-β-d-cymaroside and somalin at these concentrations failed to activate ERK. To corroborate, we used a YFP-α1-TCN cell line, which was generated by first knocking down endogenous NKA and then rescuing the NKA knockdown TCN cells with YFP-tagged rat α1 as a semiquantitative screening assay for identifying CTS that stimulate the endocytosis of NKA in live cells. As shown in Table 1, all glycosides, including somalin, periplogenin 3-O-β-d-cymaroside, and digoxin, induced more NKA α1 endocytosis compared with aglycones at 100 µM.
We found that digitoxigenin and somalin caused comparable levels of NKA inhibition. However, at a concentration of 100 nM, digitoxigenin stimulated cell proliferation, and somalin inhibited cell growth by 30%. These data have shown that ouabain stimulates both protein kinases and NKA endocytosis, whereas digitoxigenin and somalin bias to ERK activation and endocytosis, respectively.
CTS Regulate Different Patterns of Cell Viability through Na/K-ATPase Signaling.
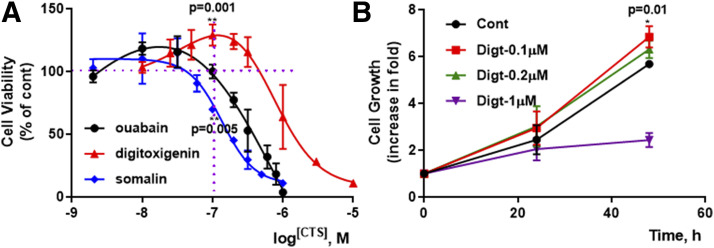
To understand the molecular mechanism of these opposing effects of somalin and digitoxigenin, we first compared the concentration-response on cell growth in LLC-PK1 cells. Cell numbers were counted in the presence or absence of the indicated concentrations of somalin and digitoxigenin, with ouabain as a positive control. As depicted in Fig. 1, 30 nM ouabain showed a stimulatory effect on cell growth, consistent with what we have reported before (Tian et al., 2009). Like ouabain, 25–100 nM digitoxigenin showed a stimulatory effect on cell growth, and 200–3000 nM caused cell proliferation inhibition in a concentration-dependent manner. In contrast, somalin only induced an inhibitory effect in a concentration-dependent way. As a result, digitoxigenin and ouabain have bell-shaped concentration-response curves with increased cell viability at low concentrations and decreased cell viability at high concentrations. Compared with ouabain, digitoxigenin has a wider stimulation window, although with the same pattern as ouabain. Structurally, somalin is a glycoside and shares the same aglycone moiety with digitoxigenin. Although similar in structure, with comparable NKA inhibition (IC50 = 0.18 ± 0.04, 0.15 ± 0.04, respectively, in Table 1), they regulate different patterns of cell viability.
Fig. 1.
CTS effects on cell viability. (A) LLC-PK1 cells were subcultured in 12-well plates (50,000 cells/well) and serum-starved, with three wells of control (Cont), and CTS-treated cells were trypsinized and counted after CTS treatment for 48 hours. The quantification data are from three to four independent experiments. The individual data points are means ± S.D. **P < 0.01 compared with 100 nM of ouabain, unpaired t test. (B) After digitoxigenin (Digt) treatment, three wells of Cont- and Digt-treated cells were trypsinized and counted at indicated time points. The same experiments were repeated three times. The individual data points are means ± S.D. *P < 0.05 compared with vehicle Cont, unpaired t test.
CTS Activate Biased Na/K-ATPase Signal Transduction.
Ouabain-stimulated signal transduction through NKA has been characterized in LLC-PK1 cells, a cell model used extensively to characterize NKA-mediated signal transduction (Liu et al., 2002, 2004, 2005; Tian et al., 2009). To determine whether CTS exhibit biased signaling, we compared digitoxigenin and somalin’s impacts on these pathways using endogenous ouabain as a reference in LLC-PK1 cells. To analyze NKA endocytosis, we used two complementary assays. First, we generated a YFP-α1-TCN cell line from TCN cells by first knocking down endogenous NKA and then rescuing NKA expression with YFP-tagged rat α1. Using fluorescent microscopy, we observed that treatment with 100 µM ouabain reduced the surface expression of NKA and consequently increased the accumulation of NKA in the intracellular compartments (Fig. 2A). Digitoxigenin induced less endocytosis of NKA, although somalin greatly increased endocytosis, as exhibited by a large accumulation of NKA in the intracellular compartments even at 0.1 µM. A semiquantitative analysis (Fig. 2B) of NKA in the intracellular compartment revealed that treatment with 100 µM digitoxigenin induced 50% more than the same concentration of ouabain. In contrast, treatment with 0.1 µM of somalin stimulated a similar level of NKA endocytosis as 100 µM of ouabain in live cells. To complement the approach, we have developed a quantitative surface biotinylation assay, allowing us to conduct concentration-response studies, as described in the Materials and Methods. As shown in Fig. 2, C and D, although all CTS induced Na/K-ATPase α1 endocytosis in a concentration-dependent manner, they exhibited different potencies. Ouabain induced a balanced effect compared with somalin and digitoxigenin. Somalin was far more potent than digitoxigenin in the case of NKA endocytosis. Endocytosed Na/K-ATPase α1 was calculated quantitatively from three to five independent experiments for each concentration in Fig. 2D.
In addition to stimulating endocytosis of NKA, ouabain has been shown to activate ERK with Src-dependent transactivation of EGFR and subsequent activation of the Ras/Raf/MEK/ERK cascade (Haas et al., 2000). To evaluate the activation of these pathways by different CTS, we focused on the activation of ERK in LLC-PK1 cells treated with ouabain, somalin, and digitoxigenin. As shown in Fig. 3, unlike ouabain and digitoxigenin, somalin did not activate ERK. In contrast, digitoxigenin displayed a more potent effect on ERK activation than ouabain.
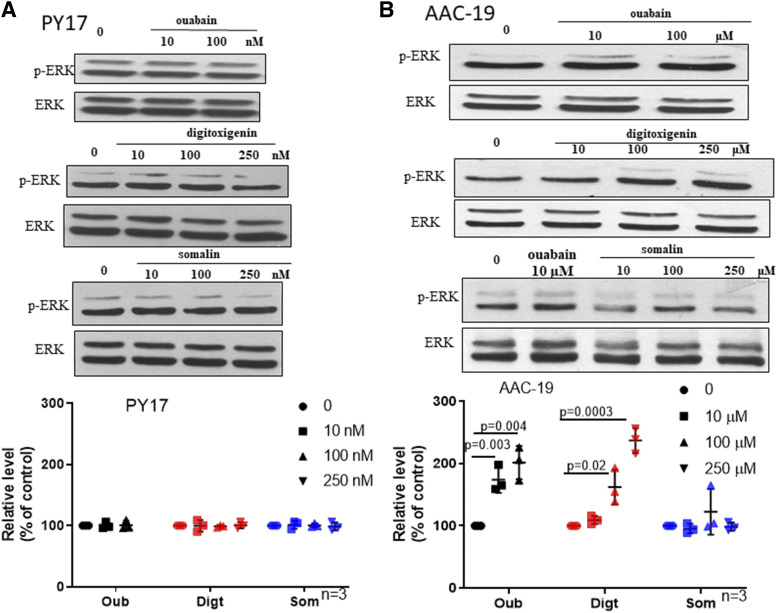
To verify that the biased effects of digitoxigenin and somalin are specific through NKA signaling, we performed an ERK activation assay in NKA α1-subunit knockdown and knock-in cell lines that have been generated in our laboratory (Liang et al., 2006), including PY-17 (PY17) cells, a cell line containing only 8% of the NKA α1-subunit, and AAC-19 cells, a cell line that was rescued by a rat NKA α1 for the knockdown PY-17 cells. Functional studies have indicated that knockdown of NKA α1 decreased the interaction between the Na/K-ATPase and Src and resulted in an increase in basal Src activity. Concomitantly, it also abolished CTS ouabain-induced activation of Src and the downstream ERK cascade (Liang et al., 2006). Based on these, we tested the effect of somalin and digitoxigenin on ERK activation in PY-17 cells and AAC-19 cells. As expected, in Fig. 4A, both somalin and digitoxigenin failed to activate ERK in PY-17 cells, and the NKA α1 knockdown abolished digitoxigenin-induced activation of ERK. When the knockdown cells were rescued by a rat α1 (Fig. 4B), digitoxigenin-induced ERK activation was restored. As in LLC-PK1 cells, somalin has no effect on ERK in AAC-19 cells. In addition, digitoxigenin was able to stimulate ERK in the rescued cells at a much higher concentration, which is consistent with the established differences in ouabain sensitivity between pig (LLC-PK1 cells) and rat α1 (AAC-19 cells).
Fig. 4.
CTS effects on ERK activation in PY17 and AAC-19 cells. Cells [(A) PY17; (B) AAC-19] were treated with ouabain (Oub), somalin (Som), digitoxigenin (Digt), and driving solution (Cont) for 10 minutes and probed for phospho-ERK (p-ERK) by Western blot. Upper panel: representative Western blot. Lower panel: grouped table format for respective CTS treatment presented as means ± S.D.; n = 3. (C) AAC-19 cells were treated with indicated concentration of CTS for 10 minutes and probed for phospho-ERK by Western blot. Upper panel: representative Western blot. Lower panel: grouped table format for respective CTS treatment presented as means ± S.D.; n = 3. Using grouped analyses of multiple t tests, one per row. The statistical significance was determined using the Holm-Sidak method, with α = 0.05. Each row was analyzed individually, without assuming a consistent S.D.
Taken together, these data suggest that digitoxigenin favors protein kinase activation and somalin favors NKA endocytosis without impacting protein kinase activation (Figs. 2 and 3). It is essential to point out that both digitoxigenin and somalin are about 5-fold more potent than ouabain as NKA inhibitors (Table 1). Yet they showed distinct concentration-responses in stimulating signal transduction. Significantly, they can produce these signaling events at doses 10 times lower than their IC50, meaning that they can initiate signaling without affecting the cellular pumping capacity.
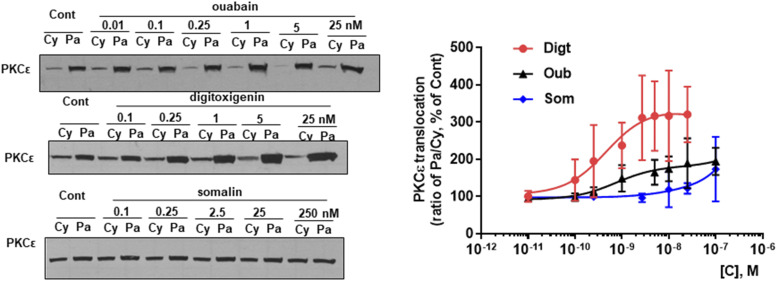
We have shown that ouabain not only activates ERK by Src-dependent transactivation of EGFR and subsequent assembly of the Ras/Raf/MEK/ERK cascade but also activates PKCε by Src/EGFR-mediated activation of phospholipase C γ (Mohammadi et al., 2001). To further test the CTS bias, we also tested the effect of CTS on PKCε activation. As shown in Fig. 5, LLC-PK1 cells were treated with the indicated concentration of CTS for 15 minutes. Cytosolic and particulate fractions were prepared from cell lysates. As expected, ouabain increased particulate/cytosolic ratios of PKCε contents. Digitoxigenin showed a more potent effect than ouabain, whereas somalin has no effect on PKCε activation.
Fig. 5.
CTS effects on PKCε activation in LLC-PK1 cells. LLC-PK1 cells were treated with indicated CTS for 15 minutes. Cytosolic (Cy) and particulate (Pa) fractions were prepared from cell lysates and PKCε activation as measured by Pa/Cy ratios of PKCε contents compared by Western blot analysis. Left panel: representative blots are shown. Right panel: dose curve for respective CTS treatment. Individual values are presented as means ± S.D.; n = 3–6 for ouabain (Oub) group, n = 4–10 for somalin (Som), and n = 4–12 for digitoxigenin (Digt) group. The n numbers are varied because some of the data are combined from different repeats with different concentration sets by different people.
CTS-induced endocytosis of NKA and activation of ERK represent a good spectrum of signal transduction to identify the biased effect of CTS. We used two general approaches to quantify CTS-induced signaling bias, which is being validated in GPCRs (Rajagopal et al., 2011). The first is an originally proposed qualitative approach referred to as “equimolar comparison” (Gregory et al., 2010; Rajagopal et al., 2011).
Concentration curves for ouabain, somalin, and digitoxigenin are collected in two assays, including an ERK activation assay and an NKA α1 endocytosis assay (Fig. 2D and Fig. 3). At the same concentration, the responses of these two assays of ouabain, somalin, and digitoxigenin are then plotted against each other. As shown in Fig. 6A, compared with reference-balanced ouabain, the shape of the equimolar curve for somalin was biased to NKA α1 endocytosis but was biased to ERK activation for digitoxigenin. The second approach is the quantification of bias factors by using an equiactive model. In this approach, a bias factor, denoted β, is calculated as the logarithm of the ratio of relative activities for somalin and digitoxigenin at two assays, including ERK activation assay and NKA α1 endocytosis assay, compared with reference ouabain. This comparison was performed using eq. 1 as described in Materials and Methods, which was calculated from the maximal response (Emax) obtained from the experiment and the concentration of CTS that provokes a half response (EC50) calculated on Prism (GraphPad). As shown in Fig. 6B, bias factors driven by ERK activation assay and biotinylation assay demonstrated the biased effect of digitoxigenin and somalin. Somalin relatively stabilized NKA α1 endocytosis over ERK activation, and digitoxigenin stabilized ERK activation over NKA α1 endocytosis compared with endogenous ouabain.
Discussion
A ligand’s ability to stabilize a unique subset of receptor conformations that promote signaling through distinct pathways to the exclusion of others has been termed ligand bias (Kenakin and Christopoulos, 2013). Ligand bias is associated with the structure of the ligand and receptor systems. After proposing the signaling function of NKA, numerous studies indicate that the NKA is a signal transducer that interacts with several signaling partners (Xie, 2003; Xie and Xie, 2005; Cui and Xie, 2017). CTS as NKA ligands have been shown to regulate protein interactions and consequently to activate cellular signaling events. This work accumulated evidence of CTS bias that differentially influences NKA receptor behavior and, consequently, transduces signaling through distinct pathways.
The existence of conformational states of NKA and NKA receptor signaling components lay a fundamental basis for signaling bias. According to the concept of ligand bias proposed in the G protein–coupled receptor, eligibility of CTS bias could include CTS-triggered conformational changes and the imposition of altered CTS-bound NKA receptor behavior, which are initiated by selectively starting a biochemical reaction over others. Evidences have shown that the binding of different CTS could lead to different structural changes in NKA came from the studies by Klimanova et al. (2015), which showed variations in fluorescence level upon binding of CTS ouabain or marinobufagenin using different fluorescent labels targeted to specific residues in the nucleotide-binding domain of NKA, giving direct evidence of distinguished NKA structural changes promoted by different CTS (Klimanova et al., 2015). Also, Azalim et al. (2020) have confirmed that CTS binding to the NKA is affected by different conformational states of the enzyme in LLC-PK1 cells.
Moreover, few works have suggested that, although the signaling pathways are similar, different effects may be elicited by specific CTS in the same measurement system. For example, it has been demonstrated that ouabain attenuates the cardiotoxicity induced by other CTS, like digoxin and bufalin (Nesher et al., 2010). This effect is not supported by NKA’s ion transport function since ouabain has not been demonstrated to antagonize digoxin-induced inhibition of NKA activity (Nesher et al., 2010).
When considering the possible molecular mechanisms, the biased effect of CTS, evidenced by this work, could be responsible for these functional diversities, which lies in 1) an initial association of CTS with NKA. It has been shown that the NKA prebinding conformation (the phosphorylated form of the Na/K-ATPase in E1 and E2 state (E1P/E2P)) is ambiguous in a purified enzyme system (Yoda and Yoda, 1982a,b), which is a possible implication for physiologic ambiguous NKA conformations for CTS binding (Paula et al., 2005), which is regulated by protein compositions; 2) the conformational rearrangement of the NKA, allowing for CTS binding in the binding pocket (Weigand et al., 2014); and 3) CTS-stabilized different NKA receptor active states that go on to interact with cellular signaling proteins and lipids to form varieties of complexes in varying quantities. CTS-specific conformation affects direct NKA/effector interaction and the level of protein kinase recruitment. CTS-stimulated alterations of NKA’s state result in signaling events, including signal transduction, endocytosis of NKA receptor, and formation of intracellular scaffolds, can be fundamental principles for CTS bias; and 4) dissociation process is solely dependent on the nature of the CTS structure. For instance, the sugar moiety and alternation of the steroid moiety of CTS were reported to influence the dissociation process (Cornelius et al., 2013; Yoda, 1974). Switches in any of the steps mentioned above could trigger an allosteric NKA microprocessor.
By viewing NKA receptor systems, including NKA conformation and the current knowledge about the NKA receptor signaling components in which direct protein interactions is the molecular mechanism of signal transduction. This work provided evidence that different CTS could trigger biased signaling responses without compromising cells’ ion-pumping capacity, presenting a unique cellular response. Before our appreciation of NKA as an essential signal transducer, we have only viewed CTS as pump inhibitors. Therefore, we have not fully appreciated CTS’s potential effects on cardiac structure and remodeling by affecting cells. Recent studies with transgenic animals and using tools that either increase or block NKA-mediated signal transduction have generated a large body of evidence for an important role of NKA in the regulation of cardiac remodeling (Xie et al., 1999; Kometiani et al., 2000; Elkareh et al., 2007; Wansapura et al., 2010; Vetteth et al., 2012). However, although it is now well accepted that NKA has an ion-pumping–independent signaling function, it is still debated whether direct and conformation-dependent NKA/effector interaction is a key to this function. Therefore, this investigation is significant in advancing our understanding of the basic biology of NKA-mediated signal transduction and gaining molecular insight into the structural elements that are important for CTS’s biased action. It also will lay a solid foundation for the eventual identification of a novel subclass of CTS that is as effective as inotrope but less toxic than digoxin for patients with congestive heart failure.
Acknowledgments
The authors thank Dr. Laura Kutz for polishing English editing, Carla Cook for invaluable technical support, and the Division of Animal Resources of the Marshall University Joan C. Edwards School of Medicine for animal care.
Abbreviations
- CTS
cardiotonic steroids
- EGFR
epidermal growth factor receptor
- ERK
extracellular-signal–related kinase
- GPCR
G protein–coupled receptor
- MEK
MAPK/ERK Kinase
- MAPK
mitogen-activated protein kinase
- NKA
Na/K-ATPase
- PKC
protein kinase C
- PKE
pig kidney enzyme
- RAF
Rapidly Accelerated Fibrosarcoma
- Ras
small guanosin triphosphatases (GTPase)
- Src
proto-oncogene c-Src
- YFP
yellow fluorescent protein
Authorship Contributions
Participated in research design: Xu, Shapiro, Cai, Feng, Z. Xie.
Conducted experiments: Xu, Marck.
Performed data analysis: Xu, Marck, Huang, J.Xie, Wang.
Wrote or contributed to the writing of the manuscript: Xu, Shapiro, Cai, Feng, Z. Xie.
Footnotes
This work was supported by the American Heart Association (AHA) postdoctoral fellowship [18POST33990237]; National Institutes of Health National Heart, Lung, and Blood Institute [HL109015]; and the Marshall Institute for Interdisciplinary Research (MIIR) fund.
The authors declare no competing interests.
Zijian Xie is deceased.
 This article has supplemental material available at molpharm.aspetjournals.org.
References
- Azalim P, do Monte FM, Rendeiro MM, Liu X, O’Doherty GA, Fontes CF, Leitão SG, Quintas LEM, Noël F (2020) Conformational states of the pig kidney Na(+)/K(+)-ATPase differently affect bufadienolides and cardenolides: a directed structure-activity and structure-kinetics study. Biochem Pharmacol 171:113679. [DOI] [PubMed] [Google Scholar]
- Cai T, Wang H, Chen Y, Liu L, Gunning WT, Quintas LE, Xie ZJ (2008) Regulation of caveolin-1 membrane trafficking by the Na/K-ATPase. J Cell Biol 182:1153–1169. [DOI] [PMC free article] [PubMed] [Google Scholar]
- Chen Y, Li X, Ye Q, Tian J, Jing R, Xie Z (2011) Regulation of alpha1 Na/K-ATPase expression by cholesterol. J Biol Chem 286:15517–15524. [DOI] [PMC free article] [PubMed] [Google Scholar]
- Cornelius F, Kanai R, Toyoshima C (2013) A structural view on the functional importance of the sugar moiety and steroid hydroxyls of cardiotonic steroids in binding to Na,K-ATPase. J Biol Chem 288:6602–6616. [DOI] [PMC free article] [PubMed] [Google Scholar]
- Cui X, Xie Z (2017) Protein interaction and Na/K-ATPase-mediated signal transduction. Molecules 22:990. [DOI] [PMC free article] [PubMed] [Google Scholar]
- Drummond CA, Fan X, Haller ST, Kennedy DJ, Liu J, Tian J (2018) Na/K-ATPase signaling mediates miR-29b-3p regulation and cardiac fibrosis formation in mice with chronic kidney disease. PLoS One 13:e0197688. [DOI] [PMC free article] [PubMed] [Google Scholar]
- Drummond CA, Hill MC, Shi H, Fan X, Xie JX, Haller ST, Kennedy DJ, Liu J, Garrett MR, Xie Z, et al. (2016) Na/K-ATPase signaling regulates collagen synthesis through microRNA-29b-3p in cardiac fibroblasts. Physiol Genomics 48:220–229. [DOI] [PMC free article] [PubMed] [Google Scholar]
- Duan Q, Xu Y, Marck PV, Kalisz J, Morgan EE, Pierre SV (2018) Preconditioning and postconditioning by cardiac glycosides in the mouse heart. J Cardiovasc Pharmacol 71:95–103. [DOI] [PMC free article] [PubMed] [Google Scholar]
- Eisner D, Smith T (1992) The Na-K pump and its effectors in cardiac muscle. The heart and cardiovascular system 2:863–902. [Google Scholar]
- Elkareh J, Kennedy DJ, Yashaswi B, Vetteth S, Shidyak A, Kim EG, Smaili S, Periyasamy SM, Hariri IM, Fedorova L, et al. (2007) Marinobufagenin stimulates fibroblast collagen production and causes fibrosis in experimental uremic cardiomyopathy. Hypertension 49:215–224. [DOI] [PubMed] [Google Scholar]
- Gregory KJ, Hall NE, Tobin AB, Sexton PM, Christopoulos A (2010) Identification of orthosteric and allosteric site mutations in M2 muscarinic acetylcholine receptors that contribute to ligand-selective signaling bias. J Biol Chem 285:7459–7474. [DOI] [PMC free article] [PubMed] [Google Scholar]
- Haas M, Askari A, Xie Z (2000) Involvement of Src and epidermal growth factor receptor in the signal-transducing function of Na+/K+-ATPase. J Biol Chem 275:27832–27837. [DOI] [PubMed] [Google Scholar]
- Haas M, Wang H, Tian J, Xie Z (2002) Src-mediated inter-receptor cross-talk between the Na+/K+-ATPase and the epidermal growth factor receptor relays the signal from ouabain to mitogen-activated protein kinases. J Biol Chem 277:18694–18702. [DOI] [PubMed] [Google Scholar]
- Hamlyn JM, Lu Z-R, Manunta P, Ludens JH, Kimura K, Shah JR, Laredo J, Hamilton JP, Hamilton MJ, Hamilton BP (1998) Observations on the nature, biosynthesis, secretion and significance of endogenous ouabain. Clin Exp Hypertens 20:523–533. [DOI] [PubMed] [Google Scholar]
- Hamlyn JM, Ringel R, Schaeffer J, Levinson PD, Hamilton BP, Kowarski AA, Blaustein MP (1982) A circulating inhibitor of (Na++ K+) ATPase associated with essential hypertension. Nature 300:650–652. [DOI] [PubMed] [Google Scholar]
- Kenakin T, Christopoulos A (2013) Signalling bias in new drug discovery: detection, quantification and therapeutic impact. Nat Rev Drug Discov 12:205–216. [DOI] [PubMed] [Google Scholar]
- Klimanova EA, Petrushanko IY, Mitkevich VA, Anashkina AA, Orlov SN, Makarov AA, Lopina OD (2015) Binding of ouabain and marinobufagenin leads to different structural changes in Na,K-ATPase and depends on the enzyme conformation. FEBS Lett 589:2668–2674. [DOI] [PubMed] [Google Scholar]
- Kometiani P, Li J, Gnudi L, Kahn BB, Askari A, Xie Z (1998) Multiple signal transduction pathways link Na+/K+-ATPase to growth-related genes in cardiac myocytes. The roles of Ras and mitogen-activated protein kinases. J Biol Chem 273:15249–15256. [DOI] [PubMed] [Google Scholar]
- Kometiani P, Tian J, Li J, Nabih Z, Gick G, Xie Z (2000) Regulation of Na/K-ATPase beta1-subunit gene expression by ouabain and other hypertrophic stimuli in neonatal rat cardiac myocytes. Mol Cell Biochem 215:65–72. [DOI] [PubMed] [Google Scholar]
- Laursen M, Gregersen JL, Yatime L, Nissen P, Fedosova NU (2015) Structures and characterization of digoxin- and bufalin-bound Na+,K+-ATPase compared with the ouabain-bound complex. Proc Natl Acad Sci USA 112:1755–1760. [DOI] [PMC free article] [PubMed] [Google Scholar]
- Li Z, Xie Z (2009) The Na/K-ATPase/Src complex and cardiotonic steroid-activated protein kinase cascades. Pflugers Arch 457:635–644. [DOI] [PubMed] [Google Scholar]
- Liang M, Cai T, Tian J, Qu W, Xie ZJ (2006) Functional characterization of Src-interacting Na/K-ATPase using RNA interference assay. J Biol Chem 281:19709–19719. [DOI] [PubMed] [Google Scholar]
- Lingrel JB, Kuntzweiler T (1994) Na+,K(+)-ATPase. J Biol Chem 269:19659–19662. [PubMed] [Google Scholar]
- Liu J, Kesiry R, Periyasamy SM, Malhotra D, Xie Z, Shapiro JI (2004) Ouabain induces endocytosis of plasmalemmal Na/K-ATPase in LLC-PK1 cells by a clathrin-dependent mechanism. Kidney Int 66:227–241. [DOI] [PubMed] [Google Scholar]
- Liu J, Liang M, Liu L, Malhotra D, Xie Z, Shapiro JI (2005) Ouabain-induced endocytosis of the plasmalemmal Na/K-ATPase in LLC-PK1 cells requires caveolin-1. Kidney Int 67:1844–1854. [DOI] [PubMed] [Google Scholar]
- Liu J, Periyasamy SM, Gunning W, Fedorova OV, Bagrov AY, Malhotra D, Xie Z, Shapiro JI (2002) Effects of cardiac glycosides on sodium pump expression and function in LLC-PK1 and MDCK cells. Kidney Int 62:2118–2125. [DOI] [PubMed] [Google Scholar]
- Liu J, Tian J, Haas M, Shapiro JI, Askari A, Xie Z (2000) Ouabain interaction with cardiac Na+/K+-ATPase initiates signal cascades independent of changes in intracellular Na+ and Ca2+ concentrations. J Biol Chem 275:27838–27844. [DOI] [PubMed] [Google Scholar]
- Liu L, Zhao X, Pierre SV, Askari A (2007) Association of PI3K-Akt signaling pathway with digitalis-induced hypertrophy of cardiac myocytes. Am J Physiol Cell Physiol 293:C1489–C1497. [DOI] [PubMed] [Google Scholar]
- Mohammadi K, Kometiani P, Xie Z, Askari A (2001) Role of protein kinase C in the signal pathways that link Na+/K+-ATPase to ERK1/2. J Biol Chem 276:42050–42056. [DOI] [PubMed] [Google Scholar]
- Nesher M, Shpolansky U, Viola N, Dvela M, Buzaglo N, Cohen Ben-Ami H, Rosen H, Lichtstein D (2010) Ouabain attenuates cardiotoxicity induced by other cardiac steroids. Br J Pharmacol 160:346–354. [DOI] [PMC free article] [PubMed] [Google Scholar]
- Pierre SV, Yang C, Yuan Z, Seminerio J, Mouas C, Garlid KD, Dos-Santos P, Xie Z (2007) Ouabain triggers preconditioning through activation of the Na+,K+-ATPase signaling cascade in rat hearts. Cardiovasc Res 73:488–496. [DOI] [PMC free article] [PubMed] [Google Scholar]
- Rajagopal S, Ahn S, Rominger DH, Gowen-MacDonald W, Lam CM, Dewire SM, Violin JD, Lefkowitz RJ (2011) Quantifying ligand bias at seven-transmembrane receptors. Mol Pharmacol 80:367–377. [DOI] [PMC free article] [PubMed] [Google Scholar]
- Schatzmann HJ (1953) Herzglykoside als Hemmstoffe für den aktiven Kalium- und Natriumtransport durch die Erythrocytenmembran [Cardiac glycosides as inhibitors of active potassium and sodium transport by erythrocyte membrane]. Helv Physiol Pharmacol Acta 11:346–354. [PubMed] [Google Scholar]
- Scheiner-Bobis G, Schoner W (2001) A fresh facet for ouabain action. Nat Med 7:1288–1289. [DOI] [PubMed] [Google Scholar]
- Skou JC (1988) The Na,K-pump. Methods Enzymol 156:1–25. [DOI] [PubMed] [Google Scholar]
- Paula S, Tabet MR, Ball WJ Jr (2005) Interactions between cardiac glycosides and sodium/potassium-ATPase: three-dimensional structure-activity relationship models for ligand binding to the E2-Pi form of the enzyme versus activity inhibition. Biochemistry 44:498–510. [DOI] [PubMed] [Google Scholar]
- Tian J, Li X, Liang M, Liu L, Xie JX, Ye Q, Kometiani P, Tillekeratne M, Jin R, Xie Z (2009) Changes in sodium pump expression dictate the effects of ouabain on cell growth. J Biol Chem 284:14921–14929. [DOI] [PMC free article] [PubMed] [Google Scholar]
- Vetteth S, Malhotra D, Shapiro JI (2012) Cardiotonic Steroids and Cardiac Fibrosis, INTECH Open Access Publisher, London. [Google Scholar]
- Wansapura AN, Lasko V, Lingrel JB, Lorenz JN (2010) Mice expressing ouabain-sensitive α1 Na, K-ATPase have increased susceptibility to pressure overload-induced cardiac hypertrophy. Am J Physiol Heart Circ Physiol 300:H347–H355. [DOI] [PMC free article] [PubMed] [Google Scholar]
- Weigand KM, Laursen M, Swarts HG, Engwerda AH, Prüfert C, Sandrock J, Nissen P, Fedosova NU, Russel FG, Koenderink JB (2014) Na(+),K(+)-ATPase isoform selectivity for digitalis-like compounds is determined by two amino acids in the first extracellular loop. Chem Res Toxicol 27:2082–2092. [DOI] [PubMed] [Google Scholar]
- Xie JX, Li X, Xie Z (2013) Regulation of renal function and structure by the signaling Na/K-ATPase. IUBMB Life 65:991–998. [DOI] [PMC free article] [PubMed] [Google Scholar]
- Xie Z (2001) Ouabain interaction with cardiac Na/K-ATPase reveals that the enzyme can act as a pump and as a signal transducer. Cell Mol Biol 47:383–390. [PubMed] [Google Scholar]
- Xie Z (2003) Molecular mechanisms of Na/K-ATPase-mediated signal transduction. Ann N Y Acad Sci 986:497–503. [DOI] [PubMed] [Google Scholar]
- Xie Z, Kometiani P, Liu J, Li J, Shapiro JI, Askari A (1999) Intracellular reactive oxygen species mediate the linkage of Na+/K+-ATPase to hypertrophy and its marker genes in cardiac myocytes. J Biol Chem 274:19323–19328. [DOI] [PubMed] [Google Scholar]
- Xie Z, Xie J (2005) The Na/K-ATPase-mediated signal transduction as a target for new drug development. Front Biosci 10:3100–3109. [DOI] [PubMed] [Google Scholar]
- Xu Y, Jiang X, Xu J, Qu W, Xie Z, Jiang R-W, Feng F (2021) A previously undescribed phenylethanoid glycoside from Callicarpa kwangtungensis Chun acts as an agonist of the Na/K-ATPase signal transduction pathway. Phytochemistry 181:112577. [DOI] [PubMed] [Google Scholar]
- Yatime L, Laursen M, Morth JP, Esmann M, Nissen P, Fedosova NU (2011) Structural insights into the high affinity binding of cardiotonic steroids to the Na+,K+-ATPase. J Struct Biol 174:296–306. [DOI] [PubMed] [Google Scholar]
- Ye Q, Lai F, Banerjee M, Duan Q, Li Z, Si S, Xie Z (2013) Expression of mutant α1 Na/K-ATPase defective in conformational transition attenuates Src-mediated signal transduction. J Biol Chem 288:5803–5814. [DOI] [PMC free article] [PubMed] [Google Scholar]
- Yoda A (1974) Association and dissociation rate constants of the complexes between various cardiac monoglycosides and Na, K-ATPase. Ann N Y Acad Sci 242:598–616. [DOI] [PubMed] [Google Scholar]
- Yoda A, Yoda S (1982a) Formation of ADP-sensitive phosphorylated intermediate in the electric eel Na, K-ATPase preparation. Mol Pharmacol 22:693–699. [PubMed] [Google Scholar]
- Yoda A, Yoda S (1982b) Interaction between ouabain and the phosphorylated intermediate of Na,K-ATPase. Mol Pharmacol 22:700–705. [PubMed] [Google Scholar]
- Yuan Z, Cai T, Tian J, Ivanov AV, Giovannucci DR, Xie Z (2005) Na/K-ATPase tethers phospholipase C and IP3 receptor into a calcium-regulatory complex. Mol Biol Cell 16:4034–4045. [DOI] [PMC free article] [PubMed] [Google Scholar]


