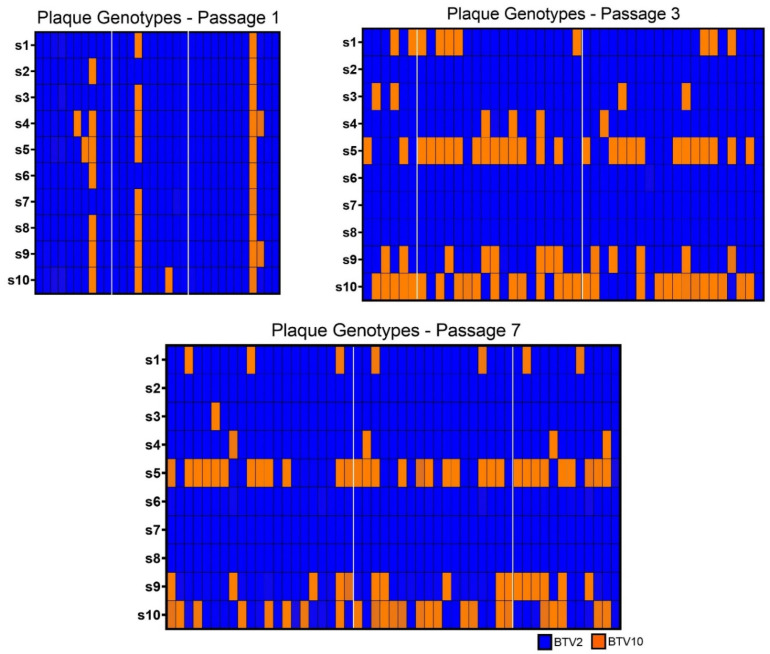
Figure 3.
Plaque Genotypes. Plaque genotypes from isolates collected at passages 1, 3, and 7 were determined using amplicon-based sequencing to detect the identify of each segment. Segments derived from BTV-2 are shown in blue, while those derived from BTV-10 are shown in orange. The segment identities of each isolate for segments 1 through 10 (s1, s2, s3, s4, s5, s6, s7, s8, s9, s10) are depicted in descending order in each column so that each column represents the full ten segments of an individual plaque (i.e., its complete genotype). Plaques isolated from each replicate at passages 1, 3, and 7 are demarcated by white margins.

