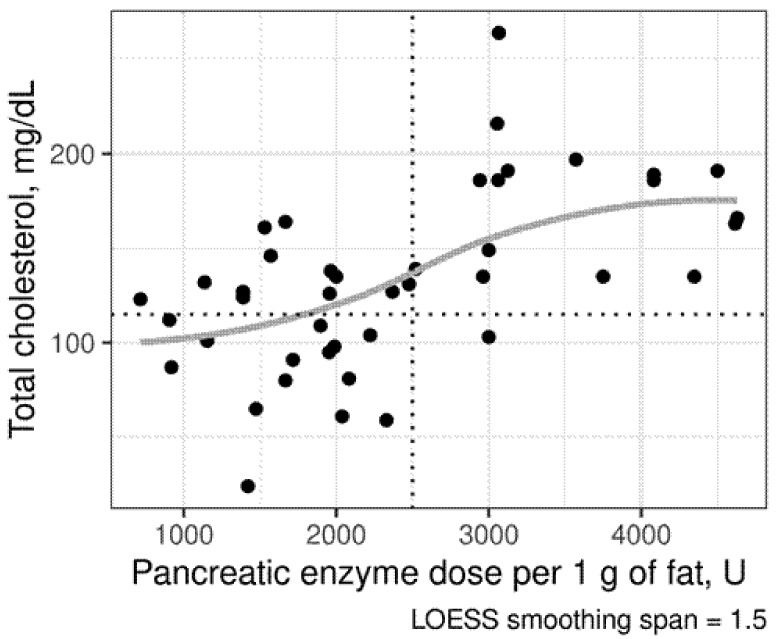
Figure 5.
Scatterplot of total cholesterol in pancreatic-insufficient (PI) patients with cystic fibrosis (CF) with different doses of pancreatic enzymes. Points below the dotted horizontal line indicate patients with hypocholesterolemia as defined by the local laboratory reference range (< 115 mg/dL or 3 mmol/L). The vertical line was set at the enzyme dose of 2750 lipase units/g of fat, above which only one patient experienced hypocholesterolemia. The lower rate of hypocholesterolemia in PI CF patients receiving >2500 U/d of pancreatic enzyme replacement therapy was confirmed by Fisher’s test (two-sided p = 0.0026). Locally estimated scatterplot smoothing (LOWESS) curve is displayed in grey.

