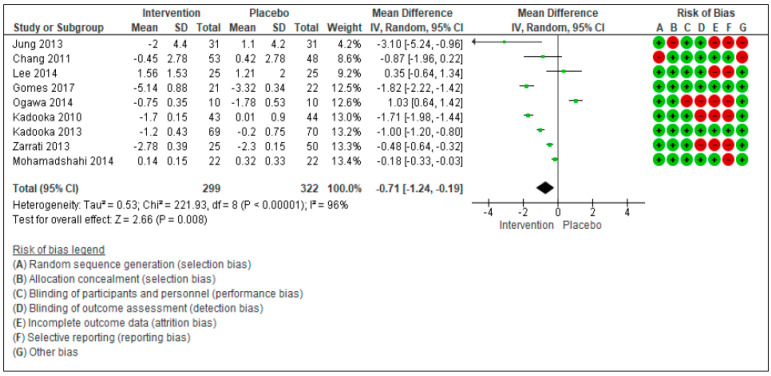
Figure 3.
Forest plot for randomized controlled trials of probiotic supplementation included in waist circumference (cm) subgroup meta-analysis (n = 621). The studies are listed by first author and year. IV = equation that can be estimated by inverse variance (linear, exponential). The square represents the measures of effect (i.e., an odd ratios) for each study; the area of each square is proportional to the study’s weight in the meta-analysis. The horizontal line represents the confidence interval CI) at the 95% level. The diamond represents the meta-analyzed measure of effect; the lateral points of diamond indicate CIs for this estimate. The vertical line represents no effects; if the CI for an individual study overlaps with this line, the given level of confidence for the effect size does not differ from no effect for that study. Risk of bias indicate the level of high and low risk associated with the article, with green signal for low risk and red for high risk of bias.

