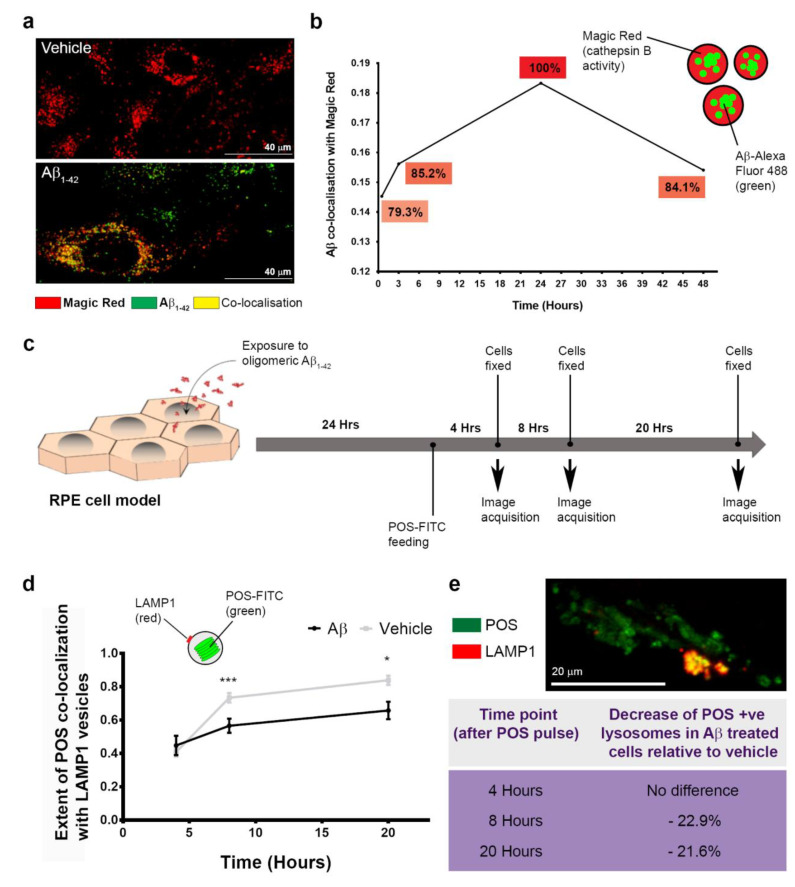
Figure 8.
The pattern of Aβ aggregation in RPE lysosomes and consequences to RPE function. (a) Representative confocal immunofluorescence image showing a high proportion of late-endocytic compartments positive for Aβ1-42 (green), which co-localize with Magic Red to appear yellow. Scale bars correspond to 40 μm. (b) Dynamics of Aβ1-42 entry into lysosomes of RPE cells shown relative to vehicle-treated cultures, which reached an arbitrary point of maximal aggregation after 24 h. Only minimal degradation of the Aβ fluorescence signal was observed after 24 h following maximal aggregation (or by 48 h after initial Aβ exposure). Consequently, ˃80% of Aβ present at the 24 h time point remained sequestered with RPE lysosomes a day later. Data from three biological replicates. (c) Schematic showing experimental plan where RPE cultures exposed to either Aβ1-42 or vehicle were fed with POS a day later, and co-localization with LAMP1 vesicles quantified thereafter at 4, 8 and 20 h. (d) Graph showing extent of POS co-localization in LAMP1 vesicles after POS feeding. Two-tailed unpaired Student’s t-test. Data from three biological replicates, where * denotes a significance of p ˂ 0.05, whilst *** indicate p ˂ 0.001. (e) Representative confocal-immunofluorescence image showing POS-FITC (green) co-localizing with LAMP1 compartments (red) and appear yellow. Scale bar corresponds to 20 μm. Summary table showing percentage decrease in LAMP1-positive vesicles with POS cargos at different time points after POS feeding in Aβ-treated cells relative to vehicle. Aβ-exposed RPE had significantly fewer lysosomes capable to trafficking POS cargos after 8 h.

