Abstract
Objectives:
Quantification of dental implant metal artefacts in CBCT images using correlation analysis of trabecular microstructural parameters from CBCT and micro-CT, and analysis of the effect of varying the angular position of the subject.
Methods:
Polyurethane synthetic bone blocks were first scanned without implants by micro-CT and CBCT. Two dental implants were then placed parallel in the bone blocks and these specimens were scanned by CBCT with different alpha angles. Three volumes of interest (VOI) were set for further analysis. Six microstructural parameters were measured: trabecular thickness (TbTh), trabecular spacing (ThSp), bone volume per total volume (BV/TV), bone surface per total volume (BS/TV), connectivity density (CD) andfractal dimension (FD). Micro-CT measurements were used as a gold standard for CBCT. Spearman correlation coefficients for each microstructural parameter from CBCT and micro-CT were calculated and compared using Steiger’s Z test.
Results:
Without the implants, in VOI1, the Spearman correlation coefficients of TbTh, TbSp, BV/TV, BS/TV, CD and FD were 0.599, 0.76, 0.552, 0.566, 0.664 and 0.607, respectively. With the implants, the correlation coefficients decreased sharply in VOI1. As the alpha angle increased from zero to 90°, the correlation coefficients increased and became significant. Similar results appeared in VOI2. In contrast, in VOI3, the correlation coefficient decreased as the alpha angle increased.
Conclusions:
Metal artefacts were successfully quantified using microstructural parameters in terms of the image quality of the CBCT. Changes in alpha angle affected the quality of the CBCT image.
Keywords: Diagnostic Imaging, Cone-beam Computed Tomography, Artefacts, Dental implant
Introduction
Metal artefacts are structures which appear in CBCT images but which do not exist in the subject.1 Due to the extensive use of metal in dental practice, metal artefacts have been a great challenge in dental imaging.2 Among the many metal products used in dentistry, dental implants are becoming more common for restoring the edentulous alveolar ridge. Due to metal artefacts caused by these metal products (including dental implants), it is very challenging for clinicians to diagnose CBCT images.3–5
Many studies have attempted to reduce metal artefacts in CBCT images. Factors affecting metal artefacts have been explored, including exposure condition, subject position, implant material and reconstruction algorithm.6–12 In particular, studies have investigated the effect of the angular position of the subject on metal artefacts for MDCT and CBCT imaging.13–15 Min et al suggested that the angular position of the subject affects the metal artefacts of dental implants in CBCT images.16 In most studies, metal artefacts have been quantified using several measurements such as mean gray value, standard deviation of gray value or contrast-to-noise ratio.5,17–19 But, it is difficult to correlate these technical image quality metrics to diagnostic image quality. Quantitative analysis of metal artefacts of dental implants should contain structural information of surrounding bone to demonstrate image quality of CBCT.
Trabecular microstructural parameters have been used to describe the quality of trabecular bone. The parameters measured in CBCT show high correlation with those measured in micro-CT or histology.20–25 The high correlation allow the pre-operative evaluation of trabecular bone at target sites, as well as the analysis of bone quality in an augmented maxillary sinus using CBCT.26,27 Thus, through correlation analysis with micro-CT, microstructural parameters could be demonstrated to be a reliable indicator of image quality of CBCT.
The purpose of this study is to quantify the quality of CBCT images containing metal artefacts using correlation analysis of trabecular microstructural parameters from the CBCT with micro-CT. The effect of subject rotation on metal artefacts was investigated by comparing the correlation coefficients for CBCT images from varying subject angles.
Methods and materials
Specimen preparation
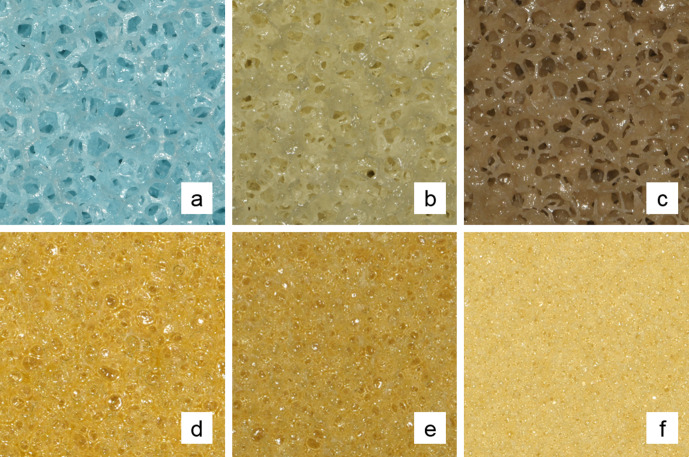
Polyurethane synthetic bone (SKU 1522–09, 1522–10, 1522–1300, 1522–507, 1522–523 and 1522–524, Sawbones, WA, USA) was used to simulate real bone. Six types of synthetic bone were used, with different densities and trabecular morphologies (Figure 1). Eight synthetic bone blocks of 2.5×1.5×2.0 cm for each bone type were prepared, resulting in total of 48 blocks. Two dental implants (Point Implant, POINTNIX Co., Ltd, Korea) with 4 mm width and 10 mm length were placed parallel to each other in each bone block. Centre-to-centre distance between the implants was 8.5 mm. The implants were then gently removed from the bone block.
Figure 1.
The Six types of polyurethane synthetic bones with various trabecular morphologies and densities. a, b, c, d, e and f refer to SKU 1522–507, 1522–523, 1522–524, 1522–09, 1522–10 and 1522–1300, respectively.
Micro-CT imaging
All 48 blocks, without the implants, were scanned with micro-CT (SkyScan 1076, Bruker, Kontich, Belgium). The imaging parameters were as follows: 100kV, 100 uA, 700 ms exposure time for each projection, 360° rotation and 600 basis projections. Using NRecon software (v.1.7.0.4, Bruker, Kontich, Belgium), each scan was reconstructed with an isotropic voxel size of 17.58 um and exported as a 16bit TIFF file.
CBCT imaging
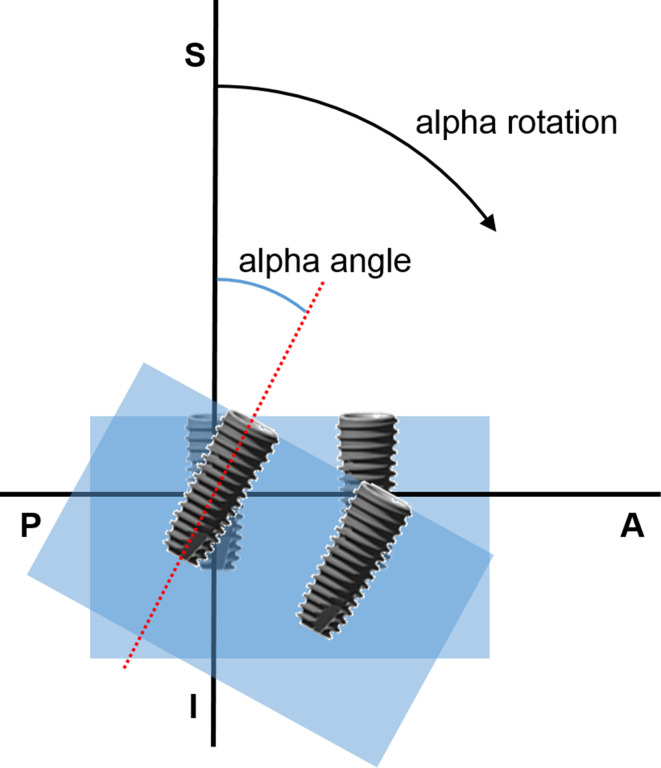
The 48 blocks were mounted on a custom-made device and scanned with CBCT.16 The specimens could rotate along three different spatial axes using this device. Among three different rotations, one direction of rotation was investigated. Alpha rotation represents a rotation in the plane that including the longitudinal axes of the two implants (Figure 2). At the default position when alpha angle was zero, the two implants were perpendicular to the source-detector plane. First the synthetic bone blocks without implants were scanned with the CBCT machine (Alphard 3030, Asahiroentgen Ind., Japan) at the alpha angle of zero. Then, the implants were returned into the drilled holes and each specimen was scanned at 0, 15, 30, 45, 60, 75 and 90° alpha angles. Acquisition parameters were as follows: 78 kV, 8 mA, 17 s exposure time, 360° rotation, 51×51 mm field of view (FOV), and 512 basis projections. Using an image processing software (OnDemand3D, Cybermed Inc., Korea), each scan was reconstructed with an isotropic voxel size of 0.1 mm and saved in standard DICOM format.
Figure 2.
Description of alpha rotation and alpha angle. A, anterior; P, posterior; S, superior; I, inferior;
Image analysis
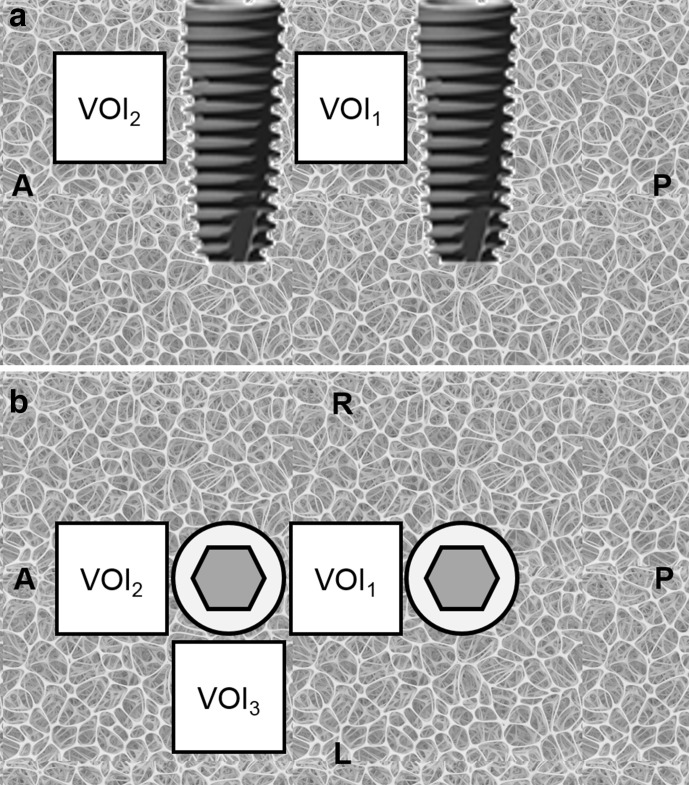
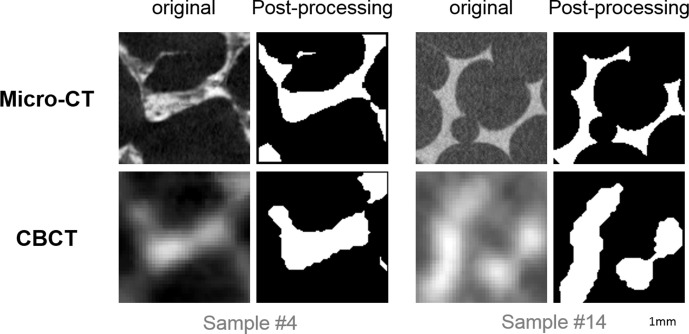
Reconstructions of both micro-CT and CBCT images from the same specimen were automatically registered by an intensity-based method followed by manual modification in DataViewer software (v.1.5.2.4, Bruker, Kontich, Belgium). With ImageJ software (version 1.52p, NIH, USA), three volumes of interest (VOI) of 4×4×4 mm were located: the VOI between the implants was labelled VOI1, the VOI on the extension line of the two implants was labelled VOI2, and the VOI on the side-of the extension line was labelled VOI3 (Figure 3). All VOIs lay 2 to 6 mm deep from the implants’ platform along the axis of the implants. The VOIs were cropped for further processing. Before thresholding, a median filter with radius one was applied to reduce noise. Then, the VOIs were converted to binary images using an automated moments-based thresholding method.28–30 Erode and dilate functions were applied to the binary VOIs in ImageJ to further reduce the effect of noise. With the BoneJ plugin in ImageJ software, six trabecular microstructural parameters were measured: trabecular thickness (TbTh), trabecular separation (TbSp), bone volume per total volume (BV/TV), bone surface per total volume (BS/TV), connectivity density (CD) and fractal dimension (FD).31 Figure 4 shows representative images before and after processing.
Figure 3.
Schematic diagram for the VOI location, axial and sagittal perspectives. VOI, volume of interest; A, anterior; P, posterior; R, right; L, left.
Figure 4.
Representative axial reconstructions before and after image processing. All images have 4×4 mm dimension. Scale bar : 1 mm in length
Statistical analysis
The six microstructural parameters for each VOI measured in CBCT were compared with the parameters of the micro-CT using Spearman correlation analysis with 95% CI. Differences between correlation coefficients according to the varying alpha angles were tested by Steiger’s Z test with Bonferroni correction.32
Results
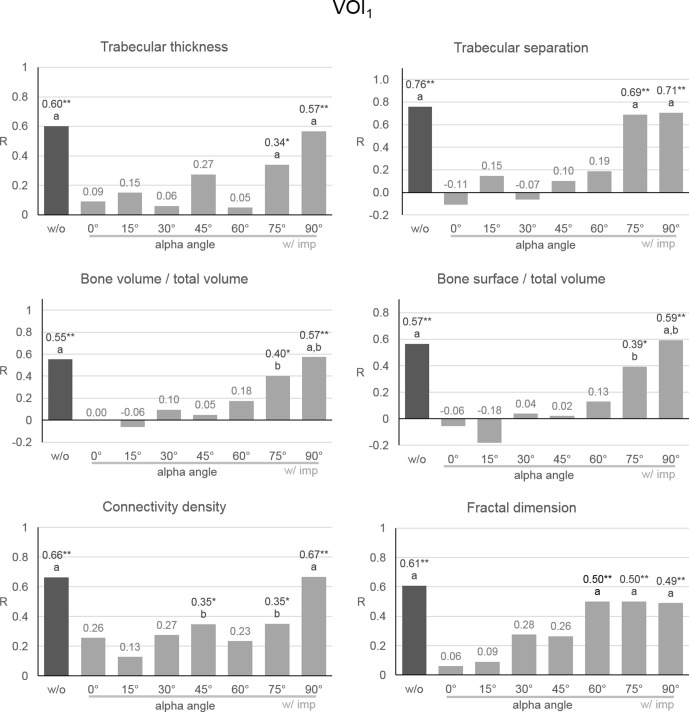
For VOI1,Spearman correlation coefficients for CBCT and micro-CT images without implants were 0.599, 0.76, 0.552, 0.566, 0.664, and 0.607 for TbTh, TbSp, BV/TV, BS/TV, CD and FD, respectively (p < 0.001) (Figure 5). With implants at the zero alpha angle, the correlation coefficients decreased to 0.09, -0.11, -0.004, -0.055, 0.256 and 0.062, respectively (p > 0.05). According to the increase in alpha angle from zero to 90°, the correlation coefficient increased. At 75° alpha angle, all six correlation coefficients became significant again and approached to those of the group without implants. In addition to the correlation coefficients, the microstructural parameters themselves approached the values of the group without implants as the alpha angle increased from zero to 90° (data not shown).
Figure 5.
Spearman correlation coefficient of microstructural parameters of CBCT and micro-CT in VOI1. R, Spearman correlation coefficient; different letters represent significant difference; **, p < 0.001 for the correlation coefficient; *, p < 0.05 for the correlation coefficient; w/o, without implants; w/ imp, with implants;
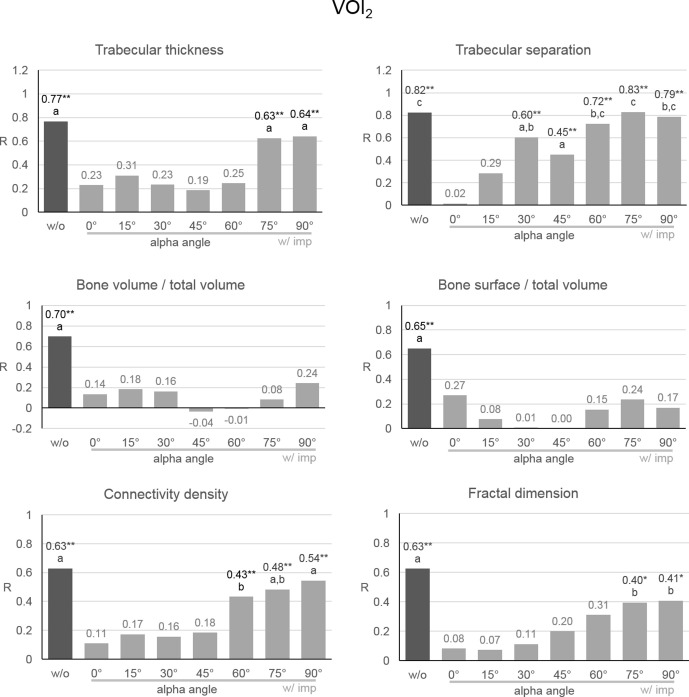
For VOI2, the Spearman correlation coefficients of the CBCT images without implants for micro-CT were 0.767, 0.823, 0.696, 0.651, 0.628 and 0.625 for TbTh, TbSp, BV/TV, BS/TV, CD and FD, respectively (p < 0.001) (Figure 6). With implants at the zero alpha angle, the correlation coefficients decreased to 0.229, 0.015, 0.135, 0.271, 0.11 and 0.082, respectively (p > 0.05). According to the increase in alpha angle from zero to 90°, the correlation coefficient increased. The correlation coefficients of TbTh, CD, and FD were significant after 75°, as in VOI1, while the coefficient of TbSp was significant from 30 to 90°. With implants, the correlation coefficients of BV/TV and BS/TV were not significant regardless of alpha angle.
Figure 6.
Spearman correlation coefficient of microstructural parameters of CBCT and micro-CT in VOI2. R, Spearman correlation coefficient; different letters represent significant difference; **, p < 0.001 for the correlation coefficient; *, p < 0.05 for the correlation coefficient; w/o, without implants; w/ imp, with implants;
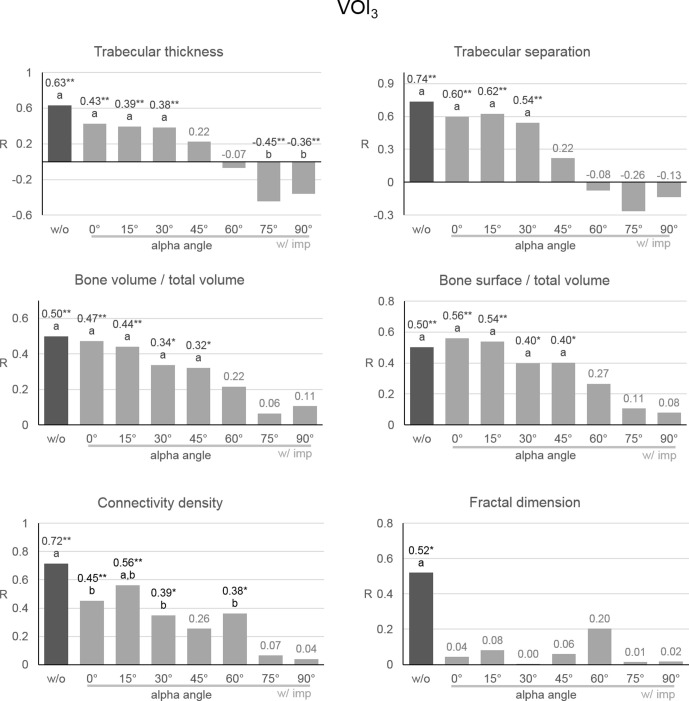
For VOI3, the Spearman correlation coefficients of the CBCT images without implants for micro-CT were 0.63, 0.736, 0.498, 0.502, 0.716 and 0.52 for TbTh, TbSp, BV/TV, BS/TV, CD and FD, respectively (p < 0.001) (Figure 7). In contrast to the other VOIs, no significant change in the correlation coefficient was observed with implant at zero alpha angle. As the alpha angle increased, the correlation coefficients gradually decreased. The correlation coefficients lost their significance beyond a certain alpha angle.
Figure 7.
Spearman correlation coefficient of microstructural parameters of CBCT and micro-CT in VOI3. R, Spearman correlation coefficient; different letters represent significant difference; **, p < 0.001 for the correlation coefficient; *, p < 0.05 for the correlation coefficient; w/o, without implants; w/ imp, with implants;
Discussion
Microstructural parameters can describe the comparative quality of different trabecular bones when scans are conducted under the same imaging conditions.20,22,24–27,33 On the other hand, microstructural parameters can describe the comparative quality of CBCT images when scans of the same trabecular bone are conducted under different imaging conditions. In fact, the measurement of the parameters depended on factors that affect the CBCT image quality, such as exposure condition, voxel size and FOV size.20,23,30,34 However, a greater microstructural parameter does not necessarily indicate high image quality and vice versa. Accordingly, rather than use the microstructural parameters themselves, the correlation coefficients between the parameters of the CBCT and of the micro-CT were used to measure the CBCT image quality. Due to the superior spatial resolution, micro-CT has been considered as a gold standard for evaluation of trabecular bone structure.35,36 The larger correlation coefficient of a CBCT image, the more similar the CBCT image is to the micro-CT image. Therefore, it is reasonable to use the correlation coefficient of microstructural parameters as an indicator of the quality of a CBCT image.
Similar to other studies, in VOI1 without implants, the Spearman correlation coefficients for the six microstructural parameters were 0.55–0.76.20,23,24,29 After implant placement, the correlation coefficients for the six microstructural parameters showed a decrease, as in a previous study.22 The decrease in the correlation coefficients could be due to the deterioration of image quality as a result of metal artefacts in the CBCT image caused by the dental implants. According to the increment of the alpha angle from zero to 90°, the correlation coefficients gradually increased. This indicates that the image quality was recovered as alpha angle increased. This is consistent with previous studies that investigated the relationship between subject angle and metal artefacts.15,16 Therefore, the quantification of metal artefacts on peri-implant anatomical structures could be regarded as successful in terms of the microstructural parameters.
In VOI2, the correlation coefficients of TbTh, TbSp, CD and FD showed similar behaviour to those in VOI1. Among them, the correlation coefficient of TbSp was most sensitive to the increase in alpha angle. However, regardless of the alpha angle, the correlation coefficients of BV/TV and BS/TV were not significant. The different behaviour of these parameters could be due to the difference in the ability of each microstructural parameter to reflect the trabecular structure. In fact, even without implants, the correlation coefficients varied for each microstructural parameter. The variation of the parameters was greater when metal artefacts were present.
In VOI3 without implants, the correlation coefficients of all microstructural parameters except FD showed no significant difference to those with implants at zero alpha angle. This suggests that very few metal artefacts appeared in VOI3 at this angle. However, in contrast to the other VOIs, the correlation coefficients gradually decreased according to the increase of the alpha angle. Hence, the image quality was degraded as alpha angle increased in VOI3. For TbTh, large negative correlation coefficients were obtained at 75 and 90° alpha angle. Visual inspection of each CBCT image revealed that the image quality of groups with the negative correlation coefficients was extremely low due to the significant amount of metal artefacts.
In some studies, metal artefacts were quantified using the mean and standard deviation (SD) of gray values, signal-to-noise ratio (SNR), or contrast-to-noise ratio (CNR) within a region of interest (ROI).5,17–19 In other studies, metal artefacts were subjectively evaluated by experienced observers.10,37,38 The former provided simple measurements that are easy to compare, but these measurements do not represent the image quality nor reflect the trabecular structure shown in CBCT. Furthermore, mean and standard deviation are often inappropriate because gray values of the voxels affected by metal artefacts tend to show a non-normal distribution. In contrast, subjective evaluation could discover detailed features based on the judgement of an experienced expert. However, the result of subjective evaluation can be difficult to be generalised or compared with other studies. In the present study, the microstructural parameters were used to obtain both structural information and objective measurement.
Correlation coefficients of microstructural parameters, instead of these parameters themselves, were used to quantify the effect of metal artefacts. Difference in microstructural parameters according to the change of alpha angle were significant between almost all groups, while differences in some correlation coefficients were significant only after increasing to a 75° alpha angle (data not shown). In other words, the correlation coefficient was less sensitive to change in the alpha angle than the microstructural parameter. Therefore, it is appropriate to consider both the microstructural parameters and their correlation coefficients to evaluate the difference in image quality.
The use of polyurethane synthetic bone has some advantages. Because synthetic bone products representing a wide variety of trabecular morphologies and densities are available, synthetic bone can be used to simulate real bones with various trabecular structures. In fact, the correlation coefficients obtained in this study without implants were similar to those found in previous studies that used real bone.29,30 In addition, unlike the situation with cadaveric bone, a sufficiently large number of synthetic bone samples can be used to measure microstructural parameters. Ultimately, the use of synthetic bone may result in higher significance in the statistical analysis.
However, polyurethane has much lower attenuation than the calcium hydroxyapatite of real bone. Due to this low attenuation, the voxels of polyurethane are vulnerable to the effects of metal artefact and noise. Huang et al, reported that the correlation coefficients with implants were lower than those without implants.22 In their study, the difference between the coefficients with and without implants was much smaller than that in the current study. This discrepancy seems to be a result of the difference in attenuation between polyurethane and calcium hydroxyapatite.
There is a discrepancy between the clinical environment and the experimental environment used in this study. Only a small volume of bone that included two implants was simulated, while other craniofacial bones and soft tissues were not. Due to lower attenuation, scatter and the beam hardening effect, this might have resulted in higher image quality than would have been obtained in a clinical environment. We also used a small size of FOV, relative to the size of the FOV frequently used in clinical practice. In our tests, the specimen was located at the CBCT’s centre of FOV. Finally, unlike an image that would result from clinical practice, there was no subject movement reflected in our images. These factors all contributed to higher correlation coefficients than would be found in a clinical environment. Further research will be required to determine whether this method is effective for evaluating CBCT image quality in a clinical scanning environment. Nevertheless, the results of this study are meaningful, as the quantification method was effective in a controlled experimental environment.
Spearman’s rank correlation analysis was used instead of Pearson’s because the microstructural parameters of a few experimental groups showed non-normal distribution. The result of Spearman analysis does not represent a linear relationship. However, Spearman analysis is useful in showing the relationship between two variables in a situation where the relationship between them is not precisely known and the variables demonstrate a non-normal distribution.
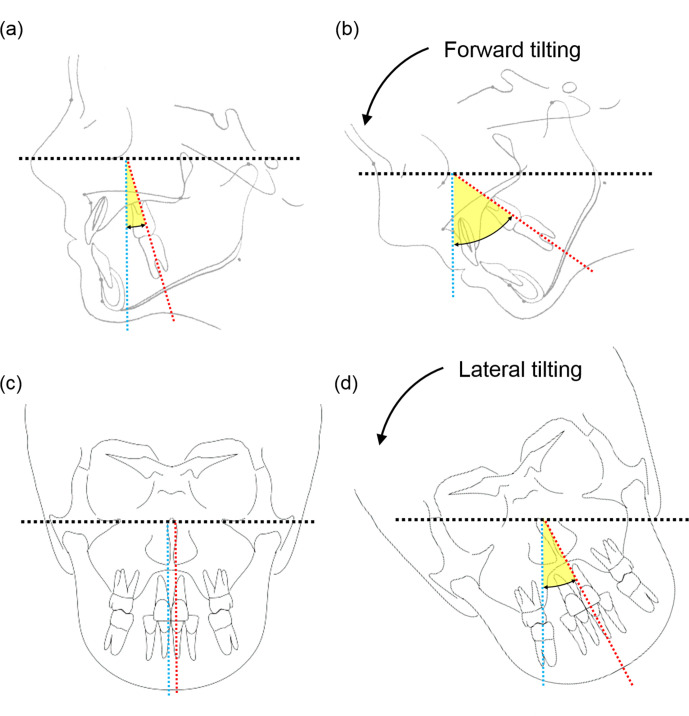
Subject rotation could help diagnose diseases near implants. When the alpha angle was greater than 75°, very few metal artefacts appeared in VOI1 and VOI2. Usually, molar teeth and molar implants have intrinsically positive alpha angles of 12 to 22° when the Frankfort horizontal plane of the patient is parallel to the floor.39 In addition, the mean range of neck motion in flexion is approximately 60 to 70°.40,41 Thus, in a clinical environment, metal artefacts could be minimised at the areas corresponding to VOI1 and VOI2 by increasing the alpha angle through forward head-tilting (Figure 8). This would be useful in diagnosing mesial and distal alveolar bone near implants. On the other hands, backward head-tilting to make a zero alpha angle is advantageous at the area corresponding to VOI3 because there were few metal artefacts at the zero alpha angle. This area is equivalent to the buccal and lingual alveolar bone of molar implants. Hence, the direction of head-tilting should be considered according to the area to be investigated relative to the implants.
Figure 8.
Schematic drawings of the effect of head-tilting on the posterior and anterior teeth. Black, blue and red dashed lines represent the source-detector plane, a vertical axis perpendicular to source detector plane, and the longitudinal axes of corresponding teeth, respectively. Yellow fans represent alpha angle of teeth. (a) and b), forward head-tilting increases alpha angle for upper and lower molar teeth. (c) and d), lateral head-tilting increases alpha angle for anterior teeth.
Forward tilting requires less head tilting than backward tilting to reach the same alpha angle. But forward head-tilting may result in poorer image quality and increased radiation exposure to neck organs, including the cervical spine, oesophagus and pharynx. The disadvantages of tilting in each direction should be considered.
The effect of subject rotation differs according to the location of implants within the dental arch. In order to adjust the alpha angle of two implants placed at the incisor area, patients should tilt their head to left or right, rather than forward or backward (Figure 8). Therefore, the location of implants should also be considered in determining the direction of head-tilting.
However, commercially available scanners are designed to fix the head in a specific position using a chin rest, ear-rods and head strap. As a result, head-tilting in current scanners may be limited due to control over head positioning and the absence of manoeuvrable space in the scanner itself.
Footnotes
Acknowledgment: This paper was supported by Fund of Biomedical Research Institute, Jeonbuk National University Hospital.
Contributor Information
Chang-Ki Min, Email: fortunteller@jbnu.ac.kr.
Kyoung-A Kim, Email: beam@jbnu.ac.kr.
REFERENCES
- 1.Schulze R, Heil U, Gross D, Bruellmann DD, Dranischnikow E, Schwanecke U, et al. Artefacts in CBCT: a review. Dentomaxillofac Radiol 2011; 40: 265–73. doi: 10.1259/dmfr/30642039 [DOI] [PMC free article] [PubMed] [Google Scholar]
- 2.Katsumata A, Hirukawa A, Noujeim M, Okumura S, Naitoh M, Fujishita M, et al. Image artifact in dental cone-beam CT. Oral Surg Oral Med Oral Pathol Oral Radiol Endod 2006; 101: 652–7. doi: 10.1016/j.tripleo.2005.07.027 [DOI] [PubMed] [Google Scholar]
- 3.Schulze RKW, Berndt D, d'Hoedt B. On cone-beam computed tomography artifacts induced by titanium implants. Clin Oral Implants Res 2010; 21: 100–7. doi: 10.1111/j.1600-0501.2009.01817.x [DOI] [PubMed] [Google Scholar]
- 4.Makins SR. Artifacts interfering with interpretation of cone beam computed tomography images. Dent Clin North Am 2014; 58: 485–95. doi: 10.1016/j.cden.2014.04.007 [DOI] [PubMed] [Google Scholar]
- 5.Parsa A, Ibrahim N, Hassan B, Syriopoulos K, van der Stelt P. Assessment of metal artefact reduction around dental titanium implants in cone beam CT. Dentomaxillofac Radiol 2014; 43: 20140019. doi: 10.1259/dmfr.20140019 [DOI] [PMC free article] [PubMed] [Google Scholar]
- 6.Waggener RG, Levy LB, Rogers LF, Zanca P. Measured X-ray spectra from 25 to 110 kVp for a typical diagnostic unit. Radiology 1972; 105: 169–75. doi: 10.1148/105.1.169 [DOI] [PubMed] [Google Scholar]
- 7.Altunbas MC, Shaw CC, Chen L, Lai C, Liu X, Han T, et al. A post-reconstruction method to correct cupping artifacts in cone beam breast computed tomography. Med Phys 2007; 34: 3109–18. doi: 10.1118/1.2748106 [DOI] [PMC free article] [PubMed] [Google Scholar]
- 8.Zhang Y, Zhang L, Zhu XR, Lee AK, Chambers M, Dong L. Reducing metal artifacts in cone-beam CT images by preprocessing projection data. Int J Radiat Oncol Biol Phys 2007; 67: 924–32. doi: 10.1016/j.ijrobp.2006.09.045 [DOI] [PubMed] [Google Scholar]
- 9.Prell D, Kyriakou Y, Beister M, Kalender WA. A novel forward projection-based metal artifact reduction method for flat-detector computed tomography. Phys Med Biol 2009; 54: 6575–91. doi: 10.1088/0031-9155/54/21/009 [DOI] [PubMed] [Google Scholar]
- 10.de-Azevedo-Vaz SL, Peyneau PD, Ramirez-Sotelo LR, Vasconcelos KdeF, Campos PSF, Haiter-Neto F. Efficacy of a cone beam computed tomography metal artifact reduction algorithm for the detection of peri-implant fenestrations and dehiscences. Oral Surg Oral Med Oral Pathol Oral Radiol 2016; 121: 550–6. doi: 10.1016/j.oooo.2016.01.013 [DOI] [PubMed] [Google Scholar]
- 11.Iramina H, Hamaguchi T, Nakamura M, Mizowaki T, Kanno I. Metal artifact reduction by filter-based dual-energy cone-beam computed tomography on a bench-top micro-CBCT system: concept and demonstration. J Radiat Res 2018; 59: 511–20. doi: 10.1093/jrr/rry034 [DOI] [PMC free article] [PubMed] [Google Scholar]
- 12.Schriber M, Yeung AWK, Suter VGA, Buser D, Leung YY, Bornstein MM. Cone beam computed tomography artefacts around dental implants with different materials influencing the detection of peri-implant bone defects. Clin Oral Implants Res 2020; 31: 595–606. doi: 10.1111/clr.13596 [DOI] [PubMed] [Google Scholar]
- 13.Brown JH, Lustrin ES, Lev MH, Ogilvy CS, Taveras JM. Reduction of aneurysm clip artifacts on CT angiograms: a technical note. AJNR Am J Neuroradiol 1999; 20: 694–6. [PMC free article] [PubMed] [Google Scholar]
- 14.Lewis M, Toms AP, Reid K, Bugg W. Ct metal artefact reduction of total knee prostheses using angled gantry multiplanar reformation. Knee 2010; 17: 279–82. doi: 10.1016/j.knee.2010.02.007 [DOI] [PubMed] [Google Scholar]
- 15.Luckow M, Deyhle H, Beckmann F, Dagassan-Berndt D, Müller B. Tilting the jaw to improve the image quality or to reduce the dose in cone-beam computed tomography. Eur J Radiol 2011; 80: e389–93. doi: 10.1016/j.ejrad.2010.10.001 [DOI] [PubMed] [Google Scholar]
- 16.Min C-K, Kim K-A. Reducing metal artifacts between implants in cone-beam CT by adjusting angular position of the subject. Oral Radiol 2020;07 Jul 2020[Epub ahead of print]. doi: 10.1007/s11282-020-00458-7 [DOI] [PubMed] [Google Scholar]
- 17.Benic GI, Sancho-Puchades M, Jung RE, Deyhle H, Hämmerle CHF. In vitro assessment of artifacts induced by titanium dental implants in cone beam computed tomography. Clin Oral Implants Res 2013; 24: 378–83. doi: 10.1111/clr.12048 [DOI] [PubMed] [Google Scholar]
- 18.Pauwels R, Stamatakis H, Bosmans H, Bogaerts R, Jacobs R, Horner K, et al. Quantification of metal artifacts on cone beam computed tomography images. Clin Oral Implants Res 2013; 24 Suppl A100(A100): 94–9. doi: 10.1111/j.1600-0501.2011.02382.x [DOI] [PubMed] [Google Scholar]
- 19.Bechara BB, Moore WS, McMahan CA, Noujeim M. Metal artefact reduction with cone beam CT: an in vitro study. Dentomaxillofac Radiol 2012; 41: 248–53. doi: 10.1259/dmfr/80899839 [DOI] [PMC free article] [PubMed] [Google Scholar]
- 20.Van Dessel J, Huang Y, Depypere M, Rubira-Bullen I, Maes F, Jacobs R. A comparative evaluation of cone beam CT and micro-CT on trabecular bone structures in the human mandible. Dentomaxillofac Radiol 2013; 42: 20130145. doi: 10.1259/dmfr.20130145 [DOI] [PMC free article] [PubMed] [Google Scholar]
- 21.Ho J-T, Wu J, Huang H-L, Chen MYc, Fuh L-J, Hsu J-T. Trabecular bone structural parameters evaluated using dental cone-beam computed tomography: cellular synthetic bones. Biomed Eng Online 2013; 12: 115. doi: 10.1186/1475-925X-12-115 [DOI] [PMC free article] [PubMed] [Google Scholar]
- 22.Huang Y, Dessel JV, Depypere M, EzEldeen M, Iliescu AA, Santos ED, et al. Validating cone-beam computed tomography for peri-implant bone morphometric analysis. Bone Res 2014; 2: 14010. doi: 10.1038/boneres.2014.10 [DOI] [PMC free article] [PubMed] [Google Scholar]
- 23.Klintström E, Smedby O, Klintström B, Brismar TB, Moreno R. Trabecular bone histomorphometric measurements and contrast-to-noise ratio in CBCT. Dentomaxillofac Radiol 2014; 43: 20140196. doi: 10.1259/dmfr.20140196 [DOI] [PMC free article] [PubMed] [Google Scholar]
- 24.Kim J-E, Yi W-J, Heo M-S, Lee S-S, Choi S-C, Huh K-H. Three-Dimensional evaluation of human jaw bone microarchitecture: correlation between the microarchitectural parameters of cone beam computed tomography and micro-computer tomography. Oral Surg Oral Med Oral Pathol Oral Radiol 2015; 120: 762–70. doi: 10.1016/j.oooo.2015.08.022 [DOI] [PubMed] [Google Scholar]
- 25.Kulah K, Gulsahi A, Kamburoğlu K, Geneci F, Ocak M, Celik HH, et al. Evaluation of maxillary trabecular microstructure as an indicator of implant stability by using 2 cone beam computed tomography systems and micro-computed tomography. Oral Surg Oral Med Oral Pathol Oral Radiol 2019; 127: 247–56. doi: 10.1016/j.oooo.2018.11.014 [DOI] [PubMed] [Google Scholar]
- 26.Ibrahim N, Parsa A, Hassan B, van der Stelt P, Aartman IHA, Wismeijer D. Accuracy of trabecular bone microstructural measurement at planned dental implant sites using cone-beam CT datasets. Clin Oral Implants Res 2014; 25: 941–5. doi: 10.1111/clr.12163 [DOI] [PubMed] [Google Scholar]
- 27.Kivovics M, Szabó BT, Németh O, Iványi D, Trimmel B, Szmirnova I, et al. Comparison between Micro-Computed tomography and cone-beam computed tomography in the assessment of bone quality and a long-term volumetric study of the augmented sinus grafted with an albumin impregnated allograft. J Clin Med 2020; 9: 303. doi: 10.3390/jcm9020303 [DOI] [PMC free article] [PubMed] [Google Scholar]
- 28.Tsai W-H. Moment-preserving thresolding: a new approach. Computer Vision, Graphics, and Image Processing 1985; 29: 377–93. doi: 10.1016/0734-189X(85)90133-1 [DOI] [Google Scholar]
- 29.Panmekiate S, Ngonphloy N, Charoenkarn T, Faruangsaeng T, Pauwels R. Comparison of mandibular bone microarchitecture between micro-CT and CBCT images. Dentomaxillofac Radiol 2015; 44: 20140322. doi: 10.1259/dmfr.20140322 [DOI] [PMC free article] [PubMed] [Google Scholar]
- 30.Pauwels R, Faruangsaeng T, Charoenkarn T, Ngonphloy N, Panmekiate S. Effect of exposure parameters and voxel size on bone structure analysis in CBCT. Dentomaxillofac Radiol 2015; 44: 20150078. doi: 10.1259/dmfr.20150078 [DOI] [PMC free article] [PubMed] [Google Scholar]
- 31.Doube M, Kłosowski MM, Arganda-Carreras I, Cordelières FP, Dougherty RP, Jackson JS, et al. BoneJ: free and extensible bone image analysis in ImageJ. Bone 2010; 47: 1076–9. doi: 10.1016/j.bone.2010.08.023 [DOI] [PMC free article] [PubMed] [Google Scholar]
- 32.Steiger JH. Tests for comparing elements of a correlation matrix. Psychol Bull 1980; 87: 245–51. doi: 10.1037/0033-2909.87.2.245 [DOI] [Google Scholar]
- 33.Liang X, Zhang Z, Gu J, Wang Z, Vandenberghe B, Jacobs R, et al. Comparison of micro-CT and cone beam CT on the feasibility of assessing trabecular structures in mandibular condyle. Dentomaxillofac Radiol 2017; 46: 20160435. doi: 10.1259/dmfr.20160435 [DOI] [PMC free article] [PubMed] [Google Scholar]
- 34.Ibrahim N, Parsa A, Hassan B, van der Stelt P, Aartman IHA, Nambiar P. Influence of object location in different FOVs on trabecular bone microstructure measurements of human mandible: a cone beam CT study. Dentomaxillofac Radiol 2014; 43: 20130329. doi: 10.1259/dmfr.20130329 [DOI] [PMC free article] [PubMed] [Google Scholar]
- 35.Müller R, Van Campenhout H, Van Damme B, Van Der Perre G, Dequeker J, Hildebrand T, et al. Morphometric analysis of human bone biopsies: a quantitative structural comparison of histological sections and micro-computed tomography. Bone 1998; 23: 59–66. doi: 10.1016/S8756-3282(98)00068-4 [DOI] [PubMed] [Google Scholar]
- 36.González-García R, Monje F. Is micro-computed tomography reliable to determine the microstructure of the maxillary alveolar bone? Clin Oral Implants Res 2013; 24: 730–7. doi: 10.1111/j.1600-0501.2012.02478.x [DOI] [PubMed] [Google Scholar]
- 37.Iikubo M, Osano T, Sano T, Katsumata A, Ariji E, Kobayashi K, et al. Root canal filling materials spread pattern mimicking root fractures in dental CBCT images. Oral Surg Oral Med Oral Pathol Oral Radiol 2015; 120: 521–7. doi: 10.1016/j.oooo.2015.06.030 [DOI] [PubMed] [Google Scholar]
- 38.Rabelo KA, Cavalcanti YW, de Oliveira Pinto MG, Sousa Melo SL, Campos PSF, de Andrade Freitas Oliveira LS, et al. Quantitative assessment of image artifacts from root filling materials on CBCT scans made using several exposure parameters. Imaging Sci Dent 2017; 47: 189–97. doi: 10.5624/isd.2017.47.3.189 [DOI] [PMC free article] [PubMed] [Google Scholar]
- 39.Jo SY, Bayome M, Park J, Lim HJ, Kook Y-A, Han SH. Comparison of treatment effects between four premolar extraction and total arch distalization using the modified C-palatal plate. Korean J Orthod 2018; 48: 224–35. doi: 10.4041/kjod.2018.48.4.224 [DOI] [PMC free article] [PubMed] [Google Scholar]
- 40.Lind B, Sihlbom H, Nordwall A, Malchau H. Normal range of motion of the cervical spine. Arch Phys Med Rehab 1989; 70: 692–5. [PubMed] [Google Scholar]
- 41.Chiu TTW, Sing KL. Evaluation of cervical range of motion and isometric neck muscle strength: reliability and validity. Clin Rehabil 2002; 16: 851–8. doi: 10.1191/0269215502cr550oa [DOI] [PubMed] [Google Scholar]


