

Abstract
Purpose:
Ovarian cancer has one of the highest deaths to incidence ratios across all cancers. Initial chemotherapy is effective, but most patients develop chemo-resistant disease. Mechanisms driving clinical chemo-response or -resistance are not well understood. However, achieving optimal surgical cytoreduction improves survival, and cytoreduction is improved by neoadjuvant chemotherapy (NACT). NACT offers a window to profile pre- versus post-NACT tumors, which we used to identify chemotherapy-induced changes to the tumor microenvironment.
Experimental Design:
We obtained matched pre- and post-NACT archival tumor tissues from patients with high-grade serous ovarian cancer (patient n=6). We measured mRNA levels of 770 genes (756 genes/14 housekeeping genes) (NanoString), and performed reverse phase protein array on a subset of matched tumors. We examined cytokine levels in pre-NACT ascites samples (n=39) by enzyme-linked immunosorbent assays. A tissue microarray with 128 annotated ovarian tumors expanded the transcriptional, reverse phase protein array (RPPA), and cytokine data by multi-spectral immunohistochemistry.
Results:
The most upregulated gene post-NACT was IL6 (16.79-fold). RPPA data were concordant with mRNA, consistent with elevated immune infiltration. Elevated IL-6 in pre-NACT ascites specimens correlated with a shorter time to recurrence. Integrating NanoString (n=12), RPPA (n=4), and cytokine (n=39) studies identified an activated inflammatory signaling network and induced IL6 and IER3 (Immediate Early Response 3) post-NACT, associated with poor chemo-response and time to recurrence.
Conclusions:
Multi-omic profiling of ovarian tumor samples pre- and post-NACT provides unique insight into chemo-induced changes to the tumor microenvironment. We identified a novel IL-6/IER3 signaling axis that may drive chemo-resistance and disease recurrence.
INTRODUCTION
High grade serous ovarian carcinoma (HGSOC) accounts for nearly 75% of all ovarian cancers and is the deadliest histotype, driven by the propensity of disease recurrence and therapy resistance (1). Most patients are treated by cytoreductive surgery and combination platinum/taxane-based chemotherapy. The understanding of clinical chemo-resistance in HGSOC is limited, as access to treated tumor tissue after the initial cytoreductive surgery and subsequent chemotherapy is uncommon. This lack of access to treated tumor hinders the ability to define how tumors respond and adapt to therapy, and to identify predictors and drivers of disease progression.
Though the mechanistic understanding of chemo-response is limited, successful surgical removal of tumor remains one of the best predictors of survival. Based on this, patients with HGSOC undergo a diagnostic laparoscopy to determine the extent of disease burden and likelihood for optimal cytoreduction (2, 3). Unresectable disease is associated with poor patient outcomes; however, tumor resectability is improved by the use of neoadjuvant chemotherapy (NACT) with interval cytoreduction. NACT consists of three cycles of carboplatin/paclitaxel, then an interval surgical cytoreduction of remaining disease, followed by another three carboplatin/paclitaxel cycles. NACT improves rates of optimal surgical cytoreduction in patients with advanced disease (4–6). Importantly, the carboplatin/paclitaxel chemotherapies used in NACT remain the standard upfront care for adjuvant therapy. The NACT paradigm provides access to the tumor site before and after chemotherapy, which presents an opportunity to investigate the mechanisms of tumor response to chemotherapy.
Studies of HGSOC tumor response to NACT are emerging, and have identified that immune/inflammatory signaling plays a significant role in chemo-response and –resistance. Böhm and colleagues reported that following NACT, an increase in tumor infiltration of immunosuppressive T regulatory cells and elevated T cell expression of checkpoint receptors correlate to a poorer prognosis (7). Lo and colleagues reported a similar finding: while chemotherapy promotes an immune response, this immune response does not circumvent an established immunosuppressive microenvironment (8). Beyond NACT, the cytokine IL-6 significantly contributes to the immunosuppressive microenvironment, and is associated with disease progression and chemotherapy response (9–13). These observations suggest a key role for cytokines in modulating tumor response to chemotherapy. Greater mechanistic understanding of the tumor immune microenvironment may allow us to overcome chemo-resistance and improve patient outcomes.
We hypothesized that integrating multiple profiling methods of both the tumor and tumor microenvironment pre- and post-NACT would identify predictors and drivers of chemotherapy response. To address this, we identified a series of matched archival tumor samples pre- and post-NACT from 6 patients with HGSOC. Using these samples, we defined the transcriptomic effects of NACT using the Nanostring PanCancer Immuno-Oncology 360 panel. We then identified signaling events linked to these NACT-driven transcriptomic changes by using reverse phase protein array (RPPA) analyses. We examined the cytokine milieu in pre-treatment ascites from 39 patients. Integrating these multi-omic analyses via network analysis and comparing data against different platforms we identified an immune microenvironment signaling pathway associated with decreased time to recurrence. These data suggest that the magnitude of chemotherapy-induced remodeling of the tumor microenvironment provides a unique predictor of recurrence and that multi-omic profiling of pre- and post-NACT tumors is a powerful tool for understanding HGSOC.
MATERIALS AND METHODS
Gynecologic Tumor and Fluid Bank (GTFB).
Patients in this study were consented under the GTFB protocol at the University of Colorado (Colorado Medical Institutional Review Board [COMIRB] #07-935). The protocol was approved and conducted in accordance with the University of Colorado ethical policy. All patients signed a written consent prior to enrollment. Specimens were de-identified and processed into formalin-fixed paraffin embedded (FFPE) blocks. Tumors were also flash-frozen and stored at −80°C. Ascites was centrifuged at 200 x g for 7 min and the fluid and cellular components stored at −80°C.
Multiplex enzyme-linked immunosorbent assay.
The concentration of cytokines/chemokines was assessed using the V-PLEX Pro-inflammatory Panel 1 kit (Meso Scale Discovery). Ascites fluid was diluted 2-fold in Diluent 2, incubated for 2 h while shaking (600 rpm) at room temperature (RT), then incubated for 2 h with detection antibody in Diluent 3 while shaking (600 rpm) at RT. The plates were washed using an automated plate washer (Biotek Instruments). Electrochemiluminescence values were read on the Meso QuickPlex SQ 120 (Meso Scale Discovery). Sample concentrations were extrapolated using the standard curve of diluted calibrators.
RNA Extraction.
FFPE tissue blocks were acquired (COMIRB#18-0119) and a board-certified pathologist to confirmed tumor tissue (Supplemental Table 1). This protocol is deemed exempt, as it is using previously collected data, and the information is not recorded in a manner that is identifiable. FFPE tissue blocks were sectioned into 10 micron tissue-containing paraffin scrolls. RNA was extracted using the High Pure FFPET RNA Isolation kit (Roche). RNA quantity and quality was assessed using a RNA Screentape on a TapeStation 4150 (Agilent). RNA concentration was determined by comparison to the RNA ladder and the percentage of RNA fragments greater than 200 bp was calculated (average 70.6%, all samples > 55%).
NanoString PanCancer Immuno-Oncology (IO) 360.
150 ng of RNA was combined with hybridization buffer and the Reporter CodeSet for the PanCancer IO 360 Panel (Nanostring) and incubated for 20 h at 65°C. The hybridized reaction was analyzed on an nCounter SPRINT Profiler (Nanostring). nSolver calculated normalization factors for each sample using raw gene counts and 14 housekeeping genes (Supplemental Table 2). Differential gene expression was calculated from normalized gene counts data and a false discovery rate with a Benjamini Hochberg multi-comparison test. The average count for the negative control probes was used for thresholding “positive” genes. After thresholding (<20 counts), a total of 666 genes were subsequently used for downstream analysis. The heatmap was generated using Clustergrammer (14). Raw gene counts are normalized using the logCPM method, filtered by selecting the genes with most variable expression, and transformed using the Z-score method.
nSolver advanced analysis tool was used to generate a pathway score for 25 different pathways (e.g., Hypoxia). The pathways scores were grouped and compared based on pre- versus post-NACT. Genetic signature analysis was performed by Nanostring and described in (15–19). The log2-transformed gene expression values are multiplied by pre-defined weighted coefficient (16) and the sum of these values within each geneset is defined as the signature score.
Reverse Phase Protein Array (RPPA).
Fresh snap-frozen tumor tissue was processed and analyzed by MD Anderson Functional Proteomics RPPA Core facility (20). The RPPA (set167) included 449 antibodies, which were analyzed by Array-Pro Analyzer 6.3 then by SuperCurve 1.5.0 via SuperCurveGUI 2.1.1. The data were normalized based on the median and centered based on the medians normalized to Log2 intensities.
Transcriptional Factor Analysis.
With the genes (n=18) that had a significant correlation to time to recurrence, we utilized PathwayNet Analysis to predict transcription factor relationships (21). Of this n=18 query genes, n=5 had no associated transcription factors; the resulting 13 query genes had 371 associated transcription factors (TFs). From this bipartite network, we derived a weighted projection onto the 13 query genes such that two nodes in the projection are connected by an edge weighted by the number of associated TFs they have in common. Under this projection, all TFs that associated with only one query gene are effectively removed, and higher weight edges can be interpreted as more reliable associations. Each node was then annotated by its "strength", defined as the total weight of edges incident to it in the projection, i.e., the number of shared transcriptions factors with any other query gene. This operation produced a network with 13 nodes and 54 edges, accounting for 250 shared TFs.
Tissue microarray (TMA).
A described (22) TMA comprised of serous tumors (COMIRB #17-7788) was used. This protocol is deemed exempt, as it is using previously collected data, and the information is not recorded in a manner that is identifiable. The TMA consists of 109 primary tumors collected pre-chemotherapy, 19 primary collected post-chemotherapy, and 28 recurrent tumors. The time range of recurrence is 8 to 81 months.
Multi-spectral immunohistochemistry (IHC).
Multi-spectral IHC analyses were performed using Vectra Automated Quantitative Pathology Systems (Akoya Biosciences) as described (23). For figure 4C–H, the TMA slides were sequentially stained with antibodies specific for CD4 (T cells, 4B12, Leica Biosystems), CD8 (T cells, C8/144B, Agilent Technologies), FOXP3 (regulatory T cells, 236A/E7, Abcam), Granzyme B (effector T cells, GRB-7, Thermo Fisher Scientific), CD68 (macrophages, KP1, Agilent Technologies), and cytokeratin (tumor cells, AE1/AE3, Agilent Technologies). For figure 4I–J, the TMA slides were sequentially stained with antibodies specific for CD3 (T cells, LN10, Leica), CD19 (B cells, BT51E, Leica), IER3 (NBP1-76802, Novus Biologicals), Ki67 (SP6, Thermo Fisher Scientific), and CD8, CD68, and cytokeratin as above. Image analysis was performed using inForm software version 2.3 (Akoya), including tissue segmentation, cell segmentation, and phenotyping to assign each cell to a phenotypic category. The TMA slides were stained with IER3 antibody, imaged on the Vectra Polaris microscope (Akoya), and analyzed with inForm software version 2.8 (Akoya) using a 4-bin algorithm to calculate histologic scores (H-scores).
cBio Portal Cancer Cell Line Encyclopedia and Gene Expression Omnibus.
Cancer Cell Line Encyclopedia data (Broad 2019 dataset update, (24)) were downloaded from the cBio portal in May 2020. Ovarian cancer cell lines were selected from the “ovarian” tumor type category; variable n’s in the indicated subsets in Figure 3E–F represent mixed availability of expression and drug response data available per cell line. IL6/IER3 high versus low expression was defined by a combined z-score cutoff of 2. GSE117765 (25) of olaparib sensitive and resistant cells used to assess transcript counts of IL6 and IER3.
Cell Culture.
OVCAR4 (CVCL_1627) and OVCAR8 (CVCL_1629) cell lines were authenticated using small tandem repeat (STR) analysis (The University of Arizona Genetics Core) and tested for mycoplasma (MycoLookOut, Sigma). Cells were obtained from the GTFB. Mycoplasma testing was last performed on May 28th 2020. Cells were cultured up to 20 passages in RMPI1640 (Gibco) medium supplemented with 1% penicillin-streptomycin and 10% fetal bovine serum (Access) and maintained in 5% CO2 at 37 °C.
Small interfering RNA (siRNA) knockdown.
Cells were transfected using Lipofectamine RNAiMAX Reagent (Invitrogen #13778-075) according to the manufacturer’s protocol. The siRNA used were siIER3 (Ambion Silencer Select #4392421, ID s16941) or Negative Control siRNA (Ambion #AM4613).
Cisplatin Dose Response.
Cisplatin was purchased from SelleckChem and resuspended in 0.9 % sodium chloride/ddH2O. Cells were plated in 96-well plates in cisplatin (100 nmol/L, 1 μmol/L, 10 μmol/L, or 50 μmol/L). Cells imaged for 72 h on an IncuCyte S3 live cell imaging system. Cell confluence was analyzed using IncuCyte software GUI version 2019B Rev2.
Quantitative reverse transcription polymerase chain reaction (RT-qPCR).
As described (25). The Luna Universal One-step RT-qPCR kit (New England BioLabs) was used on a BioRad CFX96 thermocycler. Primers for IER3 (Fwd- AGCCGCAGGGTTCTCTA; Rev- GATGGTGAGCAGCAGAAAGA); GAPDH as an internal control (Fwd- GTCTCCTCTGACTTCAACAGCG; Rev – ACCACCCTGTTGCTGTAGCCAA).
Statistics.
Statistical analysis was performed in GraphPad Prism (v8). Two-tailed student t-test or ANOVA were utilized to calculate a p-value. An adjusted p-value of less than 0.20 was considered significant. Paired or unpaired t-test used based on context and noted in figure legend. All quantitative data are graphed as mean with standard error mean (SEM). Hazard ratio calculated with Mantel Haenszel test. The power analysis is based on the two-sample independent t-tests adjusting for the false discovery (FDR) at a 0.20 level. Assuming there are actually 10% of the biomarkers are truly differentially expressed, then minimum Cohen’s D effect size, in which the effect size (i.e. the fold change) is standardized by the pooled standard deviations, is calculated for sample size range from 6 to 20 patients (Supplemental Table 2).
RESULTS
Interrogation of chemotherapy-induced changes to the ovarian tumor transcriptome
Patients with advanced-stage HGSOC and extensive disease burden were treated with NACT, which provides a unique opportunity to investigate genetic and molecular change induced by carboplatin and paclitaxel (Figure 1A). Therefore, we examined the transcriptional profile of matched tumor samples from six patients pre- and post-NACT (total n=12). All six patients had extensive disease burden upon clinical presentation and were all treated with NACT with interval cytoreduction. These cases were selected for further analysis based on the availability of formalin-fixed paraffin-embedded (FFPE) blocks, snap-frozen tumor samples, and clinical information. The average time to disease recurrence was 243.5 days (range of 25 to 505 days); additional clinical attributes considered included genetic characteristics such as BRCA and homologous recombination (HR) status (Supplementary Figure 1A). During the interval debulking the number of tumor sites were quantified and ranged from 4-15 (Supplemental information). However, based on CA125 levels at the time of diagnosis, there was not a clear relationship between disease burden and time to recurrence (Supplemental Table 1).
Figure 1. Chemotherapy-induced transcriptional dynamics.
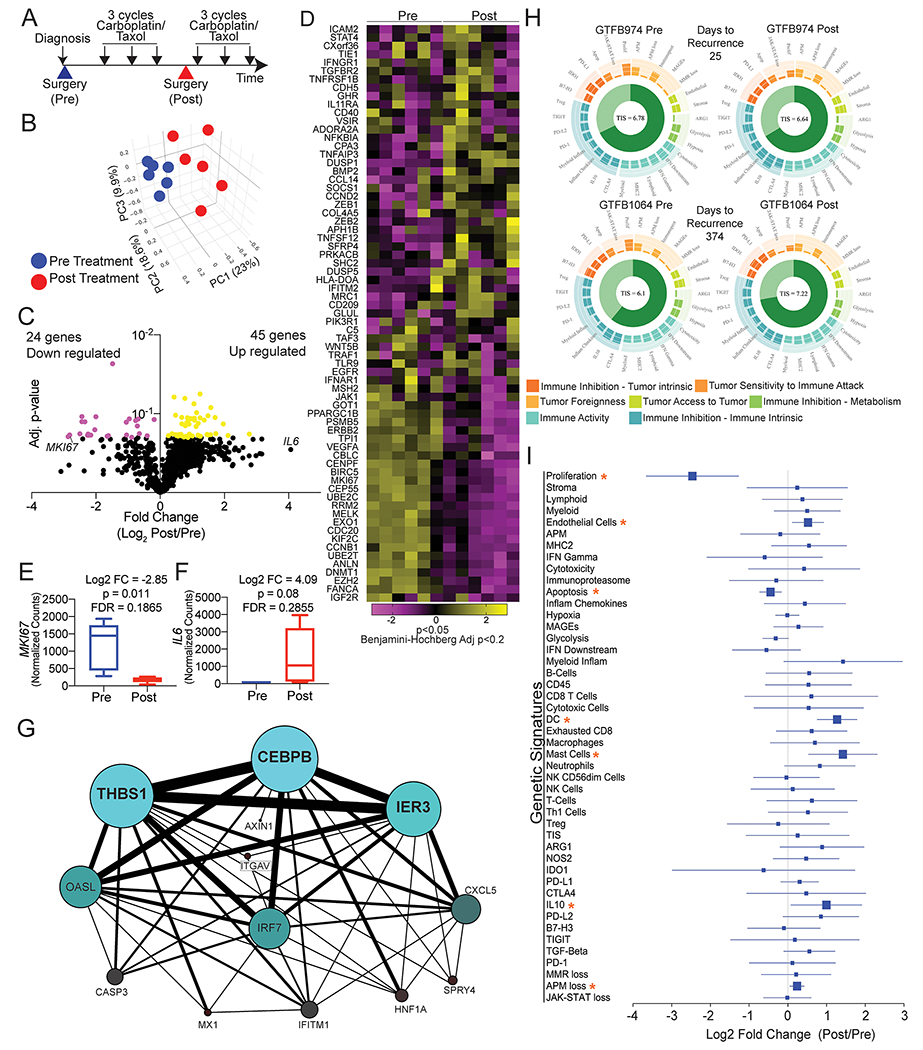
A) Graphic representation of NACT. Large arrowheads = surgeries, small black arrows = cycles of carboplatin/paclitaxel. B) Principal component (PC) analysis of the transcriptome of 770 genes (14 housekeeping genes not included) in HGSOC tumors pre (blue) and post (red) chemotherapy. C) Volcano plot of differentially regulated genes. P-value calculated with paired t-test with Benjamin-Hochberg multi-comparison correction (Adj. p-value). Yellow dots = Log2 FC>0 and adj. p-value <0.2. Pink dots = Log2 FC<0 and adj. p-value <0.2. D) Heatmap of the 74 differentially expressed genes, generated with Clustergrammer from Nanostring data. Normalized counts are transformed with Z-score method. E) MKI67 expression changes between pre- and post-NACT. F) IL6 expression changes between pre- and post-NACT. G) Transcription factor relationship of 18 genes associated with disease recurrence. Generated via PathwayNet data portal (21). H) Utilizing the gene expression data genetic signature analyses was performed on all twelve samples. Shown are representative images of the genetic signature analysis from two sets of pre- and post-chemotherapy tumors (GTFB974 and GTFB1064). Each spoke on the circular plot indicates a unique genetic signature, such as proliferation, antigen-processing and presentation machinery loss, glycolysis. Genetic signatures are grouped by tumor immune microenvironment and characteristics of the tumor microenvironment. The Tumor Inflammation Score (TIS) is indicated at the center of the circular plot. I) Log2 fold change Forest plot of genetic signatures when grouped pre- and post-chemotherapy. Orange asterisks = p<0.05 and FDR<0.20.
FFPE tumor tissue was subsequently identified and utilized for RNA isolation and transcriptomic analyses. We employed the NanoString platform to examine the expression of 770 highly annotated genes including housekeeping genes in the PanCancer IO 360 panel, which targets genes expressed by tumor cells and immune cells in the tumor microenvironment (19). Linear regression of housekeeping genes between matched pre- and post-NACT tumors showed a significant correlation in 5 of 6 samples (Supplementary Figure 1B), confirming that housekeeping genes were comparable and could be used for normalization. While still significantly correlated, GTFB1064 samples demonstrated the highest degree of housekeeping gene variation between pre- and post-chemotherapy. Based on these successful quality-control benchmarks, we compared gene expression between matched samples, and across pre- versus post-NACT samples. A total of 666 target genes passed initial filtering (i.e. removal of genes with raw counts <20) and were subsequently used for downstream analysis.
Principal component analysis of the 12 samples revealed a clear delineation between the pre- and post-NACT tumors (Figure 1B and Supplementary Figure 1C). This delineation suggests that there is a common or shared effect of chemotherapy on the tumor and tumor microenvironment (rather than chemotherapy causing primarily tumor-specific transcriptional changes). In total, 69 of 666 genes were differentially expressed in paired analyses of pre- versus post-NACT samples [False discovery rate (FDR) p < 0.2, Figure 1C–D and Supplemental Table 3]. One of most strongly downregulated genes following NACT was MIK67 (Figure 1E and Supplementary Figure 1D). Downregulation of MIK67 (Ki67, a proliferation marker) after NACT is consistent with chemotherapy targeting the dividing cells and causing cell cycle arrest. We identified post-NACT changes in gene expression signatures for each tumor pair. Across this samples series, signatures for cell proliferation, DNA damage repair, hypoxia, MAPK, PI3K/AKT, JAK/STAT were the most significantly enriched (Table 1). We considered that an inflammatory response may mediate many of these identified post-NACT gene expression changes, and supporting this, IL6 was the most upregulated gene in the post-NACT tumors (16.79 fold change, p=0.0812, Figure 1F). Though this did not reach statistical significance in paired analyses, this observation parallels reports that IL6 is induced following chemotherapy (10, 26). Consistent with the activated JAK/STAT signature as a downstream effector of IL-6, we noted that JAK1/2/3 expressions were all significantly elevated in the post-NACT compared to pre-NACT (Supplementary Figure 1F). These data highlight that at the transcriptomic level, chemotherapy is successfully targeting proliferating cells, but concomitantly activating an inflammatory response.
Table 1. Pathway analysis of transcriptional profiles.
Pathway name, average signature score relative to Pre-NACT. Pre (n=6) and Post (n=6). Nanostring transcriptomic data used as input to assess Pathway signature. Two-tailed paired t-test, Benjamini-Hochberg adjusted p-value.
| Pathway | Average Signature Score (relative to Pre-NACT) | p-value | adj. p-value |
|---|---|---|---|
| Cell Proliferation | −2.9001 | 0.0014 | 0.0084 |
| DNA Damage Repair | −1.5427 | 0.0020 | 0.0084 |
| Hypoxia | 1.8727 | 0.0015 | 0.0084 |
| MAPK | 2.3865 | 0.0014 | 0.0084 |
| Metabolic Stress | 2.7211 | 0.0018 | 0.0084 |
| PI3K-Akt | 2.7639 | 0.0012 | 0.0084 |
| Wnt Signaling | 1.6344 | 0.0035 | 0.0126 |
| Epigenetic Regulation | −1.1595 | 0.0064 | 0.0199 |
| Apoptosis | −1.4862 | 0.0085 | 0.0235 |
| Hedgehog Signaling | 1.1389 | 0.0107 | 0.0253 |
| TGF-beta Signaling | 1.1563 | 0.0111 | 0.0253 |
| JAK-STAT Signaling | 1.8937 | 0.0191 | 0.0399 |
To identify transcriptional changes associated with disease recurrence, we assessed whether the measured transcriptional changes between pre- and post-NACT samples correlated to time to recurrence. We discovered that fold change between pre- and post-NACT of 18 genes significantly correlated with time to recurrence (|r|>0.8) (Table 2). For instance, the magnitude of NACT-induced expression of the fibroblast growth factor receptor ligand FGF9 correlated with time to recurrence (r= −0.990; i.e. high FGF9 expression correlates with short time to recurrence). Signaling activated by FGF9 is consistent with the elevated PI3K/Akt and MAPK signaling observed in the pathway analyses. Taken together, these transcriptional data are suggestive of a specific stress-like response to the post-NACT tumor microenvironment.
Table 2. Top 18 genes that correlated to time to recurrence.
Log2 fold change (FC, n=12) correlated with time to disease recurrence (last row) bold numbers. Yellow = upregulated, Magenta = downregulated. Nanostring transcriptomic data used. Pearson correlation analysis (|r|>0.8, p<0.05).
| Gene Symbol | Gene Description | Log2 FC Post/Pre for each patient | Correlation to Recurrence (r, Pearson p<0.05) | |||||
|---|---|---|---|---|---|---|---|---|
| GTFB 1002 | GTFB 1064 | GTFB 1066 | GTFB 1046 | GTFB 722 | GTFB 974 | |||
| FGF9 | Fibroblast growth factor 9 | −1.36 | −0.66 | −0.38 | −0.37 | 0.87 | 0.77 | −0.990 |
| CXCL5 | C-X-C motif chemokine 5 | −1.41 | 0.08 | −0.34 | 1.54 | 1.58 | 2.60 | −0.921 |
| IER3 | Immediate Early Response 3 | 0.20 | −0.12 | 0.52 | 0.55 | 1.30 | 1.91 | −0.885 |
| AXIN1 | Axin-1 | −0.29 | −0.23 | 0.00 | −0.07 | 0.29 | 0.04 | −0.869 |
| SPRY4 | Sprouty homolog 4 | −1.11 | −1.20 | −0.62 | −1.16 | 0.77 | 0.58 | −0.869 |
| THBS1 | Thrombospondin-1 | 0.07 | −0.18 | 1.14 | 1.37 | 1.32 | 2.37 | −0.853 |
| CASP3 | Caspase-3 | −0.67 | −0.17 | −0.50 | −0.37 | 0.24 | 1.20 | −0.839 |
| ITGAV | Integrin alpha-V | −0.10 | −0.01 | −0.05 | −0.32 | 1.11 | 1.14 | −0.823 |
| CEBPB | CCAAT/enhancer-binding protein beta | −0.01 | 0.29 | 0.16 | 1.00 | 1.28 | 0.81 | −0.816 |
| OASL | 2′-5′-Oligoadenylate Synthetase Like | 0.83 | −0.88 | −1.72 | −2.20 | −1.79 | −2.04 | 0.817 |
| IFITM1 | Interferon Induced Transmembrane Protein 1 | 1.23 | 1.83 | 1.33 | −0.83 | −1.00 | −1.40 | 0.820 |
| CST2 | Cystatin SA | 2.32 | −0.26 | −0.69 | −0.43 | −0.65 | −1.21 | 0.832 |
| HNF1A | Hepatocyte Nuclear Factor 1-Alpha | 1.64 | 0.36 | 0.01 | 0.23 | −0.10 | −0.04 | 0.839 |
| IRF7 | Interferon Regulatory Factor 7 | 0.35 | −0.14 | −0.52 | −0.59 | −0.86 | −0.51 | 0.855 |
| VTCN1 | V-Set Domain Containing T Cell Activation Inhibitor 1 | 0.07 | −2.44 | −4.05 | −1.47 | −4.21 | −5.44 | 0.867 |
| MX1 | MX Dynamin Like GTPase 1 | 1.07 | 0.40 | −1.09 | −2.00 | −1.46 | −2.46 | 0.873 |
| CCNO | Cyclin O | 0.48 | −0.19 | −1.56 | −2.80 | −2.73 | −3.00 | 0.903 |
| HERC6 | HECT and RLD Domain Containing E3 Ubiquitin Ligase 6 | 1.00 | 0.68 | 0.19 | −1.23 | −1.68 | −1.58 | 0.919 |
| Time to Recurrence (Days) | 505 | 347 | 279 | 245 | 60 | 25 | ||
Transcription network and gene signature analyses of transcriptomes
We hypothesized that we could identify stress response factors driving the gene expression pattern changes post-NACT, and to do so used the 18 genes correlated with time to recurrence to construct a transcriptional regulatory network of post-NACT gene expression. In this network analysis, CEBPB (CCAAT enhancer binding protein beta; C/EBPβ) emerged as a central transcriptional hub driving a downstream network consisting of THBS1, IER3, OASL, IRF7, and CXCL5 (Figure 1G). This result implicates C/EBPβ as a central integrator of immune, inflammatory, and stress signaling in the EOC tumor microenvironment during NACT, which drives transcriptional programs mediating poor response to chemotherapy. Importantly, pathways activating C/EBPβ include growth factor signaling and IL-6 signaling (27), suggesting that the genes and pathways identified above as upregulated in response to NACT converge on C/EBPβ.
We then used a series of pre-defined genetic signatures developed by Nanostring to extrapolate tumor microenvironment conditions based on gene expression, e.g. immune and stromal cell components, inflammatory signaling (via a tumor inflammation score), and immune activation state (Figure 1H–I) (15–19). Comparing pre- vs. post-NACT gene expression using these genetic signatures identified a significant decrease (p<0.05) in “proliferation” and “apoptosis” signatures following chemotherapy. In contrast, signatures that were significantly upregulated (p<0.05) following chemotherapy include antigen-processing and presentation machinery loss, IL-10, mast cells, dendritic cells, and endothelial cells (Figure 1I). These data support our pathway analysis and suggest that increased inflammatory signaling driven by remodeling of the tumor immune infiltrate alter tumor cell signaling and ultimately drive chemotherapy resistance.
Alignment of the transcriptomic with chemotherapy-induced protein changes
Since transcriptional analyses identified critical signaling pathways activated by chemotherapy, we directly assessed the activation of protein signaling cascades by RPPA. A limitation of this approach is the requirement for fresh frozen tissue samples, available from only two of the six patients treated with NACT (GTFB1064 and GTFB1066). A pre- and post-NACT fresh frozen tumor was analyzed from both GTFB1064 and GTFB1066 (n=4). Despite this limitation, RPPA data closely aligned with Nanostring gene expression data for the 110 targets overlapping between the PanCancer IO 360 panel and M.D. Anderson’s standard RPPA platform (Figure 2A, Supplemental Table 3). Among the 110 overlapping targets, there was a strong positive correlation in both GTFB1064 and 1066 between mRNA and protein level fold changes (Post/Pre, Figure 2B–C). Signaling changes post-NACT in the RPPA also supported signatures identified in transcriptional analyses. Consistent with suppression of proliferation by chemotherapy, CCNB1 downregulation (Log2 fold change = −2.24, p=0.013, FDR 0.181) was paralleled by decreased Cyclin B1 levels in RPPA (Log2 fold change = −2.43) (Figure 2D–E). Consistent with activated PI3K/Akt signaling, SGK1 mRNA and SGK1 protein were upregulated post-NACT (mRNA Log2 fold change = 2.26, FDR 0.20; RPPA Log2 fold change = 0.76)(Figure 2F–G). Similarly, IL6 upregulation was paralleled by increased IL-6 protein levels (RPPA Log2 fold change = 0.43) (Figure 2H–I). RPPA analyses also supported the activation of IL-6 and RTK signaling via increased levels of phosphorylation of key signaling proteins. Levels of phosphorylated STAT1 (pY702), c-ABL (pY412), EGFR (pY1173), HER3 (pY1289), and IGFR (pY1135/36) were elevated post-NACT (Figure 2J–K). Notably, chemotherapy did not activate all receptor tyrosine kinases; phosphorylated HER2 (pY1248) and c-Met (pY1234/35) were unchanged following NACT (Supplementary Table 3). These RPPA data closely parallel our transcriptomic data, together identifying increased IL-6 and activation of specific receptor tyrosine kinases post-NACT. Importantly, the RPPA data directly identify signaling cascades activated post-NACT, in particular JAK/STAT, which is a key downstream target of IL-6.
Figure 2. Reverse phase protein array of pre- and post-chemotherapy treated HGSOC tumors.
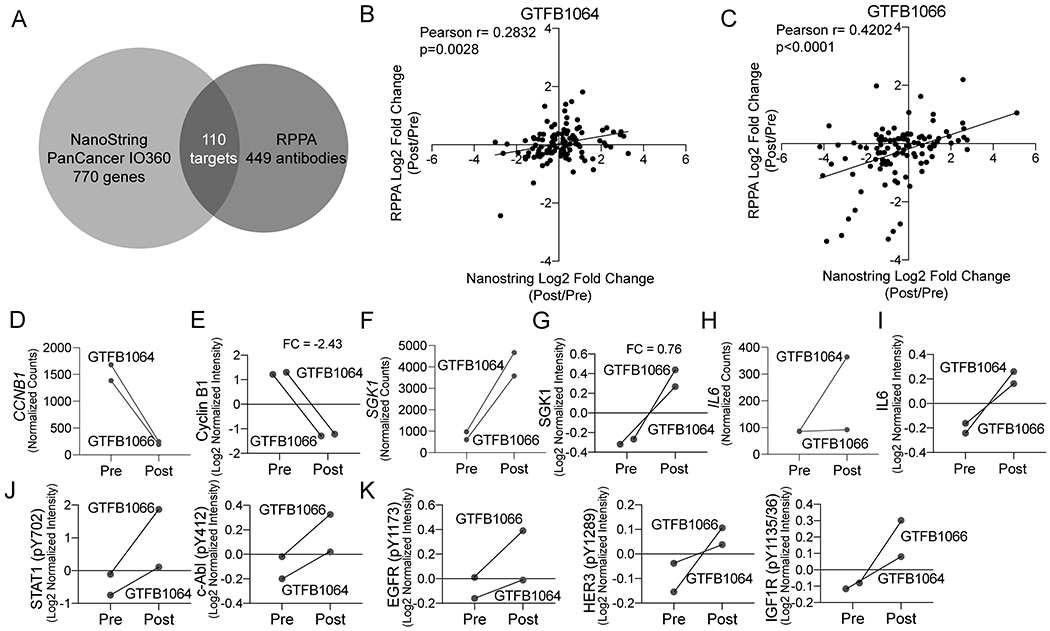
A) Venn diagram indicating the overlap in targets from NanoString and RPPA. B) Scatter plot of log2 fold change (Post/Pre) of the overlapping targets of the RPPA (y-axis) and NanoString (x-axis) from GTFB1064. Pearson correlation calculated. C) Same as B, but with expression data from GTFB1066. D) Transcript counts of CCNB1 for GTFB1064 and GTFB1066. E) RPPA data of Cyclin B1 protein from pre- and post-treated tumors. F) Transcript counts of SGK1 for GTFB1064 and GTFB1066. G) RPPA data of SGK1 protein from pre- and post-treated tumors. H) Transcript counts of IL6 for GTFB1064 and GTFB1066. I) RPPA data of IL-6 protein for pre and post-treated tumors. J) RPPA data of phosphoSTAT1 and phospho-c-Abl. Connecting lines indicate matched tumors. K) RPPA data of phosphorylated receptor tyrosine kinases, EGFR (pY1173), HER3 (pY1289), and IGF1R (pY1135/36).
Examination of the cytokine-associated ascites microenvironment
JAK/STAT signaling is initiated through the interaction of a cytokine receptor (e.g., IL6R) with its cognate ligand (e.g., IL-6), the latter of which may be secreted from the tumor or components of the tumor microenvironment, such as macrophages. As a surrogate for the tumor and associated microenvironment, we examined cytokine levels in ascites fluid from patients with HGSOC (most patients with advanced HGSOC present with ascites accumulation within the peritoneal cavity). Given that we found increased IL-6 levels and JAK/STAT signaling activity post-NACT, we examined whether cytokine levels prior to chemotherapy predicted time to recurrence. Using primary ascites from 39 patients (pre-chemotherapy, ascites fluid is typically not available post-therapy), we used a multiplexed ELISA method to measure levels of the cytokines IFNγ, IL-10, IL-12p70, IL-13, IL-1β, IL-2, IL-4, IL-6, IL-8, and TNFα. Overall, IL-6, IL-8, IL-10, and IFNγ had the largest range of concentration (Figure 3A). The samples used for RPPA GTFB1064 and GTFB1066 both had elevated IL-6 concentrations, 1576 and 1820 pg/mL, respectively. We noted that IL-12p70 and IL-4 were significantly correlated (Figure 3B, Pearson r=0.9870, p<0.0001). All of the cytokines were correlated to time to disease recurrence, which ranged from 1 to 66 months. Increasing concentrations of IL-6 or IL-10 in ascites correlated with a shorter time to disease recurrence (Figure 3C–D), suggesting that elevated cytokine signaling prior to or in response to chemotherapy may mediate resistance. Notably, there were several patients with low levels of IL-6 and IL-10 that recurred within ten months of the completion of primary chemotherapy (Figure 3C–D, red dots). These data demonstrate that while IL-6 (hazard ratio: 2.12) and IL-10 (hazard ratio: 1.52) concentrations predict time to disease recurrence, there is still a need to further elucidate the mechanisms underlying the tumor and immune microenvironment response to cytokine stimulation, especially in the context of chemotherapy.
Figure 3. Cytokine profiling of primary patient-derived ascites and transcriptional changes within matched tumors predict tumor recurrence.
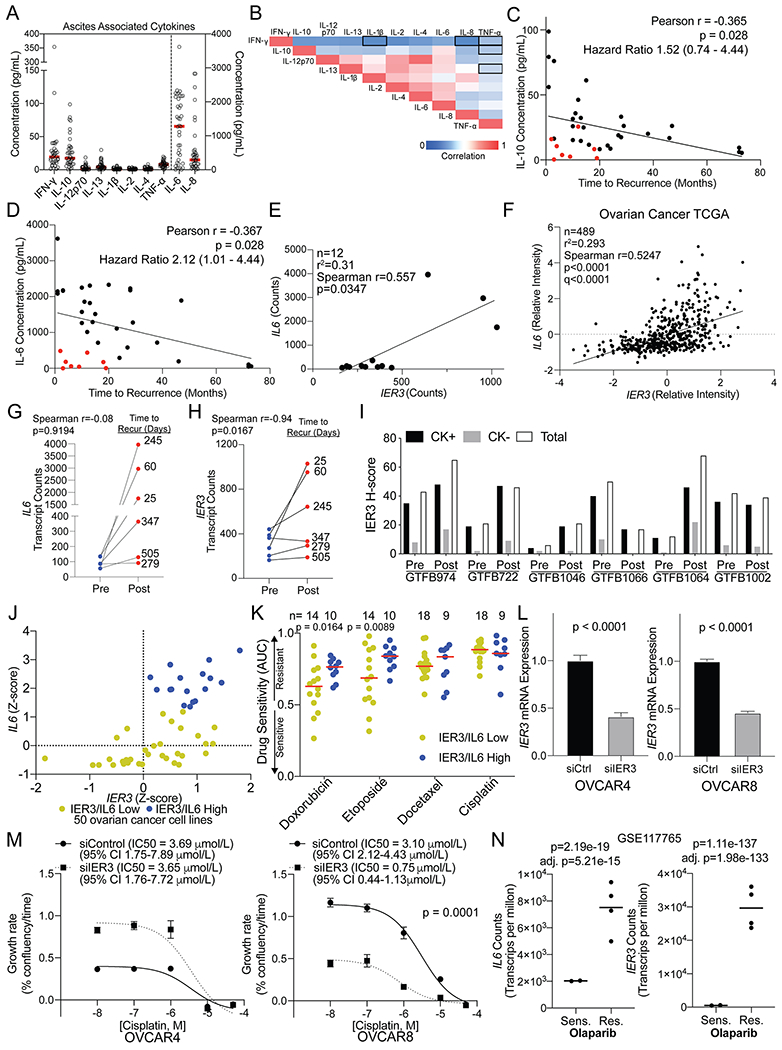
A) Ascites was collected from patients with HGSOC and was used for multi-plex ELISA from the indicated cytokines. Red bars = mean. Left y-axis include = IFN-y, IL-10, IL-12p70, IL-13, IL-1b, IL-2, IL-4, and TNF-a. The right y-axis includes IL-6 and IL-8. B) Correlation between the indicated cytokines. Red = 1 or strong correlation. Blue = 0 or weak correlation. (n = 39). Outline boxes indicate Spearman correlation p-value >0.01. C) Correlation between time to disease recurrence and IL-10 concentration. Hazard ratio calculated by stratifying data based on the median IL-10 concentration and using the Mantel-Haenszel test. D) Correlation between time to disease recurrence and IL-6 concentration. Red dots = short time to recurrence with low IL-6 concentrations. Hazard ratio calculated by stratifying data based on the median IL-6 concentration and using the Mantel-Haenszel test. E) Correlation of IL6 and IER3 expression from pre and post-NACT samples. F) IL6 and IER3 expression in 489 HGSOC tumors within TCGA. G) Change in IL6 expression in pre- and post-treated tumors. Connecting lines indicate matching tumors. H) Change in IER3 expression in pre- and post-treated tumors. Connecting lines indicate matching tumors. I) Matched pre- and post-NACT tumors (n=12) from Nanostring analysis were used for multispectral IHC against IER3 and cytokeratin (CK). The H-score for IER3 is graphed for CK positive (CK+), CK negative (CK−), and total cells. J) IER3 and IL6 Z-scores derived from ovarian cancer cell lines (n=50) in the cBio Cancer Cell Line Encyclopedia (CCLE) dataset (Accessed June 2020). A combined Z-score of greater than 2 was set to identify IER3/IL6 high (blue dots) and low (yellow) expressing cell lines. K) Drug sensitivity (area under the curve, AUC) assessed for IER3/IL6 high (blue dots) and low (yellow dots) expressing cell lines. Fisher’s LSD are from two-way ANOVA (no multiple correction). Red line = median AUC for group. L) siRNA mediated IER3 knockdown in OVCAR4 and OVCAR8 cells. IER3 mRNA expression in siControl (siCtrl) and siIER3 cells. Internal control, GAPDH. Statistical test, unpaired t-test. M) siCtrl and siIER3 OVCAR4 and OVCAR8 cells were dosed with cisplatin and imaged over 72 hrs. The growth rate was calculated via linear regression for every conditions and a dose response curve graphed. Statistical test, non-linear regression fit. Error bars, standard deviation. N) IL6 and IER3 transcript counts per million (TPM) of an olaparib sensitive (Sens.) and resistant (Res.) PEO1 cell line (GSE117765). Statistical tests, unpaired t-test (p-value) and adj. p-value, Benjamini-Hochberg.
Integration of the transcriptomic, proteomic, and cytokine profiling platforms
Transcriptomic and proteomic analysis of matched HGSOC samples pre- and post-NACT, coupled with cytokine profiling of pre-treatment HGSOC ascites, suggests elevated cytokine and/or RTK signaling prior to or in response to chemotherapy may drive resistance. In particular, our data implicate IL-6, consistent with previous studies (10, 26). However, we noted that while IL-6 protein levels were associated with time to recurrence, a similar trend was not observed with IL6 mRNA expression. Based on this, we hypothesized that IL-6 mRNA or protein levels alone may not sufficiently define activation of downstream cytokine signaling. Therefore, we compared the 18 genes that correlated with time to recurrence (Table 1) to IL6 expression within the Nanostring dataset and the Cancer Genome Atlas (TCGA) ovarian cancer dataset (Supplemental Table 4). Between the two datasets, we observed that expression of the Immediate Early Response 3 gene (IER3) was the most positively correlated (Figure 3E–F) with IL6. Further, Figure 3G demonstrates that the magnitude of IL6 induction following chemotherapy modestly correlated with time to disease recurrence. In contrast, the magnitude of IER3 induction post-NACT strongly correlated with time to disease recurrence (Figure 3H). Using immunohistochemistry (IHC) with the Nanostring matched tumor tissues, we examined IER3 expression in parallel with an epithelial tumor cell marker (cytokeratin, CK). Changes in IER3 protein expression were consistent with the changes in transcript levels and IER3 was predominantly expressed in CK+ cells (Figure 3I).
Stress induces IER3, which serves an anti-apoptotic function in a range of tumor types, and high IER3 is typically associated with disease progression and poor prognosis (28–30). We hypothesized that degree of IER3 induction compared to untreated tumors in ovarian cancer would be associated with therapy resistance. Using the cBio Portal Cancer Cell Line Encyclopedia dataset, we assessed the relationship of IER3/IL6 expression with response to chemotherapy across 50 ovarian cancer lines (24). IL6 and IER3 gene expression were strongly correlated, and using a combined IL6 and IER3 z-score, we identified 17 cell lines with high IL6/IER3 expression (Figure 3J). Ovarian cancer cell lines with high IL6/IER3 were not resistant to single-agent cisplatin or docetaxel (Figure 3K); responses to these agents in CCLE were minimal/modest. However, high IL6/IER3 did significantly correlate with resistance to second-line chemotherapies doxorubicin and etoposide (Figure 3K). To directly assess IER3’s contribution to chemotherapy response, IER3 was knocked down in OVCAR4 and OVCAR8 HGSOC cells lines and the inhibitory concentration (IC50) for cisplatin was determined. IER3 knockdown was approximately 50% in both cell lines (Figure 3L). In OVCAR4 cells, IER3 knockdown did not alter cisplatin sensitivity. In contrast, loss of IER3 in OVCAR8 cells significantly reduced the IC50 of cisplatin by 4.13 fold (Figure 3M). Next, we examined IER3 expression in olaparib-resistant HGSOC cells (22, 25). Poly(ADP-ribose) polymerase inhibitors (e.g. olaparib) are FDA approved for HGSOC and their use in the clinic is expanding. Both IL6 and IER3 were significantly upregulated, 3.7-fold and 55-fold in the olaparib-resistant versus -sensitive (parental) cells, respectively (Figure 3N). These functional data strongly support that IL-6/IER3 signaling can mediate resistance to therapy in ovarian cancer.
IER3 in the immune tumor microenvironment
To examine the relationship between IER3 and the TME, we examined an independent cohort of HGSOC tumors by tissue microarray, including pre- and post-NACT primary tumors and recurrent tumors (TMA; n=119) (22). When comparing IER3 levels by immunohistochemistry (H-score) in pre- and post-NACT tumors and recurrent tumors, IER3 was specifically elevated in post-NACT tumors (p=0.0332; Figure 4A–B). Based on the median IER3 H-score, tumors were identified as having low (n=80) or high (n=39) IER3 expression. Since tumor infiltration of T cells is a positive prognostic indicator (31, 32) we next used multi-spectral IHC to identify correlations of IER3 expression and immune cells in the tumor microenvironment. Specifically, we evaluated IER3 expression in relation to tumor-associated CD4+ T cells, CD8+ T cells, CD4+ FOXP3+ regulatory T cells (Tregs), CD68+ macrophages, pan-cytokeratin+ tumor cells, and Granzyme B+ T cells (Figure 4C). While tumor-associated macrophages and Tregs did not correlate with IER3 expression (Figure 4D–E), low IER3 expression significantly correlated with tumor-associated CD4+ T cells (p=0.0087), CD8+ T cells (p=0.0502), and CD8/granzyme B+ T cells (p=0.0386) (Figure 4F–H). We determined that in the tumor compartment IER3 is expressed in CD4 and CD8 T cells and cytokeratin positive cells with minimal expression in B cells and macrophages (Figure 4I). Albeit IER3 expression was lower, the stromal compartment demonstrated a similar expression pattern to the tumor regions (Figure 4J). Together, these data suggest that regulation of IER3 and the composition of tumor immune microenvironment are interconnected.
Figure 4. Evaluating associations between IER3 expression and the tumor microenvironment.

A) Representative images of IER3 IHC with associated histology score (H-score). Scale bars, 100 microns. B) IER3 histology score (H-score) for pre- (n= 85) and post-NACT (n=19) and recurrent (n=24) human HGSOC tumors. (p-value, one way ANOVA). C) Representative images of multi-spectral IHC of HGSOC tumors. Scale bars, 100 microns. Based on the median IER3 expression tumors were defined as “Low” (n=80) or “High” (n=39). The percentage of tumor-associated macrophages (D), Tregs (E), CD4+ T cells (F), CD8+ T cells (G), CD8/Granzyme B(Grb)+ T cells (H) was correlated to IER3 expression. Statistical test, unpaired t-test with Welch’s correction. Error bars, SEM. Note: difference in n between panels G and H-L due to missing tissue cores. I) Multispectral analysis of IER3, cytokeratin (CK+), CD19+ B cells, CD8 T cells, CD4 T cell, and CD68+ macrophages (Macro.) IER3 expression in indicated cells from the tumor compartment (CK+) and stromal compartment (J). Models for signal integration (K) and magnitude of signal intensity (L).
DISCUSSION
Understanding how chemotherapy remodels the tumor and immune microenvironment is critical in predicting disease progression. To address this in HGSOC biology, we utilized tumor tissue from patients that had received NACT, and evaluated treatment-induced. Chemotherapy led to activation of several RTKs and associated downstream signaling pathways associated with stress response and cell survival. Supporting the transcriptional and signaling network identified in our integrated analyses, expression levels of multiple CEBP/β target genes, in particular IER3, predicts disease recurrence. Taken together, chemotherapy in HGSOC is paradoxically involved in promoting an pro-tumor growth microenvironment. The implication is that dampening the chemotherapy-dependent inflammation could extend disease-free interval.
Chemotherapy results in significant tissue and cellular stress, which can lead to the activation of a multitude of effectors, including CEBP/β. The regulation of CEBP/β activity is highly complex, with multiple inhibitory and activating pathways [reviewed in (27)]. Importantly, our analyses identified a positive feedback loop consistent with CEBP/β activation and upregulation of target genes. As depicted in Figure 4K, although the response to surgery and chemotherapy is complex, other studies and our data suggest a convergence on CEBP/β activity. CEBP/β is a prognostic factor and is linked to epigenetic regulation of multiple drug-resistance genes (33). Based on CEBP/β activity in HGSOC, combination therapies that drive CEBP/β-dependence and inhibit CEBP/β transcriptional function are potential approaches to improve the anti-tumor effect of chemotherapy (34–38).
By characterizing the tumor microenvironment over the course of treatment, unique information was obtained regarding the extent and magnitude of specific molecular changes. Previous studies that evaluated HGSOC tumors pre- and post-chemotherapy, also noted that chemotherapy promoted an inflammatory response, but the immunosuppressive environment prevented activation of anti-tumor immunity, suggesting a balance between inflammation and anti-tumor immunity. For instance, IL-6 and IL-10 cooperate to establish an immunosuppressive environment through expansion of myeloid-derived suppressor cells (39). Interestingly, in the ascites samples prior to chemotherapy, there was a subset of patients that had low IL-6 and IL-10 and a short disease-free interval, suggesting an immunologically ”cold” tumor microenvironment. Therefore, understanding the chemotherapy-induced effects that contribute to the maintenance of an immunosuppressive environment is critical. For instance, while IL-6 was upregulated in all of the treated tumors, IER3 was not, suggesting that tumors that upregulated IER3 are those competent to respond to IL-6. In recurrent HGSOC tumors, IER3 expression was down compared to pre- and post-NACT, which is likely a reflection of IER3 regulation during chemotherapy. Consistent with differential IER3 induction, the magnitude of chemotherapy-induced IER3 upregulation was a superior predictor of disease recurrence compared to IL-6 (Figure 4L). IER3 regulates extrinsic apoptosis via inhibiting Fas and Tumor Necrosis Factor alpha receptor activity (40). IER3 also potentiates MAPK signaling to attenuate apoptosis (41). In osteosarcoma, knockdown of IER3 resensitized cells to chemotherapy, an alkylating agent (42). Further, in an inflammation-induced colon cancer model, Ier3 knockout led to an exacerbated inflammatory environment (43). In in vitro experiments with HGSOC cell lines, IER3 knockdown had a variable effect on cisplatin response, which could be attributed to several factors including the lack of a heterogeneous microenvironment.
We observed significant correlations between IER3 expression and the tumor immune microenvironment, specifically that low IER3 correlated with increased CD4 and CD8 T cell infiltration. Since both IL6 and IER3 are key CEBP/β target genes, the relationship between IL6 and IER3 suggests that increased levels of multiple genes activated by inflammatory/stress signaling post-NACT more accurately reflects pathway activation and therapy resistance. Although there is currently no pharmacologic approach to target IER3, several clinical trials have investigated targeting IL-6 (e.g., NCT00841191). While IL-6 likely plays a direct role in tumor progression, our integrated analyses suggest that tumor and immune microenvironments more poised to integrate and manage stress signals tend to be associated with a more aggressive and therapy resistant disease.
There are several limitations to our present study. The analysis only included six patients that qualified for NACT, which inherently suggests an advanced disease stage. HGSOC frequently disseminates throughout the peritoneal cavity, which results in multiple sites of tumor colonization, and unique molecular signatures are observed based on tumor sites (44). Accounting for these limitations, our data and conclusions are still consistent and in close agreement with previous reports, and importantly, our study further expands on these reports by demonstrating how dynamic aspects of the microenvironment can be exploited to improve patient outcomes. Specifically we identified a novel, targetable IL-6/IER3 signaling axis induced by chemotherapy that promotes inflammatory signaling that may inform subsequent therapy or help predict time to recurrence.
Supplementary Material
STATEMENT OF TRANSLATIONAL RELEVANCE.
Patients with ovarian cancer often respond to initial chemotherapy, however most patients will recur with chemo-resistant disease. Biomarkers or factors that are able to predict disease recurrence are lacking. We hypothesize that the extent of chemotherapy induced remodeling of the tumor immune microenvironment directly contributes to disease recurrence. We performed multi-omic analysis of tumors pre- and post-chemotherapy. Cytokine profiles and tumor microenvironments were then characterized in a large cohort of pre- and post-chemotherapy, and recurrent tumors. We discovered that the capacity of the tumor microenvironment to induce an inflammatory response correlates to a shorter disease-free interval. Predicting recurrence by defining chemotherapy induced transcriptional and proteomic changes within a patient’s tumor provides a precision medicine-based approach to improve disease monitoring, to hasten response to disease recurrence, and tailor future therapies.
ACKNOWLEDGEMENTS
We acknowledge Dr. Carol Goldstein for her contribution in the fight against ovarian cancer. We acknowledge Dr. Philip Owens for his assistance with the Nanostring platform. We thank the Human Immune Monitoring Shared Resource of the University of Colorado Human Immunology and Immunotherapy Initiative for their expert assistance with the Nanostring and Vectra platforms. We acknowledge funding from The University of Colorado OB/GYN Academic Enrichment Fund (KB and TRK), Libations for Life (KB and TRK), and The University of Colorado Cancer Center Developmental Therapeutics Program (BGB and KB). ZLW is supported by Cancer League of Colorado research grant 193527-ZW and Colorado Clinical & Translational Sciences Institute CO-Pilot grant CO-J-20-006. This work was supported by grants from the NIH/NCI (BGB, R00CA194318-03; MJS, R00CA193734; JCC, U01CA231978), and Department of Defense Awards (JKR OC130212; BGB OC170228). KB is also supported by the Emily McClintock-Addlesperger Endowed Chair in Ovarian Cancer Research. The Functional Proteomics RPPA Core facility is supported by MD Anderson Cancer Center Support Grant # 5 P30 CA016672-40. Support of Core Facilities was provided by the University of Colorado Cancer Center Support Grant (P30CA046934).
Footnotes
The authors declare no potential conflicts of interest.
REFERENCES
- 1.Siegel RL, Miller KD, and Jemal A. Cancer statistics, 2019. CA Cancer J Clin. 2019;69(1):7–34. [DOI] [PubMed] [Google Scholar]
- 2.Fagotti A, Ferrandina G, Fanfani F, Ercoli A, Lorusso D, Rossi M, et al. A laparoscopy-based score to predict surgical outcome in patients with advanced ovarian carcinoma: a pilot study. Ann Surg Oncol. 2006;13(8):1156–61. [DOI] [PubMed] [Google Scholar]
- 3.Petrillo M, Vizzielli G, Fanfani F, Gallotta V, Cosentino F, Chiantera V, et al. Definition of a dynamic laparoscopic model for the prediction of incomplete cytoreduction in advanced epithelial ovarian cancer: proof of a concept. Gynecol Oncol. 2015;139(1):5–9. [DOI] [PubMed] [Google Scholar]
- 4.Bian C, Yao K, Li L, Yi T, and Zhao X. Primary debulking surgery vs. neoadjuvant chemotherapy followed by interval debulking surgery for patients with advanced ovarian cancer. Arch Gynecol Obstet. 2016;293(1):163–8. [DOI] [PubMed] [Google Scholar]
- 5.May T, Comeau R, Sun P, Kotsopoulos J, Narod SA, Rosen B, et al. A Comparison of Survival Outcomes in Advanced Serous Ovarian Cancer Patients Treated With Primary Debulking Surgery Versus Neoadjuvant Chemotherapy. Int J Gynecol Cancer. 2017;27(4):668–74. [DOI] [PubMed] [Google Scholar]
- 6.Mueller JJ, Zhou QC, Iasonos A, O’Cearbhaill RE, Alvi FA, El Haraki A, et al. Neoadjuvant chemotherapy and primary debulking surgery utilization for advanced-stage ovarian cancer at a comprehensive cancer center. Gynecol Oncol. 2016;140(3):436–42. [DOI] [PMC free article] [PubMed] [Google Scholar]
- 7.Bohm S, Montfort A, Pearce OM, Topping J, Chakravarty P, Everitt GL, et al. Neoadjuvant Chemotherapy Modulates the Immune Microenvironment in Metastases of Tubo-Ovarian High-Grade Serous Carcinoma. Clin Cancer Res. 2016;22(12):3025–36. [DOI] [PubMed] [Google Scholar]
- 8.Lo CS, Sanii S, Kroeger DR, Milne K, Talhouk A, Chiu DS, et al. Neoadjuvant Chemotherapy of Ovarian Cancer Results in Three Patterns of Tumor-Infiltrating Lymphocyte Response with Distinct Implications for Immunotherapy. Clin Cancer Res. 2017;23(4):925–34. [DOI] [PubMed] [Google Scholar]
- 9.Chudecka-Glaz AM, Cymbaluk-Ploska AA, Menkiszak JL, Pius-Sadowska E, Machalinski BB, Sompolska-Rzechula A, et al. Assessment of selected cytokines, proteins, and growth factors in the peritoneal fluid of patients with ovarian cancer and benign gynecological conditions. Onco Targets Ther. 2015;8:471–85. [DOI] [PMC free article] [PubMed] [Google Scholar]
- 10.Cohen S, Bruchim I, Graiver D, Evron Z, Oron-Karni V, Pasmanik-Chor M, et al. Platinum-resistance in ovarian cancer cells is mediated by IL-6 secretion via the increased expression of its target cIAP-2. J Mol Med (Berl). 2013;91(3):357–68. [DOI] [PubMed] [Google Scholar]
- 11.Kato T, Noma K, Ohara T, Kashima H, Katsura Y, Sato H, et al. Cancer-Associated Fibroblasts Affect Intratumoral CD8(+) and FoxP3(+) T Cells Via IL6 in the Tumor Microenvironment. Clin Cancer Res. 2018;24(19):4820–33. [DOI] [PubMed] [Google Scholar]
- 12.Lane D, Matte I, Rancourt C, and Piche A. Prognostic significance of IL-6 and IL-8 ascites levels in ovarian cancer patients. BMC Cancer. 2011;11:210. [DOI] [PMC free article] [PubMed] [Google Scholar]
- 13.Moradi MM, Carson LF, Weinberg B, Haney AF, Twiggs LB, and Ramakrishnan S. Serum and ascitic fluid levels of interleukin-1, interleukin-6, and tumor necrosis factor-alpha in patients with ovarian epithelial cancer. Cancer. 1993;72(8):2433–40. [DOI] [PubMed] [Google Scholar]
- 14.Fernandez NF, Gundersen GW, Rahman A, Grimes ML, Rikova K, Hornbeck P, et al. Clustergrammer, a web-based heatmap visualization and analysis tool for high-dimensional biological data. Sci Data. 2017;4:170151. [DOI] [PMC free article] [PubMed] [Google Scholar]
- 15.Erratum for the Research Article “Pan-tumor genomic biomarkers for PD-1 checkpoint blockade-based immunotherapy” by R. Mogg Cristescu, R., Ayers M, Albright A, Murphy E, Yearley J, Sher X, Liu XQ, Lu H, Nebozhyn M, Zhang C, Lunceford JK, Joe A, Cheng J, Webber AL, Ibrahim N, Plimack ER, Ott PA, Seiwert TY, Ribas A, McClanahan TK, Tomassini JE, Loboda A, Kaufman D. Science. 2019;363(6430). [DOI] [PMC free article] [PubMed] [Google Scholar]
- 16.Ayers M, Lunceford J, Nebozhyn M, Murphy E, Loboda A, Kaufman DR, et al. IFN-gamma-related mRNA profile predicts clinical response to PD-1 blockade. J Clin Invest. 2017;127(8):2930–40. [DOI] [PMC free article] [PubMed] [Google Scholar]
- 17.Cristescu R, Mogg R, Ayers M, Albright A, Murphy E, Yearley J, et al. Pan-tumor genomic biomarkers for PD-1 checkpoint blockade-based immunotherapy. Science. 2018;362(6411). [DOI] [PMC free article] [PubMed] [Google Scholar]
- 18.Danaher P, Warren S, Lu R, Samayoa J, Sullivan A, Pekker I, et al. Pan-cancer adaptive immune resistance as defined by the Tumor Inflammation Signature (TIS): results from The Cancer Genome Atlas (TCGA). J Immunother Cancer. 2018;6(1):63. [DOI] [PMC free article] [PubMed] [Google Scholar]
- 19.Voorwerk L, Slagter M, Horlings HM, Sikorska K, van de Vijver KK, de Maaker M, et al. Immune induction strategies in metastatic triple-negative breast cancer to enhance the sensitivity to PD-1 blockade: the TONIC trial. Nat Med. 2019;25(6):920–8. [DOI] [PubMed] [Google Scholar]
- 20.Tibes R, Qiu Y, Lu Y, Hennessy B, Andreeff M, Mills GB, et al. Reverse phase protein array: validation of a novel proteomic technology and utility for analysis of primary leukemia specimens and hematopoietic stem cells. Mol Cancer Ther. 2006;5(10):2512–21. [DOI] [PubMed] [Google Scholar]
- 21.Park CY, Krishnan A, Zhu Q, Wong AK, Lee YS, and Troyanskaya OG. Tissue-aware data integration approach for the inference of pathway interactions in metazoan organisms. Bioinformatics. 2015;31(7):1093–101. [DOI] [PMC free article] [PubMed] [Google Scholar]
- 22.Watson ZL, Yamamoto TM, McMellen A, Kim H, Hughes CJ, Wheeler LJ, et al. Histone methyltransferases EHMT1 and EHMT2 (GLP/G9A) maintain PARP inhibitor resistance in high-grade serous ovarian carcinoma. Clin Epigenetics. 2019;11(1):165. [DOI] [PMC free article] [PubMed] [Google Scholar]
- 23.Lang J, Capasso A, Jordan KR, French JD, Kar A, Bagby SM, et al. Development of an Adrenocortical Cancer Humanized Mouse Model to Characterize Anti-PD1 Effects on Tumor Microenvironment. J Clin Endocrinol Metab. 2020;105(1). [DOI] [PMC free article] [PubMed] [Google Scholar]
- 24.Ghandi M, Huang FW, Jane-Valbuena J, Kryukov GV, Lo CC, McDonald ER 3rd, et al. Next-generation characterization of the Cancer Cell Line Encyclopedia. Nature. 2019;569(7757):503–8. [DOI] [PMC free article] [PubMed] [Google Scholar]
- 25.Yamamoto TM, McMellen A, Watson ZL, Aguilera J, Ferguson R, Nurmemmedov E, et al. Activation of Wnt signaling promotes olaparib resistant ovarian cancer. Mol Carcinog. 2019. [DOI] [PMC free article] [PubMed] [Google Scholar]
- 26.Wang Y, Zong X, Mitra S, Mitra AK, Matei D, and Nephew KP. IL-6 mediates platinum-induced enrichment of ovarian cancer stem cells. JCI Insight. 2018;3(23). [DOI] [PMC free article] [PubMed] [Google Scholar]
- 27.Huber R, Pietsch D, Panterodt T, and Brand K. Regulation of C/EBPbeta and resulting functions in cells of the monocytic lineage. Cell Signal. 2012;24(6):1287–96. [DOI] [PubMed] [Google Scholar]
- 28.Liu Z, Wang XM, Jia TF, Zhai Y, Sun LY, Cheng YP, et al. Expression of IER3 in primary hepatocarcinoma: correlation with clinicopathological parameters. Asian Pac J Cancer Prev. 2015;16(2):679–82. [DOI] [PubMed] [Google Scholar]
- 29.Wu MX. Roles of the stress-induced gene IEX-1 in regulation of cell death and oncogenesis. Apoptosis. 2003;8(1):11–8. [DOI] [PubMed] [Google Scholar]
- 30.Ye J, Zhang Y, Cai Z, Jiang M, Li B, Chen G, et al. Increased expression of immediate early response gene 3 protein promotes aggressive progression and predicts poor prognosis in human bladder cancer. BMC Urol. 2018;18(1):82. [DOI] [PMC free article] [PubMed] [Google Scholar]
- 31.Nielsen JS, Sahota RA, Milne K, Kost SE, Nesslinger NJ, Watson PH, et al. CD20+ tumor-infiltrating lymphocytes have an atypical CD27− memory phenotype and together with CD8+ T cells promote favorable prognosis in ovarian cancer. Clin Cancer Res. 2012;18(12):3281–92. [DOI] [PubMed] [Google Scholar]
- 32.Zhang L, Conejo-Garcia JR, Katsaros D, Gimotty PA, Massobrio M, Regnani G, et al. Intratumoral T cells, recurrence, and survival in epithelial ovarian cancer. N Engl J Med. 2003;348(3):203–13. [DOI] [PubMed] [Google Scholar]
- 33.Liu D, Zhang XX, Li MC, Cao CH, Wan DY, Xi BX, et al. C/EBPbeta enhances platinum resistance of ovarian cancer cells by reprogramming H3K79 methylation. Nat Commun. 2018;9(1):1739. [DOI] [PMC free article] [PubMed] [Google Scholar]
- 34.Coward J, Kulbe H, Chakravarty P, Leader D, Vassileva V, Leinster DA, et al. Interleukin-6 as a therapeutic target in human ovarian cancer. Clin Cancer Res. 2011;17(18):6083–96. [DOI] [PMC free article] [PubMed] [Google Scholar]
- 35.Duan Z, Foster R, Bell DA, Mahoney J, Wolak K, Vaidya A, et al. Signal transducers and activators of transcription 3 pathway activation in drug-resistant ovarian cancer. Clin Cancer Res. 2006;12(17):5055–63. [DOI] [PubMed] [Google Scholar]
- 36.Kandala PK, and Srivastava SK. Diindolylmethane suppresses ovarian cancer growth and potentiates the effect of cisplatin in tumor mouse model by targeting signal transducer and activator of transcription 3 (STAT3). BMC Med. 2012;10:9. [DOI] [PMC free article] [PubMed] [Google Scholar]
- 37.Momeny M, Yousefi H, Eyvani H, Moghaddaskho F, Salehi A, Esmaeili F, et al. Blockade of nuclear factor-kappaB (NF-kappaB) pathway inhibits growth and induces apoptosis in chemoresistant ovarian carcinoma cells. Int J Biochem Cell Biol. 2018;99:1–9. [DOI] [PubMed] [Google Scholar]
- 38.Rosell R, Robinet G, Szczesna A, Ramlau R, Constenla M, Mennecier BC, et al. Randomized phase II study of cetuximab plus cisplatin/vinorelbine compared with cisplatin/vinorelbine alone as first-line therapy in EGFR-expressing advanced non-small-cell lung cancer. Ann Oncol. 2008;19(2):362–9. [DOI] [PubMed] [Google Scholar]
- 39.Wu L, Deng Z, Peng Y, Han L, Liu J, Wang L, et al. Ascites-derived IL-6 and IL-10 synergistically expand CD14(+)HLA-DR(−/low) myeloid-derived suppressor cells in ovarian cancer patients. Oncotarget. 2017;8(44):76843–56. [DOI] [PMC free article] [PubMed] [Google Scholar]
- 40.Morinobu A, Tanaka S, Nishimura K, Takahashi S, Kageyama G, Miura Y, et al. Expression and Functions of Immediate Early Response Gene X-1 (IEX-1) in Rheumatoid Arthritis Synovial Fibroblasts. PLoS One. 2016;11(10):e0164350. [DOI] [PMC free article] [PubMed] [Google Scholar]
- 41.Garcia J, Ye Y, Arranz V, Letourneux C, Pezeron G, and Porteu F. IEX-1: a new ERK substrate involved in both ERK survival activity and ERK activation. EMBO J. 2002;21(19):5151–63. [DOI] [PMC free article] [PubMed] [Google Scholar]
- 42.Bruheim S, Xi Y, Ju J, and Fodstad O. Gene expression profiles classify human osteosarcoma xenografts according to sensitivity to doxorubicin, cisplatin, and ifosfamide. Clin Cancer Res. 2009;15(23):7161–9. [DOI] [PubMed] [Google Scholar]
- 43.Sina C, Arlt A, Gavrilova O, Midtling E, Kruse ML, Muerkoster SS, et al. Ablation of gly96/immediate early gene-X1 (gly96/iex-1) aggravates DSS-induced colitis in mice: role for gly96/iex-1 in the regulation of NF-kappaB. Inflamm Bowel Dis. 2010;16(2):320–31. [DOI] [PMC free article] [PubMed] [Google Scholar]
- 44.Zhang AW, McPherson A, Milne K, Kroeger DR, Hamilton PT, Miranda A, et al. Interfaces of Malignant and Immunologic Clonal Dynamics in Ovarian Cancer. Cell. 2018;173(7):1755–69 e22. [DOI] [PubMed] [Google Scholar]
Associated Data
This section collects any data citations, data availability statements, or supplementary materials included in this article.