

Significance
Secondary organic aerosol (SOA) from fossil-fuel combustion is a major component of Beijing winter haze pollution but its formation mechanisms are unclear. It is generally assumed to originate from atmospheric oxidation of volatile organic compounds (VOCs). However, we show here that fast aqueous-phase oxidation of directly emitted primary organic aerosol (POA) takes place at high relative humidity in Beijing winter haze and can explain the observed SOA. This could explain why SOA has decreased in response to POA emission controls even as VOC emissions have stayed flat. The mechanism may involve ring-breaking oxidation and functionalization of polycyclic aromatic hydrocarbons.
Keywords: secondary organic aerosol, fossil-fuel combustion emissions, polycyclic aromatic hydrocarbons, aqueous-phase oxidation
Abstract
Secondary organic aerosol (SOA) produced by atmospheric oxidation of primary emitted precursors is a major contributor to fine particulate matter (PM2.5) air pollution worldwide. Observations during winter haze pollution episodes in urban China show that most of this SOA originates from fossil-fuel combustion but the chemical mechanisms involved are unclear. Here we report field observations in a Beijing winter haze event that reveal fast aqueous-phase conversion of fossil-fuel primary organic aerosol (POA) to SOA at high relative humidity. Analyses of aerosol mass spectra and elemental ratios indicate that ring-breaking oxidation of POA aromatic species, leading to functionalization as carbonyls and carboxylic acids, may serve as the dominant mechanism for this SOA formation. A POA origin for SOA could explain why SOA has been decreasing over the 2013–2018 period in response to POA emission controls even as emissions of volatile organic compounds (VOCs) have remained flat.
Organic aerosol (OA) is the dominant component of fine particulate matter (PM2.5) in most polluted regions of the world, with implications for air-quality degradation and climate forcing (1, 2). Most of that OA is secondary (SOA), produced by atmospheric oxidation of volatile organic compounds (VOCs) emitted as gases from anthropogenic, pyrogenic, and biogenic sources (3–5). SOA can also result from oxidation of primary (i.e., directly emitted) OA in wet particles or fog/cloud droplets (5, 6). A number of studies have shown that uptake of oxidized VOCs by aqueous aerosols and fog/clouds, with subsequent aqueous-phase transformation to nonvolatile products, can be an important pathway for SOA formation (5–11). The mechanisms are poorly understood, however, hampering our ability to model responses to changes in VOC emissions and other factors.
PM2.5 is a severe air-pollution problem in China. Concentrations are particularly high during stagnant high-humidity wintertime conditions (winter haze) (12). OA accounts for about half of total PM2.5 in winter haze, and most is SOA originating from fossil-fuel (FF) combustion (13), but the mechanisms responsible for this SOA formation are unknown. Incomplete FF combustion such as from residential burning of coal emits black carbon (BC) particles and primary OA (FF-POA). FF-POA has a complex composition including polycyclic aromatic hydrocarbons (PAHs) among other compounds (14–16). It may take up water at high relative humidity (RH) following coating with water-soluble species such as sulfate and nitrate (17–19). A recent study in Beijing found that 40–80% of FF-POA was water-soluble (20).
Here we use detailed chemical observations during a Beijing haze event to show evidence for aqueous-phase chemical conversion of FF-POA to SOA (aq-SOA), and we show that this mechanism can account for 20% of the total OA observed in the haze event. This may explain why SOA concentrations in Beijing haze have decreased in recent years (21), as POA emissions have strongly decreased while VOC emissions have stayed flat (22). We further show that conversion of FF-POA to aq-SOA decreases the light absorption of OA with possible implications for radiative forcing and pollution-weather feedbacks.
Results
Field Observation of SOA Produced in the Aqueous Phase.
Fig. 1 shows the temporal variations of selected variables measured at the tower site of the Institute of Atmospheric Physics, Chinese Academy of Sciences in urban Beijing during the haze event of December 16–22, 2016. Winds were weak throughout the event, indicative of stagnant conditions. The event terminated with the passage of a cold front on December 22. The period of December 16–19, denoted as Stage I in Fig. 1, was characterized by moderate RH (53 ± 12%) and a mean temperature of 277 K. The period of December 20–21, denoted as Stage II, had a much higher RH (81 ± 10%) and a cooler temperature (274 K). Low cloud and fog were pervasive at night during Stage II (12).
Fig. 1.

Time series of meteorological parameters and chemical species measured in Beijing on December 16–22, 2016. UTC+8 denotes Coordinated Universal Time +8 h and represents local time in hours. (A) RH and wind speed (WS) measured at 8 m above ground level; (B) BC and associated FF-POA; (C) BC-associated LO-OOA and the sum of FF-POA, LO-OOA, and MD-OOA (FF-sum); (D) BC-associated aq-SOA and total PM1 sulfate; (E) O/C mass ratio and the MAC of BC-associated total OA at 370-nm wavelength. The campaign sampled an extended pollution episode on December 16–22 with initially moderate RH of 40–75% (Stage I), followed by a period of higher RH approaching 100% at night (Stage II), and ending on December 22 with the passage of a cold front. Daytime periods are shaded.
Fig. 1 B–D show the time series of the concentrations of BC and OA for submicrometer BC-containing particles (BC-PM1) (23). The measurements were made with a soot particle aerosol mass spectrometer (SP-AMS), providing ion mass spectra and size distributions for the particles (Materials and Methods). The size cut of the instrument is about 1 μm, hence the PM1 notation, but the compositions of PM1 and PM2.5 are similar (24). Source apportionment of BC-PM1 OA was performed by positive matrix factorization (PMF) analysis of the mass spectra (25). Five OA components were identified (Fig. 2). These components included FF-POA, a biomass burning-related OA (BBOA), a less-oxidized oxygenated OA (LO-OOA), a moderately oxidized OOA (MD-OOA), and a more-oxidized OOA (MO-OOA) which we show below to be produced in the aqueous phase (aq-SOA). The FF-POA, LO-OOA, MD-OOA, and aq-SOA components originated from FF combustion, as indicated by the presence of similar patterns of PAH-like species in their mass spectra and distinct from BBOA (Fig. 2). We refer to “FF-sum” as the sum of the FF-POA, LO-OOA, and MD-OOA components, distinct from aq-SOA.
Fig. 2.

Components of OA during the December 16–22 winter haze episode. Mass spectra of (A) FF-POA; (B) BBOA; (C) LO-OOA; (D) MD-OOA; and (E) aq-SOA. Mass spectra signals less than 150 amu are colored by six ion categories (i.e., CxHy+, CxHyO+, CxHyO2+, HO+, CxHyN+, and CxHyON+), signals equal to or greater than 150 amu are in unit mass resolution, and PAHs signals are in red. BBOA was identified by levoglucosan tracer ions (e.g., C2H4O2+ at m/z 60 and C3H5O2+ at m/z 73), distinct from the FF PAH patterns of the other components. (F) Mass-based dry size distributions of different OA components; (G) mass-based dry size distributions of sulfate particles in Stage II. M denotes mass and Dva denotes particle vacuum aerodynamic diameter. The measurements were made by the SP-AMS instrument with a 50% size cut at 1-μm diameter, hence the data undercount particles larger than 1 μm.
The aq-SOA in this study is of particular interest. It tracked tightly with independently measured total nonrefractory PM1 (NR-PM1) sulfate (r2 = 0.86, Fig. 1D) measured by a high-resolution AMS (HR-AMS) instrument at the same site (26). It is known that sulfate during winter haze events is produced mainly by aqueous-phase oxidation of sulfur dioxide (SO2) emitted from coal combustion (12). A pronounced increase of aq-SOA concentration during Stage II with higher RH further supports the formation of aq-SOA through aqueous-phase chemistry (Fig. 1 A and D). Previous AMS studies in urban China have identified MO-OOA as an important OA component (14, 26–28), and we find here that it can be produced in the aqueous phase under high-RH conditions, hence our aq-SOA terminology. MO-OOA may also be produced by nonaqueous pathways at lower RH (29).
Concurrent measurement of submicrometer nonrefractory OA (NR-PM1 OA) was performed by the HR-AMS instrument during the haze event. The NR-PM1 OA measurement includes both BC-containing (BC-PM1 OA) and non-BC-containing particles. Our independently measured BC-PM1 OA made up 37% of the NR-PM1 OA, consistent with previous observations in Beijing haze (30). Application of PMF analysis to NR-PM1 OA identified the same aq-SOA component as in BC-PM1, contributing on average 20% of total NR-PM1 OA. An excellent correlation (r2 = 0.97, SI Appendix, Fig. S1) between NR-PM1 aq-SOA and BC-PM1 aq-SOA indicates the ubiquitous presence of aq-SOA in different types of particles (BC-containing and non-BC-containing). On average, we find that BC-PM1 aq-SOA accounts for 57% of NR-PM1 aq-SOA, which is larger than the average of 37% for total OA. This is consistent with aq-SOA being of FF origin.
FF OA as Precursor for aq-SOA.
Fig. 2 shows the mass spectra of the five OA components resolved by PMF analysis (for details see Materials and Methods). There are strong and similar signatures of PAH-like ions (16) at mass-to-charge ratios (m/z) larger than 150 in FF-POA, LO-OOA, MD-OOA, and aq-SOA. This observation implies a common FF origin (Fig. 2 and SI Appendix, Fig. S2). The signatures were not present in BBOA. The detection of the PAH-like ion signals was possible in this study because of the use of an SP-AMS; conventional HR-AMS used in earlier studies has less sensitivity toward the low-volatility organic species (23, 26, 31–33). Additionally, a shift of the size distribution of aq-SOA toward larger particles compared to FF-sum (Fig. 2F) suggests an association of aq-SOA with sulfate formation in Stage II as indicated by their similar size distribution (Fig. 2G) and the tight correlation (Fig. 1D). Previous evidence indicates that sulfate was produced rapidly during Stage II by cycling of air parcels through fog and cloud (12), and the same could apply to aq-SOA resulting in a shift to larger particle sizes. The event-average mass spectrum of OA in BC-PM1 of large diameters (>1,200 nm) has an excellent correlation with the mass spectrum of aq-SOA (r2 of 0.92, SI Appendix, Fig. S3), thus further supporting the PMF results.
Fig. 3 shows the relationship between the mass fraction (%) of aq-SOA and that of the other FF-related OA components (FF-sum, or FF-POA + LO-OOA + MD-OOA) in BC-PM1. There is a strong negative correlation with increasing the contribution of aq-SOA at high RH. The regression slope is close to −1, consistent with production of aq-SOA by aqueous-phase oxidation of the other OA components.
Fig. 3.

Relationship between the mass fraction (%) of aq-SOA and that of the sum of other FF-related components of OA (FF-POA + LO-OOA + MD-OOA) in submicrometer particles (BC-PM1). Hourly observations from the December 16–22, 2016 Beijing haze event are colored by RH. (Inset) The correlation coefficient and reduced major-axis regression slope are shown.
Fig. 4A presents the Van Krevelen diagram (34) of the elemental ratios of BC-PM1 OA components. The Van Krevelen diagram tracks the evolution of organic matter based on hydrogen-to-carbon (H/C) and oxygen-to-carbon (O/C) ratios, both of which are measured by the SP-AMS. As shown in Fig. 4A, H/C and O/C both increase in the succession from FF-POA to LO-OOA to MD-OOA and eventually to aq-SOA. This positive relationship of H/C and O/C evolution during oxidative aging is uncommon for organic material (26, 30, 35–38) because oxidation (increasing O/C) is generally associated with a decrease of H/C. There is an exception, however, for ring breaking of aromatic species, as shown in laboratory studies (39–41) and in a previous field study (42). The OH-initiated ring-breaking reactions can take place in the aqueous phase and form highly oxidized oxygenated compounds. For example, Hems et al. (43) observed that nitrophenol molecules could react rapidly with OH radicals in aqueous solutions with the addition of OH functional groups to the aromatic ring at the initial stage, followed by fragmentation to multifunctional organic species with high H/C and O/C ratios. Huang et al. (40) found that the photooxidation of syringaldehyde and acetosyringone in ammonium sulfate aqueous solution led to increases in bulk H/C and O/C ratios. Similar behavior has been observed for other aromatic compounds such as xylene (44), naphthene (39, 42, 45), methyl-substituted naphthene (46), and phenanthrene (47).
Fig. 4.

(A) Van Krevelen diagram of OA components in submicrometer BC-PM1. Data for the December 16–22, 2016 haze event are shown in dots colored by the mass fraction (%) of aq-SOA (faq-SOA) in BC-PM1. Elemental ratios of PMF-resolved OA components are also presented. (B–D) Mass fractions in BC-PM1 of ion fragments indicative of oxygenated functional groups (carbonyls, alcohols, carboxylic acids) as a function of RH.
Ring-breaking oxidation of aromatic FF-POA could thus provide the mechanism for aq-SOA formation. FF-POA, LO-OOA, MD-OOA, and aq-SOA have a near-linear alignment in the Van Krevelen plot (Fig. 4A), supporting a successive oxidation sequence of FF-POA to LO-OOA, MD-OOA, and finally aq-SOA. The fraction of PAHs in OA (Fig. 2) decreases from 9.8% in FF-POA to 4.9%, in LO-OOA, 2.8% in MD-OOA, and 2.1% in aq-SOA. This is consistent with the oxidation of PAHs being involved in the conversion of FF-POA to aq-SOA.
Fig. 4 B–D shows the mass fractions of CHO+, HCO2+, and C2H2O2+ ion fragments in BC-PM1 as a function of RH. The intensities of CHO+ (m/z 29) and C2H3O+ (m/z 43), tracers of carbonyl fragments, are stronger in the mass spectrum of aq-SOA compared to other components (Fig. 2). CHO+ is also a tracer for alcohol compounds (48). In addition, HCO2+ at m/z 45, a common fragment ion of carboxylic acids, has a strong correlation with aq-SOA (r2 = 0.88, SI Appendix, Fig. S4). HCO2+ is also associated with aqueous oxidation of aromatic compounds (49). C2H2O2+ is a tracer ion for glyoxal, which could be a ring-breaking product from aqueous-phase oxidation of PAHs (41). The increasing trends of these ions with RH suggest that water-soluble organic species such as carbonyls, alcohols, and carboxylic acids are produced as components of aq-SOA following aromatic oxidation and ring breaking.
It is generally assumed that SOA originates from oxidation of VOCs, but here we find that oxidation of FF-POA may be more important under high-RH conditions. This has important implications for understanding PM2.5 trends in Beijing haze. SI Appendix, Fig. S5 shows observed 2013–2020 trends of SOA and noncooking POA, featuring strong decreases over 2013–2018 with a high degree of correlation between the two. POA emissions during that time decreased sharply while VOC emissions remained flat (22), consistent with a POA origin for SOA rather than a VOC origin. The SOA increase in 2019–2020 may reflect increasing wintertime concentrations of oxidants as NOx emissions decrease (50).
Effects on OA Light Absorption.
Fig. 5 shows the mass absorption cross-section (MAC) values of the five resolved BC-PM1 OA components. Light absorption by OA is the strongest at ultraviolet wavelengths but extends into the visible range. aq-SOA has the lowest MAC values, while MD-OOA has the highest. This suggests that initial oxidation of FF-POA to MD-OOA increases light absorption and subsequent oxidation to aq-SOA decreases light absorption. A similar behavior of initial increase in light absorption during aging, followed by a decrease, has been observed in biomass burning plumes (36, 51, 52). MD-OOA has the highest correlation with BC-PM1 nitrate among all OA components (SI Appendix, Fig. S6), suggesting that nitrogen-containing organic species (e.g., nitrophenols) may play an important role in the light absorption of MD-OOA (43, 53). The decreased light absorption by aq-SOA is consistent with loss in PAHs and aromaticity (Fig. 2 A–E) (54).
Fig. 5.
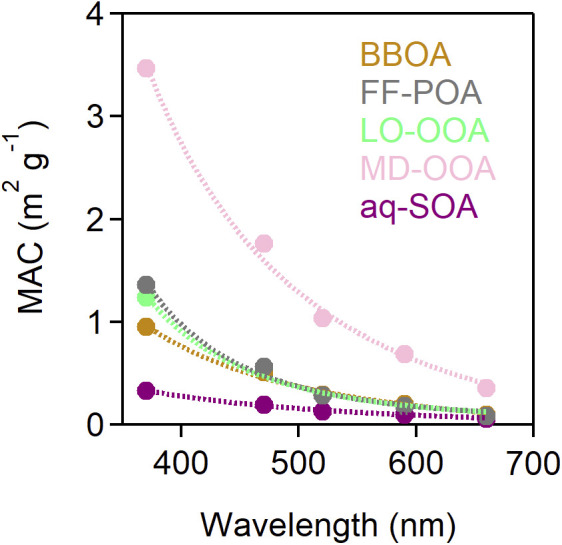
MAC of different BC-PM1 OA components as a function of wavelength. Values are averages for the December 16–22, 2016 haze event.
In summary, we have shown evidence from field observations in a Beijing haze event that FF-POA is rapidly oxidized in the aqueous phase under high-humidity conditions to produce aq-SOA. The evidence suggests that this aq-SOA formation involves aqueous-phase oxidation of primary aromatic compounds with ring breaking and functionalization to water-soluble organic species including carbonyls, alcohols, and carboxylic acids. aq-SOA is much less light absorbing than its primary precursor, consistent with a decrease in aromaticity. These results provide an explanation for the observed dominance of highly oxidized SOA in Beijing haze despite the large primary source of OA from FF. They also explain why SOA concentrations decreased over the 2013–2018 period even as VOC emissions stayed flat. Although the mechanism involved remains uncertain, the conversion of FF-POA to aq-SOA could be parametrized in models as a function of relative humidity. The bleaching associated with aq-SOA formation has possibly important implications for aerosol climate forcing and for understanding pollution-weather feedbacks, including in particular the suppression of vertical mixing by PM (55).
Materials and Methods
Sampling Site.
The field campaign was conducted at the Tower Site of the Institute of Atmospheric Physics (IAP), Chinese Academy of Science (39°58′ N, 116°22′ E) in Beijing, China from December 1–22, 2016. The first 15 d had variable conditions. We report results for the haze event of December 16–22. The site is located near the third ring road in northern Beijing, surrounded by residential infrastructure and an arterial road to the east (360 m). Measurements were made from a rooftop laboratory 8 m above ground. There was no interference from neighboring buildings.
OA Measurements.
An Aerodyne SP-AMS was deployed during the field campaign to obtain chemical composition and size distributions of submicrometer BC-PM1. The tungsten vaporizer was removed from the SP-AMS so that its laser vaporizer selectively heated the BC core. In this way, the chemical species coating BC core particles were evaporated gradually. Another standard AMS (Aerodyne HR-AMS) was deployed concurrently to measure the chemical composition of NR-PM1. A shared PM2.5 cyclone inlet (model URG-2000–30ED) and a diffusion dryer were used before the sampling. Detailed information on the operation of SP-AMS during the sampling campaign can be found in previous literature (30). A relative ionization efficiency of 1.4 was applied to PAH-like compounds (23).
OA PMF Analysis.
PMF was performed on the high-resolution mass spectral matrices of BC-PM1 and NR-PM1 across m/z 12–298 (26, 30). The PMF analysis was applied on the full December 1–22 dataset. H/C to O/C ratios were calculated from the SP-AMS measurements using the “Improved-Ambient” method with scaling factors of 1.10 for H:C and 0.89 for O:C by Ma et al. (31, 48, 56).
We determined that the PAH signatures in Fig. 2 are not artifacts of the PMF analysis. The five-factor solution shown in Fig. 2 represents the optimal results. However, other PMF solutions (four-factor and six-factor solutions as well as the key diagnostic plots) were also examined (SI Appendix, Figs. S7–S9). MD-OOA is not separated in the four-factor results. For the six-factor solutions, FF-POA is split into two factors (factor 5 and factor 6, which both show significant PAHs-like signals, e.g., m/z 115). An aq-SOA factor with PAH signatures (factor 1 in both SI Appendix, Figs. S7 and S8) was resolved in all solutions.
Measurement of Aerosol Optical Properties.
Aerosol light absorption for PM2.5 was measured with a seven-wavelength aethalometer (Magee Scientific, model AE33) at 370, 470, 520, 590, 660, 880, and 950 nm. Ambient air was drawn through a 2.5-µm cutoff inlet at 2 L min−1 before entering the aethalometer. Particles were collected on the filter substrate, and light attenuation at the seven wavelengths was recorded continuously. A diffusion dryer reduced the relative humidity of the sampled air to below 30%.
The aethalometer measurements provide the PM2.5 absorption coefficient bPM2.5(λ) [m−1] representing the PM2.5 optical depth from absorption per unit length along the light path at wavelength λ. The loading effect of aethalometer measurement was corrected by applying the dual-spot compensation algorithm (57, 58). In addition, light absorption was further corrected by the multiple scattering scale factor (a value of 2.29) obtained from the comparison between the aethalometer measurement (880 nm) and the Photoacoustic Extinctiometer measurement (870 nm) as shown in SI Appendix, Fig. S10. We assume that the absorption is due solely to BC (bPM2.5, BC) and to OA (bPM2.5, OA). The absorption coefficients are additive and therefore
| [1] |
The contribution from BC can be inferred by assuming that it is the sole absorber at 880 and 950 nm (44), and using the Angstrom absorbing exponent (AAE) to infer its absorption at wavelength λ. AAE is the argument of the negative power-law dependence of absorption on wavelength. Thus we have
| [2] |
and obtain from the equality
| [3] |
The absorption coefficient of OA in BC-PM1 can then be inferred from that in PM2.5 by scaling to the corresponding OA concentrations:
| [4] |
where and are the concentrations of OA in BC-PM1 and PM2.5, respectively. We estimate based on the organic carbon concentration measured by a Sunset organic carbon and elemental carbon (OC-EC) analyzer and an OA/OC mass ratio of 1.92 (12).
The MACs of total BC-PM1 OA and each PMF-resolved OA component at different wavelengths are calculated by
| [5] |
where [OA] is the mass concentration of total or individual OA species.
Multiple-linear regression was applied to the analysis of light absorption of different BC-PM1 OA components at each wavelength (i.e., 370, 470, 520, 590, and 660 nm) (58, 59):
| [6] |
where constants a–e are the fitting parameters that represent the light-absorption coefficient of individual OA species. The a–e values at different wavelengths are shown in Fig. 5 as MAC values. The coefficients of determination of the obtained a–e values were all greater than 0.94.
Supplementary Material
Acknowledgments
This work is a contribution from the Harvard-Nanjing University of Information Science and Technology (NUIST) Joint Laboratory for Air Quality and Climate. We acknowledge support from the National Key Research and Development Program of China (Grant 2018YFC0213802), the National Natural Science Foundation of China (Grants 91544220, 21777073, 91744207, 42021004, and 41875167), and the Samsung Advanced Institute of Technology.
Footnotes
The authors declare no competing interest.
This article is a PNAS Direct Submission.
This article contains supporting information online at https://www.pnas.org/lookup/suppl/doi:10.1073/pnas.2022179118/-/DCSupplemental.
Data Availability
Datasets including time series of species concentrations and meteorological variables during the campaign have been deposited in AQSOA_dataset (https://dataverse.harvard.edu/dataset.xhtml?persistentId=doi:10.7910/DVN/MHITWI).
References
- 1.Zhang Q., et al., Ubiquity and dominance of oxygenated species in organic aerosols in anthropogenically-influenced Northern Hemisphere midlatitudes. Geophys. Res. Lett. 34, L13801 (2007). [Google Scholar]
- 2.Huang R.-J., et al., High secondary aerosol contribution to particulate pollution during haze events in China. Nature 514, 218–222 (2014). [DOI] [PubMed] [Google Scholar]
- 3.Shrivastava M., et al., Urban pollution greatly enhances formation of natural aerosols over the Amazon rainforest. Nat. Commun. 10, 1046 (2019). [DOI] [PMC free article] [PubMed] [Google Scholar]
- 4.Kourtchev I., et al., Enhanced Volatile Organic Compounds emissions and organic aerosol mass increase the oligomer content of atmospheric aerosols. Sci. Rep. 6, 35038 (2016). [DOI] [PMC free article] [PubMed] [Google Scholar]
- 5.Ervens B., Turpin B. J., Weber R. J., Secondary organic aerosol formation in cloud droplets and aqueous particles (aqSOA): A review of laboratory, field and model studies. Atmos. Chem. Phys. 11, 11069–11102 (2011). [Google Scholar]
- 6.McNeill V. F., Aqueous organic chemistry in the atmosphere: Sources and chemical processing of organic aerosols. Environ. Sci. Technol. 49, 1237–1244 (2015). [DOI] [PubMed] [Google Scholar]
- 7.Sun Y. L., Zhang Q., Anastasio C., Sun J., Insights into secondary organic aerosol formed via aqueous-phase reactions of phenolic compounds based on high resolution mass spectrometry. Atmos. Chem. Phys. 10, 4809–4822 (2010). [Google Scholar]
- 8.McNeill V. F., et al., Aqueous-phase secondary organic aerosol and organosulfate formation in atmospheric aerosols: A modeling study. Environ. Sci. Technol. 46, 8075–8081 (2012). [DOI] [PubMed] [Google Scholar]
- 9.Ge X., Setyan A., Sun Y., Zhang Q., Primary and secondary organic aerosols in Fresno, California during wintertime: Results from high resolution aerosol mass spectrometry. J. Geophys. Res. Atmos. 117, D19301 (2012). [Google Scholar]
- 10.Kim H., et al., Chemical processing of water-soluble species and formation of secondary organic aerosol in fogs. Atmos. Environ. 200, 158–166 (2019). [Google Scholar]
- 11.Marais E. A., et al., Aqueous-phase mechanism for secondary organic aerosol formation from isoprene: Application to the Southeast United States and co-benefit of SO2 emission controls. Atmos. Chem. Phys. 16, 1603–1618 (2016). [DOI] [PMC free article] [PubMed] [Google Scholar]
- 12.Wang J., et al., Fast sulfate formation from oxidation of SO2 by NO2 and HONO observed in Beijing haze. Nat. Commun. 11, 2844 (2020). [DOI] [PMC free article] [PubMed] [Google Scholar]
- 13.Zhang Y. L., et al., Large contribution of fossil fuel derived secondary organic carbon to water soluble organic aerosols in winter haze in China. Atmos. Chem. Phys. 18, 4005–4017 (2018). [Google Scholar]
- 14.Sun Y., et al., Primary and secondary aerosols in Beijing in winter: Sources, variations and processes. Atmos. Chem. Phys. 16, 8309–8329 (2016). [Google Scholar]
- 15.Xu W., et al., Mass spectral characterization of primary emissions and implications in source apportionment of organic aerosol. Atmos. Meas. Tech. 13, 3205–3219 (2020). [Google Scholar]
- 16.Dzepina K., et al., Detection of particle-phase polycyclic aromatic hydrocarbons in Mexico City using an aerosol mass spectrometer. Int. J. Mass Spectrom. 263, 152–170 (2007). [Google Scholar]
- 17.Wu Y., et al., Characterization of size-resolved hygroscopicity of black carbon-containing particle in urban environment. Environ. Sci. Technol. 53, 14212–14221 (2019). [DOI] [PubMed] [Google Scholar]
- 18.Zhang R., et al., Variability in morphology, hygroscopicity, and optical properties of soot aerosols during atmospheric processing. Proc. Natl. Acad. Sci. U.S.A. 105, 10291–10296 (2008). [DOI] [PMC free article] [PubMed] [Google Scholar]
- 19.Liu D., et al., Ambient black carbon particle hygroscopic properties controlled by mixing state and composition. Atmos. Chem. Phys. 13, 2015–2029 (2013). [Google Scholar]
- 20.Qiu Y., et al., Vertical characterization and source apportionment of water-soluble organic aerosol with high-resolution aerosol mass spectrometry in beijing, china. ACS Earth Space Chem. 3, 273–284 (2019). [Google Scholar]
- 21.Lei L., et al., Long-term characterization of aerosol chemistry in cold season from 2013 to 2020 in Beijing, China. Environ. Pollut. 268, 115952 (2021). [DOI] [PubMed] [Google Scholar]
- 22.Zheng B., et al., Trends in China’s anthropogenic emissions since 2010 as the consequence of clean air actions. Atmos. Chem. Phys. 18, 14095–14111 (2018). [Google Scholar]
- 23.Onasch T. B., et al., Soot particle aerosol mass spectrometer: Development, validation, and initial application. Aerosol Sci. Technol. 46, 804–817 (2012). [Google Scholar]
- 24.Sun Y., et al., Chemical differences between PM1 and PM2.5 in highly polluted environment and implications in air pollution studies. Geophys. Res. Lett. 47, e2019GL086288 (2020). [Google Scholar]
- 25.Zhang Q., et al., Understanding atmospheric organic aerosols via factor analysis of aerosol mass spectrometry: A review. Anal. Bioanal. Chem. 401, 3045–3067 (2011). [DOI] [PMC free article] [PubMed] [Google Scholar]
- 26.Zhao J., et al., Organic aerosol processing during winter severe haze episodes in Beijing. J. Geophys. Res. Atmos. 124, 10248–10263 (2019). [Google Scholar]
- 27.Xu W., et al., Effects of aqueous-phase and photochemical processing on secondary organic aerosol formation and evolution in Beijing, China. Environ. Sci. Technol. 51, 762–770 (2017). [DOI] [PubMed] [Google Scholar]
- 28.Wu Y., et al., Responses of secondary aerosols to relative humidity and photochemical activities in an industrialized environment during late winter. Atmos. Environ. 193, 66–78 (2018). [Google Scholar]
- 29.Xu W., et al., Summertime aerosol volatility measurements in Beijing, China. Atmos. Chem. Phys. 19, 10205–10216 (2019). [Google Scholar]
- 30.Wang J., et al., Characterization of black carbon-containing fine particles in Beijing during wintertime. Atmos. Chem. Phys. 19, 447–458 (2019). [Google Scholar]
- 31.Canagaratna M. R., et al., Chemical compositions of black carbon particle cores and coatings via soot particle aerosol mass spectrometry with photoionization and electron ionization. J. Phys. Chem. A 119, 4589–4599 (2015). [DOI] [PubMed] [Google Scholar]
- 32.Massoli P., et al., Characterization of black carbon-containing particles from soot particle aerosol mass spectrometer measurements on the R/V Atlantis during CalNex 2010. J. Geophys. Res. Atmos. 120, 2014JD022834 (2015). [Google Scholar]
- 33.Xu W., et al., Changes in aerosol chemistry from 2014 to 2016 in winter in Beijing: Insights from high‐resolution aerosol mass spectrometry. J. Geophys. Res. Atmos. 124, 1132–1147 (2019). [Google Scholar]
- 34.Heald C. L., et al., A simplified description of the evolution of organic aerosol composition in the atmosphere. Geophys. Res. Lett. 37, L08803 (2010). [Google Scholar]
- 35.Ng N. L., et al., Changes in organic aerosol composition with aging inferred from aerosol mass spectra. Atmos. Chem. Phys. 11, 6465–6474 (2011). [Google Scholar]
- 36.Gilardoni S., et al., Direct observation of aqueous secondary organic aerosol from biomass-burning emissions. Proc. Natl. Acad. Sci. U.S.A. 113, 10013–10018 (2016). [DOI] [PMC free article] [PubMed] [Google Scholar]
- 37.Young D. E., et al., Influences of emission sources and meteorology on aerosol chemistry in a polluted urban environment: Results from DISCOVER-AQ California. Atmos. Chem. Phys. 16, 5427–5451 (2016). [Google Scholar]
- 38.Lee A. K. Y., et al., Formation of secondary organic aerosol coating on black carbon particles near vehicular emissions. Atmos. Chem. Phys. 17, 15055–15067 (2017). [Google Scholar]
- 39.Kautzman K. E., et al., Chemical composition of gas- and aerosol-phase products from the photooxidation of naphthalene. J. Phys. Chem. A 114, 913–934 (2010). [DOI] [PubMed] [Google Scholar]
- 40.Huang D. D., et al., Formation and evolution of aqSOA from aqueous-phase reactions of phenolic carbonyls: Comparison between ammonium sulfate and ammonium nitrate solutions. Environ. Sci. Technol. 52, 9215–9224 (2018). [DOI] [PubMed] [Google Scholar]
- 41.Wang S., et al., Aromatic photo-oxidation, A new source of atmospheric acidity. Environ. Sci. Technol. 54, 7798–7806 (2020). [DOI] [PubMed] [Google Scholar]
- 42.Hu W. W., et al., Insights on organic aerosol aging and the influence of coal combustion at a regional receptor site of central eastern China. Atmos. Chem. Phys. 13, 10095–10112 (2013). [Google Scholar]
- 43.Hems R. F., Abbatt J. P. D., Aqueous phase photo-oxidation of brown carbon nitrophenols: Reaction kinetics, mechanism, and evolution of light absorption. ACS Earth Space Chem. 2, 225–234 (2018). [Google Scholar]
- 44.Chen C.-L., Li L., Tang P., Cocker D. R., SOA formation from photooxidation of naphthalene and methylnaphthalenes with m-xylene and surrogate mixtures. Atmos. Environ. 180, 256–264 (2018). [Google Scholar]
- 45.Al-Naiema I. M., et al., Secondary organic aerosols from aromatic hydrocarbons and their contribution to fine particulate matter in Atlanta, Georgia. Atmos Environ (1994) 223, 117227 (2020). [DOI] [PMC free article] [PubMed] [Google Scholar]
- 46.Chan A. W. H., et al., Secondary organic aerosol formation from photooxidation of naphthalene and alkylnaphthalenes: Implications for oxidation of intermediate volatility organic compounds (IVOCs). Atmos. Chem. Phys. 9, 3049–3060 (2009). [Google Scholar]
- 47.Zhao N., Zhang Q., Wang W., Atmospheric oxidation of phenanthrene initiated by OH radicals in the presence of O2 and NOx–A theoretical study. Sci. Total Environ. 563-564, 1008–1015 (2016). [DOI] [PubMed] [Google Scholar]
- 48.Canagaratna M. R., et al., Elemental ratio measurements of organic compounds using aerosol mass spectrometry: characterization, improved calibration, and implications. Atmos. Chem. Phys. 15, 253–272 (2015). [Google Scholar]
- 49.Yu L., et al., Chemical characterization of SOA formed from aqueous-phase reactions of phenols with the triplet excited state of carbonyl and hydroxyl radical. Atmos. Chem. Phys. 14, 13801–13816 (2014). [Google Scholar]
- 50.Huang X.et al., Enhanced secondary pollution offset reduction of primary emissions during COVID-19 lockdown in China. Natl. Sci. Rev. 7, 1–9 (2020). [DOI] [PMC free article] [PubMed] [Google Scholar]
- 51.Ye Z., et al., Aqueous-phase oxidation of three phenolic compounds by hydroxyl radical: Insight into secondary organic aerosol formation yields, mechanisms, products and optical properties. Atmos. Environ. 223, 117240 (2020). [Google Scholar]
- 52.Forrister H., et al., Evolution of brown carbon in wildfire plumes. Geophys. Res. Lett. 42, 4623–4630 (2015). [Google Scholar]
- 53.Yan C.et al., Molecular characterization of water-soluble brown carbon chromophores in Beijing, China. J. Geophys. Res. Atmos. 125, e2019JD032018 (2020). [Google Scholar]
- 54.Hems R. F., et al., Aqueous photoreactions of wood Smoke Brown carbon. ACS Earth Space Chem. 4, 1149–1160 (2020). [Google Scholar]
- 55.Li Z., et al., Aerosol and boundary-layer interactions and impact on air quality. Natl. Sci. Rev. 4, 810–833 (2017). [Google Scholar]
- 56.Ma M., et al., Elemental analysis of oxygenated organic coating on black carbon particles using a soot-particle aerosol mass spectrometer. Atmos. Meas. Tech. Discuss. 2020, 1–25 (2020). [Google Scholar]
- 57.Drinovec L., et al., The “dual-spot” Aethalometer: An improved measurement of aerosol black carbon with real-time loading compensation. Atmos. Meas. Tech. 8, 1965–1979 (2015). [Google Scholar]
- 58.Xie C., et al., Vertical characterization of aerosol optical properties and brown carbon in winter in urban Beijing, China. Atmos. Chem. Phys. 19, 165–179 (2019). [Google Scholar]
- 59.Qin Y. M., et al., Chemical characteristics of brown carbon in atmospheric particles at a suburban site near Guangzhou, China. Atmos. Chem. Phys. 18, 16409–16418 (2018). [Google Scholar]
Associated Data
This section collects any data citations, data availability statements, or supplementary materials included in this article.
Supplementary Materials
Data Availability Statement
Datasets including time series of species concentrations and meteorological variables during the campaign have been deposited in AQSOA_dataset (https://dataverse.harvard.edu/dataset.xhtml?persistentId=doi:10.7910/DVN/MHITWI).