Abstract
Background
Red blood cells (RBCs) stored for transfusions can lyse over the course of the storage period. The lysis is traditionally assumed to occur via the formation of spiculated echinocyte forms, so that cells that appear smoother are assumed to have better storage quality. We investigate this hypothesis by comparing the morphological distribution to the hemolysis for samples from different donors.
Methods
Red cell concentrates were obtained from a regional blood bank quality control laboratory. Out of 636 units processed by the laboratory, we obtained 26 high hemolysis units and 24 low hemolysis units for assessment of RBC morphology. The association between the morphology and the hemolysis was tested with the Wilcoxon-Mann-Whitney U test.
Results
Samples with high stomatocyte counts (p = 0.0012) were associated with increased hemolysis, implying that cells can lyse via the formation of stomatocytes.
Conclusion
RBCs can lyse without significant echinocyte formation. Lower degrees of spiculation are not a good indicator of low hemolysis when RBCs from different donors are compared.
Keywords: Storage, Erythrocytes, Lipid bilayers, MALDI, Hemoglobin
Introduction
Red blood cells (RBCs) that are stored for transfusions undergo a number of changes during the storage period, culminating in lysis of a proportion of the cells. The extent of the hemolysis is used as the primary marker to determine if RBCs are suitable for transfusion, but additional markers can be used to obtain a more complete picture of the state of the RBCs. These markers include the levels of metabolites such as ATP, the extent of protein oxidation, the extracellular pH and potassium concentrations, and also the cell morphology, which is the focus of the current work.
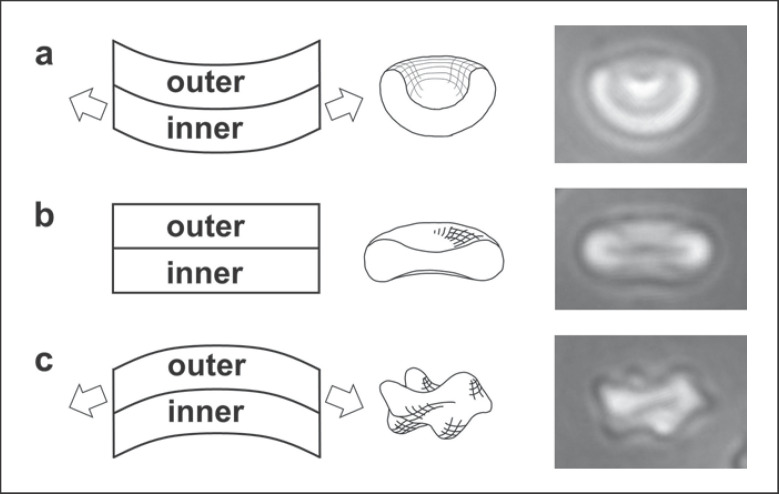
Healthy RBCs in vivo have a smooth biconcave disc shape that can be lost as the cells age during storage. Depletion of ATP levels that occurs as RBCs are stored is associated with the formation of bumpy echinocytes [1], possibly in association with the decrease in the activity of the ATP-dependent systems that maintain the lipid asymmetry of the cell membrane [2]. The formation of the echinocytes is associated with the expansion of the outer leaflet of the cell membrane relative to the inner leaflet, which drives the formation of the convex bumps, as illustrated in Figure 1 [3, 4]. Multiple factors in addition to ATP depletion can drive the formation of echinocytes, including increased pH, the addition of compounds that insert selectively into the outer membrane leaflet, increased concentration of many salts, and mechanical force acting directly on individual cells [3, 5, 6, 7, 8]. Conversely, many agents can drive the RBC shape in the direction opposite to echinocyte formation by expanding the inner leaflet of the membrane relative to the outer leaflet (Fig. 1), thus leading to the formation of stomatocytes. Stomatogenic agents include decreased pH [7, 9], agents that insert selectively into the inner leaflet [3], albumin, which extracts lipids from the outer leaflet [10, 11, 12], and the plasticiser that leaches out of standard transfusion bags and which may promote scrambling of lipids from the two membrane leaflets [13].
Fig. 1.
Formation of stomatocytes and echinocytes in association with changes in the relative areas of the inner and outer leaflets of the RBC membrane, showing formation of a stomatocyte as the inner leaflet expands relative to the outer leaflet (a), a discocyte, when the two leaflets are at the preferred area difference to give the minimum membrane energy (b), and formation of the convex bumps of echinocytes when the outer leaflet expands relative to the inner leaflet (c).
The goal of the work presented here is to compare the distribution of cell shapes at the end of the storage period to the extent of the hemolysis. This is done using groups of high and low hemolysis samples that have been identified and collected from different donors. One of the important questions about hemolysis is the extent to which its variation depends on the donor [14, 15, 16, 17]. Observation of RBCs from a group of donors makes it possible to evaluate the link between inter-donor variability in the hemolysis and the RBC morphology, thus providing a simple approach towards a complex question.
Materials and Methods
Blood Samples
Blood samples were obtained from the quality control laboratory that monitors 1% of transfusion bags of RBCs collected and processed by the German Red Cross Blood Service, Baden-Württemberg/Hessen, Germany. Bags with Rh-positive and type A or AB blood were selected randomly for monitoring, with the hemolysis being measured the week of the expiry date: free hemoglobin (Hb) is measured according to Harboe following the kit manufacturer's directions (Bioanalytic) and the hemolysis is calculated using hematocrit values obtained from a CELL-DYN Ruby hematology analyzer (Abbott Diagnostics). Samples with the highest and lowest hemolysis values at 42 days were selected each week for 5 weeks, providing one set of 24 low hemolysis samples and a second set of 26 high hemolysis samples out of a total of 636 units assessed for hemolysis. Of this total, 404 were from male donors and 232 from female donors.
The RBC concentrates (RCCs) were prepared from whole blood anticoagulated with ACD (acid citrate dextrose solution; collection endpoint set by weight to maintain the ratio of ACD to collected blood) and processed by buffy coat removal and leukocyte filtration. The RCCs thus produced were stored at 2–6°C in PAGGSM (phosphate-adenine-glucose-guanosine-saline-mannitol) within polyvinyl chloride storage bags (Fresenius or Macopharma).
Observation of RBCs for Morphological Analysis
The morphology of the high and low hemolysis groups was assessed at 42 ± 3 days (average ± SD), within 2 days of the hemolysis measurements. The RBCs were stored in the transfusion bags used for collection until the day of the morphology measurements. The RBCs were observed after rinsing in phosphate-buffered saline (from tablets, VWR) on an adhesive polymer layer as described previously [13, 18] using a phase-contrast microscope (Zeiss Axiovert A1 with a 40× objective, NA = 0.55) and a Zeiss AxioCam ICc1 camera. Details of slide preparation are described in the online supplementary material (for all online suppl. material, see www.karger.com/doi/10.1159/000508711). For each sample, an initial field was selected near the central point of the slide; two fields were selected on one side of this point and two fields were selected on the opposite side. Sample unmodified images showing the whole field of view are shown in online supplementary Figures S1–S3. In every case, the five non-overlapping views provided a total of more than 100 cells, the count in similar determinations of morphological index (MI) [19] while avoiding the unconscious personal bias introduced by detailed observation of a sequence of cells, selected and then terminated by a stopping rule (i.e., “stop at 100 cells”).
MI Calculation and Counts
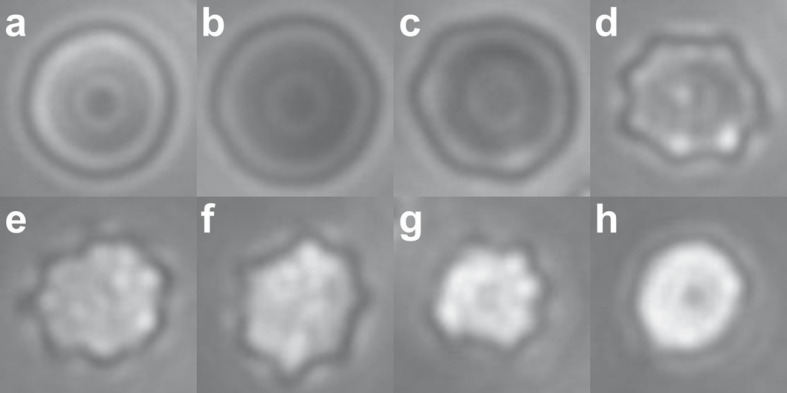
The cell shapes were separated into the following categories, as illustrated in Figure 2: stomatocytes; discocytes; type I echinocytes with ripples around the edge but no bumps on the top surface; type II echinocytes, with small numbers of large spicules; type III echinocytes, which included all other spiculated cells. Cells were more likely to adsorb as shown in Figure 2, but some cells adsorbed edgewise, as shown in online supplementary Figures S1–S3. Early-stage stomatocytes that adsorbed as shown in Figure 2a were identified based on work reported elsewhere, in which individual cells were rotated to show the cup-shaped profile and then the top view [13]. The morphological counts required identification of the top views of cells, but these were always supported by the presence of the more typical views of stomatocytes, including cells that had adsorbed edgewise to show the cup-shape of early-stage stomatocytes, and also later-stage stomatocytes showing a central linear slit, as illustrated in online supplementary Figure S3. In some cases, it was not possible to differentiate between late-stage echinocytes and late-stage stomatocytes; in these cases, cells were counted as type III echinocytes. The average number of cells counted per sample was 428.
Fig. 2.
Cell shapes and the corresponding values used for the MI calculations: stomatocyte (S), −1 (a); discocyte (D), 0 (b); echinocyte I (E I), 0.5 (c); echinocyte II (E II), 1 (d); echinocyte III (E III), 3 (e–h). These values are compared to literature values in the Materials and Methods section. The images shown here are cropped selections from the larger fields of view used for the morphological analysis, as shown in online supplementary Figures S1–S3. The focal plane of the images is near the boundary of the cells in b and c. As the cells become rounder (e–h), features move out of the focal plane, and also become too fine to resolve (h). The stomatocytes are distinguished by the brighter ring surrounding the central spot, in addition to their smaller diameter.
MI scores were assigned to the different shape categories as indicated in Figure 2. The MI was then calculated as the average for all the cells counted in each sample. The MI scores assigned to the discocyte, stomatocyte, and the stage II echinocyte shown in Figure 2 correspond to the MI scores that have been used elsewhere for these shapes [20]. The score of 0.5 is assigned here to the type I echinocytes in Figure 2c, which are intermediate between the discocytes at MI = 0 and the echinocytes at MI = 1. The cells classified as stage III echinocytes have been described elsewhere as having MI values ranging from 2 to 5 [20]; they have been grouped together here because it is not possible to separate them reliably into specific categories. The shape shown in Figure 2g corresponds to the shape that has been assigned elsewhere to MI = 3 [20].
Preparation of RBC Ghosts for Mass Spectrometry
Packed RBCs at the end of the storage period were collected and centrifuged briefly (2 min at 300 g) to separate the cells; 300 µL of the packed RBCs was then collected and washed 4 times in water, with centrifugation for 10 min at 2,500 g. The water wash served the dual purpose of lysing the cells and also lowering the salt content for the MALDI-ToF analysis (matrix assisted laser desorption ionization-time of flight mass spectrometry). After the final wash, 100 µL of the pellet was collected and frozen. Samples were then thawed for the MALDI-ToF.
Mass Spectrometry
The relative amounts of POPC (palmitoyloleoyl-phosphatidylcholine) and membrane-adsorbed Hb in the RBC ghosts were determined by MALDI-ToF mass spectrometry, as described in the online supplementary material. The POPC is a membrane phospholipid present in relatively high amounts and is used here as an indicator for the amount of membrane lipid present.
Statistical Analysis
The sample sets obtained as described above resulted in one set of low hemolysis samples (0.07% ≤ hemolysis ≤0.15%; average hemolysis ± SD = 0.11 ± 0.02%) and one set of high hemolysis samples (0.50% ≤ hemolysis ≤1.20%; average = 0.76 ± 0.20%). We inferred systematic differences between low- and high-hemolysis samples, if any, by calculating two-sided p values for Wilcoxon-Mann-Whitney U statistics on the Vassar website (http://vassarstats.net/utest.html). The uncorrected p values from the site are reported before any correction for multiple testing. Eleven p value tests were performed if we consider all graphs in the online supplementary material, so under a Bonferroni correction for multiple testing (which corrects for the increased probability of having a false positive if many tests are performed), we considered an uncorrected p value <0.05/11 = 0.0045 as significant, corresponding to a false positive probability (type I error rate) α = 0.05.
Results
Distribution of Cell Shapes and Statistical Analysis
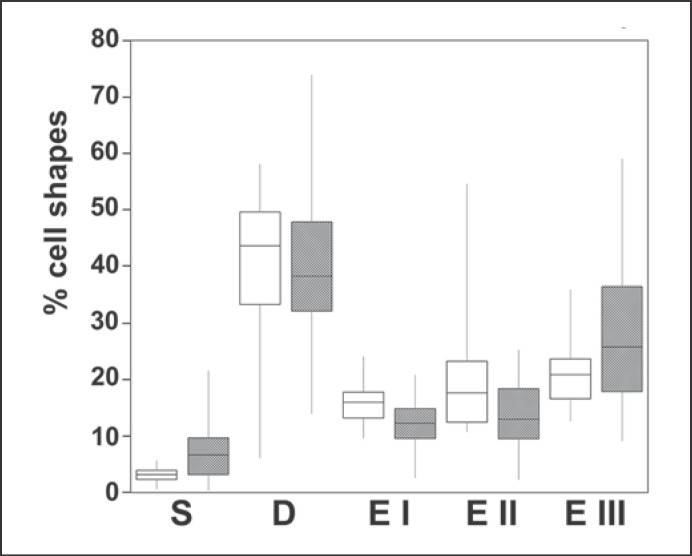
Figure 3 shows the relative numbers of cells in the five shape categories outlined in Figure 2, for both the high and the low hemolysis groups. The discocyte counts are fairly similar for samples from both groups. The high and low hemolysis groups differ at the ends of the shape scale; both the stomatocyte counts (p = 0.0012, significant) and the later-stage echinocyte EIII counts (p = 0.049, not significant after a Bonferroni correction for multiple testing) are higher for cells with high hemolysis. The statistical analysis therefore shows that samples with high lysis have high stomatocyte counts, beyond chance alone. High stomatocyte counts were more indicative of high hemolysis than were high counts of type III echinocytes: it was possible for samples to have a high type III echinocyte count while still having a low hemolysis, but all samples with high (≥6%) stomatocytes also had high hemolysis (see also online suppl. Fig. S4). The numbers of cells in the different shape categories are also summarized in online supplementary Table 1.
Fig. 3.
Distribution of cell shapes for the low hemolysis group (white boxes) and the high hemolysis group (shaded boxes). S, stomatocytes; D, discocytes; E I, II and III, echinocytes I, II and III (as defined in Fig. 2). The mid-line of the boxes indicates the median, the top and bottom ends indicate the quartiles, and the whiskers show the maximum and minimum values. The stomatocyte counts are significantly higher for the high hemolysis group (p = 0.0012); the type III echinocytes are also higher for this group, but at p = 0.049, with a difference that becomes insignificant after the correction for multiple testing (for discussion of the statistical analysis, see text). The type I echinocytes are lower for the high hemolysis group (p = 0.0019); the type II echinocytes are slightly lower, but not significantly so (p = 0.018); the discocytes are present at similar levels in both groups (p = 0.401).
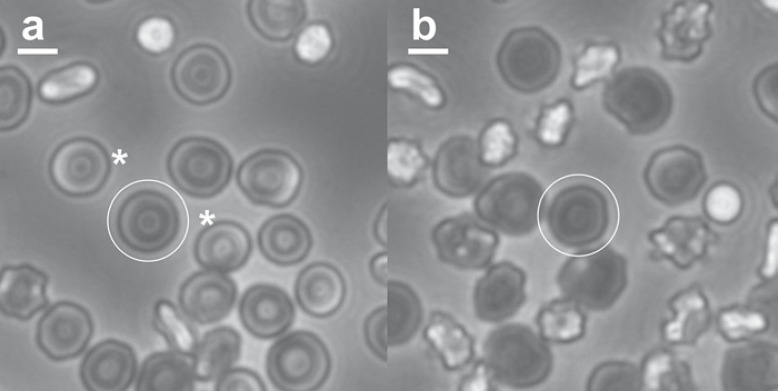
Figure 4 shows examples of the morphology at the end of the storage period for cells from different donors, and serves to illustrate the points made by the statistical analysis described above. One donor with a high stomatocyte count and a low MI had 1.2% hemolysis, the highest hemolysis observed of all the samples, and above the permitted limit for transfusions (typically 0.8 or 1%, depending on jurisdiction). The second example, with moderately high echinocyte counts and a high MI, had 0.09% hemolysis, close to the minimum value observed here (which was 0.07%, out of the 636 samples assessed). Details of the cell counts are given in the figure legend.
Fig. 4.
RBC morphology at the end of the storage period for a sample with high stomatocyte counts, low type III echinocytes, low MI, and high hemolysis (16.9, 13.2, 0.37, and 1.2%, respectively; a), and a sample with low stomatocyte counts, high echinocyte counts, high MI, and low hemolysis (1.0, 25.8, 1.11, and 0.09%, respectively; b). Scale bars, 5 µm. The full fields of view for a and b are shown in online supplementary Figures S1 and S2. Representative discocytes are circled on both images; representative stomatocytes on either side of the circled discocyte in a are indicated by asterisks.
Figure 5 illustrates the range of shapes that can be present in single samples: cells from a high stomatocyte sample show a range of stomatocyte shapes, and cells from a high echinocyte sample show a corresponding range of echinocyte shapes.
Fig. 5.
Samples can show a range of different RBC morphologies. a Stomatocytes from a single sample. b Echinocytes from a single sample. RBCs are initially discocytes, and can form increasingly rounded stomatocytes, or increasingly rounded echinocytes. Each set here was taken from a single field of view image, as illustrated in online supplementary Figures S2 and S3.
MI Scores
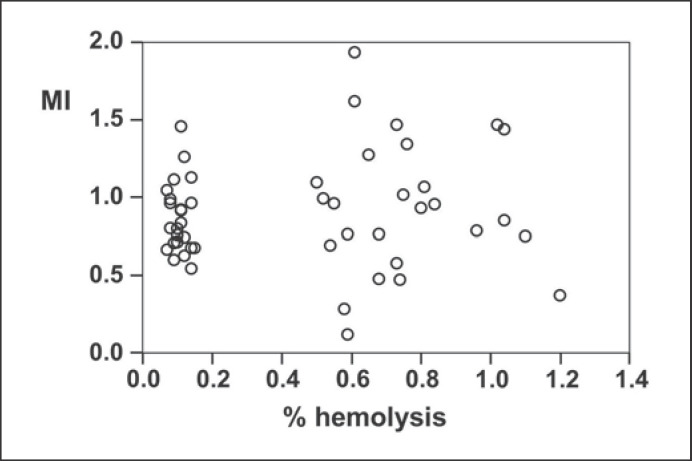
The MI scores are shown in Figure 6. The low hemolysis group can be identified as a well-defined cluster, while the high hemolysis group had a greater range of hemolysis values. The low hemolysis group of samples had a somewhat smaller distribution of MI values, but the same average as the high hemolysis group (MI = 0.91 ± 0.44 for the high hemolysis group; MI = 0.87 ± 0.22 for the low hemolysis group).
Fig. 6.
MI for RBCs as a function of hemolysis at the end of the storage period. The low and high hemolysis groups of samples can be clearly distinguished by the hemolysis values. The average hemolysis ± SD was 0.11 ± 0.02% for the low hemolysis samples, and 0.76 ± 0.20% for the high hemolysis group. The MI values, however, are similar for both groups (0.87 ± 0.22 for the low hemolysis group and 0.91 ± 0.44 for the high hemolysis group).
POPC Content and Adsorbed Hb in RBC Ghosts
Mass spectrometry was used to determine the relative amounts of adsorbed Hb for the different samples, and also the relative amounts of POPC, the most readily identifiable lipid peak. The MALDI-ToF measurements provide an m/z value (mass over charge) together with a peak intensity. Samples can be identified by the presence of peaks at known mass values. The measurements are semiquantitative: if samples are processed in the same way, as were the ones in these experiments, then the relative peak heights can be used to determine the relative concentrations of analytes of interest in the different samples.
In the m/z range of 10–50 kDa, the protein peaks identified were from Hb. The full-range spectrum is shown in online supplementary Figure S5. No other protein peaks were identified, although other proteins were present in the preparation, as identified by SDS-PAGE (online suppl. Fig. S6). The Hbα and Hbβ subunit monomers were identified (online suppl. Fig. S7), as was the Hbα-Hbβ dimer (online suppl. Fig. S8), the Hb trimer, and the doubly charged trimer (online suppl. Fig. S9). Hb is known to bind to the membrane of ageing RBCs [21, 22]. The POPC was identified by the parent ion peak at the expected value of 760.59.
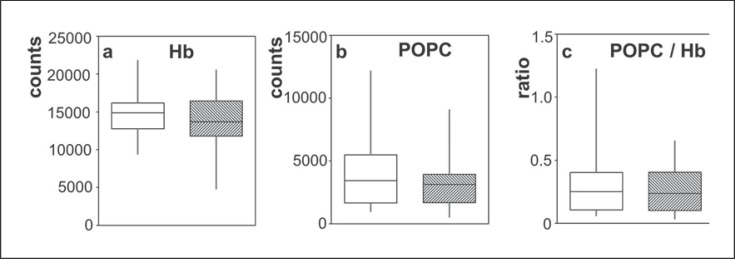
The Hb content, POPC content, and the ratio of the POPC and Hb signals (using the Hbα monomer) were compared for the high and low hemolysis groups, as shown in Figure 7. The two-sided Mann-Whitney U test showed no significant link between hemolysis levels and the Hb, POPC, or the ratio (p = 0.48, 0.40, and 0.60, respectively). Similar results were obtained for all the other peaks associated with Hb (online suppl. Fig. S10).
Fig. 7.
Relative amounts of hemoglobin and POPC measured by MALDI-ToF for the low hemolysis group (white boxes) and the high hemolysis group (shaded boxes). The mid-line, top and bottom ends of the boxes, and whiskers are as described for Figure 3. The Hb was determined using the peak for the Hbα monomer. Relative amounts of the Hb dimer, trimer, and doubly charged trimer are compared for the high and low hemolysis groups in online supplementary Figure S10.
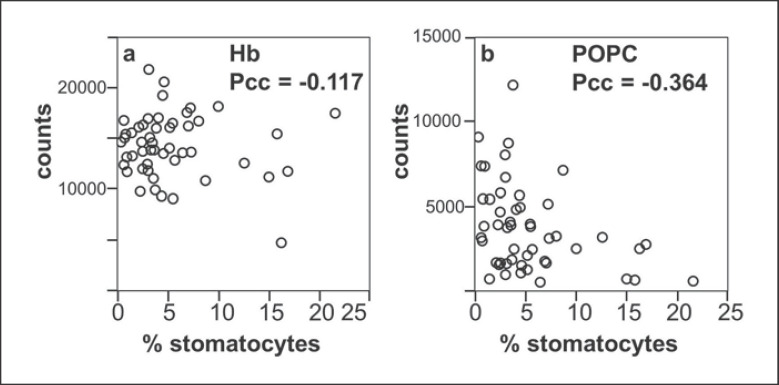
Figure 8 compares the relative amounts of Hb and POPC to the stomatocyte counts. The Pearson correlation coefficients in Figure 8 show little correlation between adsorbed Hb and the stomatocyte numbers. There is a weak negative correlation between the POPC content and the formation of stomatocytes which rests on relatively few points (the high stomatocyte counts with high leverage, to the lower right of the plot). These results are also presented in online supplementary Figure S11 as a box plot for direct comparison to Figure 7.
Fig. 8.
Comparison of cell composition and shape: amounts of Hb (a) and POPC (b), as measured by MALDI-ToF, as a function of the percentage of stomatocytes. The Pearson correlation coefficient (Pcc) is shown for each graph, indicating that there is no correlation between stomatocyte count and Hb, but that there is a slight negative correlation between POPC content and stomatocyte formation.
Proteins in the RBC Ghosts by SDS-PAGE
The samples were separated into groups with similar characteristics (high hemolysis and high stomatocyte counts vs. low hemolysis and low stomatocyte counts). There was no consistent difference apparent in the cytoskeletal proteins, as seen on the gels (online suppl. Fig. S6).
Discussion
In this work, we investigated inter-donor variability in RBC morphology and correlated the observed shapes with the inter-donor variability of hemolysis that is known to occur during storage. In order to produce results relevant to the samples used for clinical purposes, one requirement is to have storage conditions similar to those used by the blood bank; this is clearly met by making use of RCC units stored by the Red Cross blood service. A second requirement is to have accurate hemolysis values, which we have ensured here by using the measurements from the routine quality control analysis. We also need a relatively large initial group of RCC units from which to draw our samples, to provide examples of high and low hemolysis samples, and to produce statistically robust results, which is achieved here by making use of the large numbers of RCC units that are routinely processed by the Red Cross quality control laboratory. This does, however, lead to the limitation that the high and low hemolysis samples are only identified at the end of the storage period, so that we are not observing the change in the RBC morphology over the course of the storage period. Previous work in which the morphology was measured as a function of time for a small number of samples and compared to the hemolysis does not appear to offer additional information [23].
Assessment of the RBC shapes at the end of the storage period after the cells have been rinsed in PBS and deposited on PAH-coated slides clearly means that we are observing the cells that remain after any hemolysis that occurs during storage and sample preparation. This would not be expected to have a significant effect on the shape distributions shown in Figure 3 because of the small minority of cells that lyse. An additional point to consider is whether the morphology that we observe is an accurate reflection of the shapes of the cells in the transfusion bags. The most distinctive feature of our morphological analysis is the high stomatocyte counts. We do not rinse the cells with albumin solutions or with plasma, which are known to cause stomatocyte formation, possibly through extraction of lipids from the outer membrane leaflet [10, 11, 12, 24], and we do not expose the cells to low pH, or any of the ions known to lead to induced stomatocytes. There is therefore nothing in our procedure that would be expected to lead to artifactual high stomatocyte counts. In addition, we can clearly observe inter-donor differences in morphology. The high stomatocyte counts seen for samples from some donors therefore appear to reflect patterns that occur in the transfusion bags. The notable feature of our analysis that leads to the high stomatocyte counts is that we identify stomatocytes from the top view, based on previously reported work [13]. This identification is based on the altered thickness of the cells, which results in a different pattern of light and dark regions in phase-contrast microscopy, as illustrated in Figure 2; the cells retain the circular outline of discocytes, and might therefore be counted as such when using procedures in which the cells are processed by drying, staining, and observation by regular light microscopy.
The first conclusion that we can draw from our results is that the MI is not a good marker of storage quality when comparing RBCs from different donors that are stored in PAGGSM, as illustrated by Figure 6. Morphological changes are certainly an indicator of storage-related events: there is a long-established link between the decrease in ATP levels and the increased spiculation [1], and it has been shown that the average MI increases with storage time for RBCs stored in PAGGSM [25]. It is, however, important to differentiate between measuring changes in a single sample or a defined group of samples, and the use of the MI as a marker of storage quality for an individual measurement. The inter-donor variability in morphology that has been noted here would not affect the morphological analysis used to assess the response to toxins [26], the effects of sample transportation [27], variation of samples with time [23], or the comparison of the effects of storage media [28].
Our results also show that it is possible for cells to lyse without forming significant numbers of echinocytes, as illustrated by Figure 4a and the significant link (uncorrected p = 0.0012) between high hemolysis and stomatocyte formation. The implication here is that hemolysis can happen without the formation of echinocytes, and that there are therefore two lysis pathways. It is known that RBCs can form smooth spherical shapes via both the stomatocyte and the echinocyte pathways [7, 20, 29]. The spherocytes formed via the two pathways are similar, but not identical [20]; spherocytes formed via the stomatocyte pathway have been described as having endocytic vesicles formed from membrane invaginations that break off [30, 31], while spherocytes formed from echinocytes are described as having shed their spicules [32, 33]. The spherocytes can be grouped together by automated analysis of RBC morphology during storage; when this is done, the resulting total spherocyte counts are proportional to hemolysis [34].
One question to consider is how much hemolysis occurs via stomatocyte formation, and how much occurs via echinocyte formation. For the high hemolysis group of data points in Figure 6, the MI seems to be fairly equally distributed between low and high values. The morphological changes that occur during storage are relatively slow because of the additives used to extend the shelf life. If we can therefore take the appearance of the cells at the end of the storage period as a snapshot that measures a gradual sequence of events, the implication here is that both hemolysis pathways are significant for the high hemolysis group of samples. Although it is possible to find stomatocytes and type III echinocytes in the same sample, the general trend in the high hemolysis samples is for an inverse relationship in the counts of stomatocytes and type III echinocytes, as shown in online supplementary Figure S12 (the Pearson correlation coefficient for the two shapes in the high hemolysis group of samples is −0.63). This suggests that RBCs in a given sample will follow either the pathway in which the outer leaflet expands, leading to echinocyte formation, or the pathway in which the inner leaflet expands and causes stomatocyte formation (as shown in Fig. 1), but are less likely to follow both pathways simultaneously in different cells.
If cells can lyse via two pathways, then it is of interest to speculate about the mechanism behind this. As units of RCCs age during storage, the ATP levels drop, causing the formation of echinocytes [1]; the pH also drops, which drives the cells towards stomatocytes. At the end of 42 days of storage in PAGGSM, the pH is about 6.6 [35]. This is higher than the range of 5.6–5.8 at which cells are reported to form stomatocytes [7, 9], but the pH-induced shape change has also been reported to be donor specific [36]. It is therefore possible that the decrease in pH during storage can affect some cells, or at least make them more susceptible to stomatocyte formation. The mechanism behind the pH-related shape changes has been attributed not to the presence of charged groups on the cell surface, but rather to the action of the band 3 anion transporter, which can change the relative areas of the inner and outer membrane leaflets by changing conformation [9]. The high band 3 content in RBCs from llamas has been associated with the resistance to shape changes [37]; it might be possible for smaller inter-donor differences to exist in band 3 content of the RBCs collected here, affecting the morphology of the hemolysis. This was, however, not possible to detect on the SDS-PAGE gels, possibly due to the fact that band 3 is diffuse because of glycosylation differences [38].
In order to explain donor variability, we must look for inter-donor differences in the RBCs, although the relationship between potential markers and hemolysis will be complicated if there are two different hemolysis pathways. In the present work, we analyzed POPC content and adsorbed Hb, and compared these values to both the hemolysis and the stomatocyte formation. Membrane-associated Hb has been found to bind to the membrane protein band 3 as part of a mechanism that leads to the removal of the RBCs from the circulation [22]; the amount of bound Hb has also been found to increase with storage time [21]. In the present case, however, there was no link between the Hb content found in association with the RBC ghosts prepared for the MALDI-ToF and the extent of the hemolysis. A weak negative association was found between the POPC content and the stomatocyte formation. Phosphatidylcholines comprise about 29% of the membrane phospholipids [39] and are predominantly in the outer leaflet of the membrane [8]. Changes in the lipid content of one of the membrane leaflets can have significant effects on the RBC shape [8], and it is therefore plausible that changes to the membrane lipids could be associated with changes to the RBC shape.
A final point to consider here is how the RBC morphology could affect the performance of the RBCs after transfusion. The goal for transfusions is to maximize the function of the transfused cells while minimizing the transfusion of harmful species. It is therefore of interest to note that the high and low hemolysis groups both have the same numbers of discocytes. It is possible to reverse the early-stage echinocytes by replenishing the ATP levels [1], but both the type I and II echinocytes identified here would have to be included in order to differentiate between the high and low hemolysis groups, and even then there is some overlap in the numbers (online suppl. Table S1). Vesicles shed from the echinocyte spicules are potentially harmful [40], meaning it would be beneficial to minimize the transfusion of late-stage echinocytes, but stomatocytes may also cause some problems due to reduced deformability in narrow channels [30]. The problems of using MI to identify storage quality operate in both directions: if the goal is to use an optimum shape of RBCs for transfusions, then it is not possible to identify this by measurement of the hemolysis.
In conclusion, our results suggest that RBCs stored for transfusion lyse via two different pathways. Extensive shape changes away from the initial discocyte morphology are associated with hemolysis, but these shape changes can occur in two different directions, resulting in the formation of either echinocytes or stomatocytes. A significant proportion of RBCs stored for transfusions appear to lyse via the stomatocyte pathway, so that it is possible for cells to lyse while remaining predominantly smooth. The MI, which measures the degree of spiculation, is therefore not a useful measure of storage quality when RBCs from different donors are compared.
Statement of Ethics
The project was assessed by the Medical Ethics Committee, Medical Faculty Mannheim, Heidelberg University, which determined that a separate ethical approval was not required. Blood was collected by the Red Cross from donors that had provided informed consent.
Disclosure Statement
The authors have no conflicts of interest.
Funding Sources
K.A.M. and K.B. acknowledge support from the German Research Foundation DFG (K.M: ME 4648/2-1; K.B: BI 1308/5-1). C.B., F.K., and G.B.-W. acknowledge support from the BioInterfaces in Technology and Medicine (BIFTM) program of KIT. J.L.S. acknowledges support from the Intramural Research Program of the NIH, National Library of Medicine.
Author Contributions
K.A.M. designed the experiments, collected data, and wrote the paper; C.B., F.K. and G.B.-W. collected and interpreted mass spectrometry data; J.L.S. performed the statistical analysis; K.B. collected data and contributed to sample acquisition and data interpretation. All authors reviewed the manuscript.
Supplementary Material
Supplementary data
Acknowledgements
The authors thank the blood donors of Baden-Württemberg/Hessen and the Quality Control Laboratory (Institute for Transfusion Medicine and Immunology, Mannheim), and thank Alexander Putz for help with MALDI-ToF.
References
- 1.Nakao M, Nakao T, Yamazoe S. Adenosine triphosphate and maintenance of shape of the human red cells. Nature. 1960 Sep;187((4741)):945–6. doi: 10.1038/187945a0. [DOI] [PubMed] [Google Scholar]
- 2.Seigneuret M, Devaux PF. ATP-dependent asymmetric distribution of spin-labeled phospholipids in the erythrocyte membrane: relation to shape changes. Proc Natl Acad Sci USA. 1984 Jun;81((12)):3751–5. doi: 10.1073/pnas.81.12.3751. [DOI] [PMC free article] [PubMed] [Google Scholar]
- 3.Sheetz MP, Singer SJ. Biological membranes as bilayer couples. A molecular mechanism of drug-erythrocyte interactions. Proc Natl Acad Sci USA. 1974 Nov;71((11)):4457–61. doi: 10.1073/pnas.71.11.4457. [DOI] [PMC free article] [PubMed] [Google Scholar]
- 4.Lim H W G, Wortis M, Mukhopadhyay R. Stomatocyte-discocyte-echinocyte sequence of the human red blood cell: evidence for the bilayer- couple hypothesis from membrane mechanics. Proc Natl Acad Sci USA. 2002 Dec;99((26)):16766–9. doi: 10.1073/pnas.202617299. [DOI] [PMC free article] [PubMed] [Google Scholar]
- 5.Wong P. A basis of echinocytosis and stomatocytosis in the disc-sphere transformations of the erythrocyte. J Theor Biol. 1999 Feb;196((3)):343–61. doi: 10.1006/jtbi.1998.0845. [DOI] [PubMed] [Google Scholar]
- 6.Artmann GM, Sung KL, Horn T, Whittemore D, Norwich G, Chien S. Micropipette aspiration of human erythrocytes induces echinocytes via membrane phospholipid translocation. Biophys J. 1997 Mar;72((3)):1434–41. doi: 10.1016/S0006-3495(97)78790-3. [DOI] [PMC free article] [PubMed] [Google Scholar]
- 7.Deuticke B. Transformation and restoration of biconcave shape of human erythrocytes induced by amphiphilic agents and changes of ionic environment. Biochim Biophys Acta. 1968 Dec;163((4)):494–500. doi: 10.1016/0005-2736(68)90078-3. [DOI] [PubMed] [Google Scholar]
- 8.Zachowski A. Phospholipids in animal eukaryotic membranes: transverse asymmetry and movement. Biochem J. 1993 Aug;294((Pt 1)):1–14. doi: 10.1042/bj2940001. [DOI] [PMC free article] [PubMed] [Google Scholar]
- 9.Gimsa J. Red cell echinogenesis is correlated to the recruitment of external band-3 conformations. Biochem Bioenergetics. 1995;38((1)):99–103. [Google Scholar]
- 10.Reinhart WH, Chien S. Echinocyte-stomatocyte transformation and shape control of human red blood cells: morphological aspects. Am J Hematol. 1987 Jan;24((1)):1–14. doi: 10.1002/ajh.2830240102. [DOI] [PubMed] [Google Scholar]
- 11.Jay AW. Geometry of the human erythrocyte. I. Effect of albumin on cell geometry. Biophys J. 1975 Mar;15((3)):205–22. doi: 10.1016/S0006-3495(75)85812-7. [DOI] [PMC free article] [PubMed] [Google Scholar]
- 12.Schrier SL, Zachowski A, Devaux PF. Mechanisms of amphipath-induced stomatocytosis in human erythrocytes. Blood. 1992 Feb;79((3)):782–6. [PubMed] [Google Scholar]
- 13.Melzak KA, Uhlig S, Kirschhöfer F, Brenner-Weiss G, Bieback K. The blood bag plasticizer di-2-ethylhexylphthalate causes red blood cells to form stomatocytes, possibly by inducing lipid flip-flop. Transfus Med Hemother. 2018 Nov;45((6)):413–22. doi: 10.1159/000490502. [DOI] [PMC free article] [PubMed] [Google Scholar]
- 14.Sparrow RL. Red blood cell components: time to revisit the sources of variability. Blood Transfus. 2017 Mar;15((2)):116–25. doi: 10.2450/2017.0326-16. [DOI] [PMC free article] [PubMed] [Google Scholar]
- 15.Dumont LJ, AuBuchon JP, BEST collaborative Evaluation of proposed FDA criteria for the evaluation of radiolabeled red cell recovery trials. Transfusion. 2008 Jun;48((6)):1053–60. doi: 10.1111/j.1537-2995.2008.01642.x. [DOI] [PubMed] [Google Scholar]
- 16.Lanteri MC, Kanias T, Keating S, Stone M, Guo Y, Page GP, et al. NHLBI Recipient Epidemiology Donor Evaluation Study (REDS)-III Program Intradonor reproducibility and changes in hemolytic variables during red blood cell storage: results of recall phase of the REDS-III RBC-Omics study. Transfusion. 2019 Jan;59((1)):79–88. doi: 10.1111/trf.14987. [DOI] [PMC free article] [PubMed] [Google Scholar]
- 17.van 't Erve TJ, Wagner BA, Martin SM, Knudson CM, Blendowski R, Keaton M, et al. The heritability of metabolite concentrations in stored human red blood cells. Transfusion. 2014 Aug;54((8)):2055–63. doi: 10.1111/trf.12605. [DOI] [PMC free article] [PubMed] [Google Scholar]
- 18.Melzak KA, Lazaro GR, Hernandez-Machado A, Pagonabarraga I, de Espada JC, Toca-Herrera JL. AFM measurements and lipid rearrangements: evidence from red blood cell shape changes. Soft Matter. 2012;8((29)):7716–26. [Google Scholar]
- 19.Acker JP, Hansen AL, Kurach JD, Turner TR, Croteau I, Jenkins C. A quality monitoring program for red blood cell components: in vitro quality indicators before and after implementation of semiautomated processing. Transfusion. 2014 Oct;54((10)):2534–43. doi: 10.1111/trf.12679. [DOI] [PubMed] [Google Scholar]
- 20.Daleke DL, Huestis WH. Erythrocyte morphology reflects the transbilayer distribution of incorporated phospholipids. J Cell Biol. 1989 Apr;108((4)):1375–85. doi: 10.1083/jcb.108.4.1375. [DOI] [PMC free article] [PubMed] [Google Scholar]
- 21.Kriebardis AG, Antonelou MH, Stamoulis KE, Economou-Petersen E, Margaritis LH, Papassideri IS. Progressive oxidation of cytoskeletal proteins and accumulation of denatured hemoglobin in stored red cells. J Cell Mol Med. 2007 Jan-Feb;11((1)):148–55. doi: 10.1111/j.1582-4934.2007.00008.x. [DOI] [PMC free article] [PubMed] [Google Scholar]
- 22.Low PS, Waugh SM, Zinke K, Drenckhahn D. The role of hemoglobin denaturation and band 3 clustering in red blood cell aging. Science. 1985 Feb;227((4686)):531–3. doi: 10.1126/science.2578228. [DOI] [PubMed] [Google Scholar]
- 23.Sierra F DA, Melzak KA, Janetzko K, Klüter H, Suhr H, Bieback K, et al. Flow morphometry to assess the red blood cell storage lesion. Cytometry A. 2017 Sep;91((9)):874–82. doi: 10.1002/cyto.a.23127. [DOI] [PubMed] [Google Scholar]
- 24.Reinhart SA, Schulzki T, Reinhart WH. Albumin reverses the echinocytic shape transformation of stored erythrocytes. Clin Hemorheol Microcirc. 2015;60((4)):437–49. doi: 10.3233/CH-141899. [DOI] [PubMed] [Google Scholar]
- 25.Zehnder L, Schulzki T, Goede JS, Hayes J, Reinhart WH. Erythrocyte storage in hypertonic (SAGM) or isotonic (PAGGSM) conservation medium: influence on cell properties. Vox Sang. 2008 Nov;95((4)):280–7. doi: 10.1111/j.1423-0410.2008.01097.x. [DOI] [PubMed] [Google Scholar]
- 26.Biswas D, Banerjee M, Sen G, Das JK, Banerjee A, Sau TJ, et al. Mechanism of erythrocyte death in human population exposed to arsenic through drinking water. Toxicol Appl Pharmacol. 2008 Jul;230((1)):57–66. doi: 10.1016/j.taap.2008.02.003. [DOI] [PubMed] [Google Scholar]
- 27.Makhro A, Huisjes R, Verhagen LP, Mañú-Pereira MM, Llaudet-Planas E, Petkova-Kirova P, et al. Red cell properties after different modes of blood transportation. Front Physiol. 2016 Jul;7:288. doi: 10.3389/fphys.2016.00288. [DOI] [PMC free article] [PubMed] [Google Scholar]
- 28.Serrano K, Levin E, Chen D, Hansen A, Turner TR, Kurach J, et al. An investigation of red blood cell concentrate quality during storage in paediatric-sized polyvinylchloride bags plasticized with alternatives to di-2-ethylhexyl phthalate (DEHP) Vox Sang. 2016 Apr;110((3)):227–35. doi: 10.1111/vox.12355. [DOI] [PubMed] [Google Scholar]
- 29.Yawata Y. Cell Membrane: the red blood cell as a model. Wiley-VCH; 2003. [Google Scholar]
- 30.Reinhart WH, Chien S. Red cell rheology in stomatocyte-echinocyte transformation: roles of cell geometry and cell shape. Blood. 1986 Apr;67((4)):1110–8. [PubMed] [Google Scholar]
- 31.Ferrell JE, Jr, Lee KJ, Huestis WH. Membrane bilayer balance and erythrocyte shape: a quantitative assessment. Biochemistry. 1985 Jun;24((12)):2849–57. doi: 10.1021/bi00333a006. [DOI] [PubMed] [Google Scholar]
- 32.Iglič A, Veranič P, Jezernik K, Fošnaric M, Kamin B, Hägerstrand H, et al. Spherocyte shape transformation and release of tubular nanovesicles in human erythrocytes. Bioelectrochemistry. 2004 May;62((2)):159–61. doi: 10.1016/j.bioelechem.2003.07.002. [DOI] [PubMed] [Google Scholar]
- 33.Kriebardis AG, Antonelou MH, Stamoulis KE, Economou-Petersen E, Margaritis LH, Papassideri IS. RBC-derived vesicles during storage: ultrastructure, protein composition, oxidation, and signaling components. Transfusion. 2008 Sep;48((9)):1943–53. doi: 10.1111/j.1537-2995.2008.01794.x. [DOI] [PubMed] [Google Scholar]
- 35.Veale MF, Healey G, Sparrow RL. Effect of additive solutions on red blood cell (RBC) membrane properties of stored RBCs prepared from whole blood held for 24 hours at room temperature. Transfusion. 2011 Jan;51(Suppl 1):25S–33S. doi: 10.1111/j.1537-2995.2010.02960.x. [DOI] [PubMed] [Google Scholar]
- 36.Gedde MM, Huestis WH. Membrane potential and human erythrocyte shape. Biophys J. 1997 Mar;72((3)):1220–33. doi: 10.1016/S0006-3495(97)78769-1. [DOI] [PMC free article] [PubMed] [Google Scholar]
- 37.Khodadad JK, Weinstein RS. The band 3-rich membrane of llama erythrocytes: studies on cell shape and the organization of membrane proteins. J Membr Biol. 1983;72((3)):161–71. doi: 10.1007/BF01870583. [DOI] [PubMed] [Google Scholar]
- 38.Van Dort HM, Moriyama R, Low PS. Effect of band 3 subunit equilibrium on the kinetics and affinity of ankyrin binding to erythrocyte membrane vesicles. J Biol Chem. 1998 Jun;273((24)):14819–26. doi: 10.1074/jbc.273.24.14819. [DOI] [PubMed] [Google Scholar]
- 39.Dodge JT, Phillips GB. Composition of phospholipids and of phospholipid fatty acids and aldehydes in human red cells. J Lipid Res. 1967 Nov;8((6)):667–75. [PubMed] [Google Scholar]
- 40.Jy W, Ricci M, Shariatmadar S, Gomez-Marin O, Horstman LH, Ahn YS. Microparticles in stored red blood cells as potential mediators of transfusion complications. Transfusion. 2011 Apr;51((4)):886–93. doi: 10.1111/j.1537-2995.2011.03099.x. [DOI] [PMC free article] [PubMed] [Google Scholar]
Associated Data
This section collects any data citations, data availability statements, or supplementary materials included in this article.
Supplementary Materials
Supplementary data


