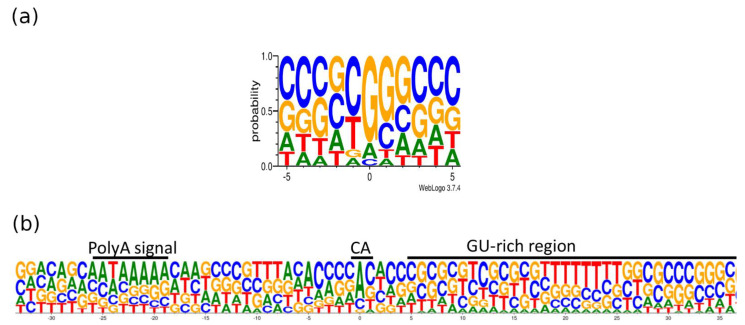
Figure 7.
The base content at the 5′- and 3′-termini of the PRV transcripts. The x-axis represents the position of the nucleotides relative to the TSS (a) or TES (b), whereas the y-axis shows the frequency of the given nucleotide at a given position. (a) Most of the transcripts have GC-rich 5′ termini. The position “0” is the first nucleotide of the TSS. (b) Three primary sequence elements are frequent at the 3′-end of the RNAs: The hexameric polyadenylation signal (typically AAUAAA), the cleavage site (most commonly a CA dinucleotide), and the downstream sequence element (typically U/UG rich). “U”-s are shown as “T”. The position “0” is the potential polyadenylation (PA) site. The logo shows the +/− 50 bp interval of the PA site. The image is generated using weblogo 3.0 [41].

