Abstract
Salsola collina Pall has a long history of being used as a traditional medicine to treat hypertension, headache, insomnia, constipation and vertigo. However, only a few biologically active substances have been identified from S. collina. Here, the shoots and roots of S. collina, namely L-Sc and R-Sc, were studied. The primary and secondary metabolites were investigated using ultrahigh-performance liquid chromatography-electrospray ionization-tandem mass spectrometry (UPLC-ESI-MS/MS). A total of 637 putative metabolites were identified and these metabolites were mainly classified into ten different categories. Correlation analysis, hierarchical clustering analysis, principal component analysis and orthogonal partial least squares discriminant analysis of metabolites showed that the L-Sc samples could be clearly separated from the R-Sc samples. Differential accumulated metabolite analysis revealed that most of differential primary metabolites were significantly lower in the L-Sc than in the R-Sc. Conversely, the major differential secondary metabolites had higher levels in the L-Sc than in the R-Sc. Further analysis indicated that the flavonoids were the major putative antioxidant components and most of putative antioxidant components exhibited higher relative concentrations in the L-Sc than the R-Sc. These results improve our understanding of metabolite accumulation and provide a reference for the study of medicinal value in S. collina.
Keywords: Salsola collina Pall, widely targeted metabolomics, primary and secondary metabolites, differential metabolites
1. Introduction
Salsola collina Pall belongs to the family Chenopodiaceae, and is widespread in northeast, north, northwest, and southwest of China [1]. S. collina has a long history of use in folk medicine [2]. The whole herb of S. collina is commonly used as herbal drink to treat hypertension, headache, insomnia, constipation and vertigo in China and Korea [3,4,5]. In Russia, S. collina is one component of the biologically active food additive “Heparon”, which has a liver protective, anti-alcohol, anti-inflammatory, and mild cholagogue effect [6].
Modern medical research has revealed that S. collina as herbal medicine exhibits beneficial effects on the immune and gastrointestinal system, has anti-inflammatory, anti-bacterial, and anti-hypertensive effects, and prevents cholelithiasis, dry bowel and constipation [7]. The ethyl acetate extract of S. collina can improve gastric emptying by regulating gastrointestinal hormone excretion and the c-Kit/SCF signaling pathway, and promote intestinal propulsion by modulating plasma ghrelin, gastrin, the plasma ghrelin receptor, and vasoactive intestinal peptide receptor 2 in the duodenum and activating M-cholinergic receptor [8,9,10]. Meanwhile, the ethanol extract from S. collina exerts anti-oxidative and anti-cancer activities by regulating the cell cycle [11]. In addition, the aqueous extract from S. collina is an effective means for the prophylaxis of cholelithiasis [12].
Although pharmacological studies have proved that S. collina has high medicinal value, there are few studies on the identification of active substances. Only about 60 biological active ingredients have been detected from S. collina, including flavonoids, alkaloids, phenolic acids, organic acids, sterols, etc. [6,8,9,13,14,15,16,17,18,19,20]. The main compounds are flavonoids and phenolic acids. The 18 reported flavonoids mainly involve flavones, flavonols and isoflavones [6,14,17,18,19,20]. Twelve phenolic acids have been identified from S. collina, such as vanillic acid, ferulic acid, salicylic acid, etc. [8,9,17,18,19,20]. It is well-known that there are both chemical and pharmacological differences in different parts of herbs [21]. Nevertheless, all samples used in previous studies have been collected from the aboveground parts of S. collina. Hence, the research on the chemical composition of S. collina at different parts is lacking.
With the development of metabolomics, high-throughput methods such as ultrahigh-performance liquid chromatography-electrospray ionization-tandem mass spectrometry (UPLC-ESI-MS/MS) have been applied to analyze metabolite profiles and detect variations in the compositions of herbs [21,22,23,24,25,26,27,28]. In this study, we used a widely targeted metabolomics method to investigate the chemical composition in S. collina, and identify the differentially accumulated metabolites (DAMs) between the shoots and roots of S. collina. Our results shed light on the metabolic pathways underlying S. collina and provide a scientific basis for application of S. collina.
2. Materials and Methods
2.1. Plant Materials
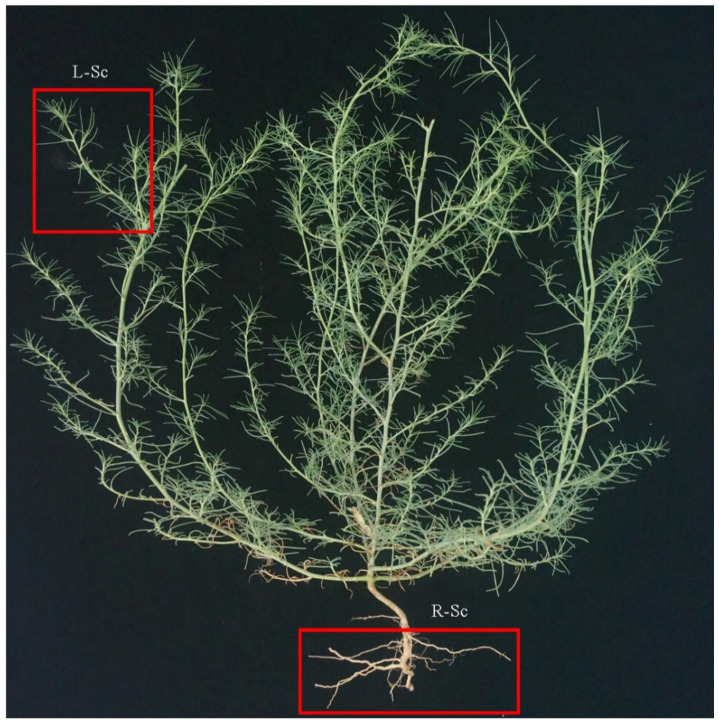
All samples were collected from Luoyang, Henan Province, China, in the middle of July 2020. These samples were flash-frozen in liquid nitrogen containers, and stored at −80 °C for further analysis. The shoots and roots of S. collina were named L-Sc and R-Sc, respectively (Figure 1). For each sample, three biological replicates were independently analyzed. Five well-developed individuals were collected and combined for each repeat.
Figure 1.
Phenotypes of S. collina.
2.2. Sample Preparation and Extraction
The freeze-dried sample was crushed using a mixer mill (MM 400, Retsch) with a zirconia bead for 1.5 min at 30 Hz. A total of 100 mg powder was weighted and extracted overnight at 4 °C with 1.2 mL 70% aqueous methanol. Following centrifugation at 12,000 rpm for 10 min, the extracts were filtrated (SCAA-104, 0.22 μm pore size; ANPEL, Shanghai, China, http://www.anpel.com.cn/ (accessed on 2 February 2021)) before UPLC-MS/MS analysis.
2.3. UPLC Conditions
The sample extracts were analyzed using an UPLC-ESI-MS/MS system (UPLC, SHIMADZU Nexera X2, www.shimadzu.com.cn/ (accessed on 2 February 2021); MS, Applied Biosystems 4500 Q-TRAP, www.appliedbiosystems.com.cn/ (accessed on 2 February 2021)). The analytical conditions were as follows, UPLC: column, Agilent SB-C18 (1.8 µm, 2.1 mm × 100 mm); the mobile phase consisted of solvent A, pure water with 0.1% formic acid, and solvent B, acetonitrile with 0.1% formic acid. Sample measurements were performed with a gradient program that employed the starting conditions of 95% A, 5% B. Within 9 min, a linear gradient to 5% A, 95% B was programmed, and a composition of 5% A, 95% B was kept for 1 min. Subsequently, a composition of 95% A, 5.0% B was adjusted within 1.10 min and kept for 2.9 min. The column oven was set to 40 °C. The injection volume was 4 μL. The effluent was alternatively connected to an electrospray ionization (ESI)-triple quadrupole-linear ion trap (QTRAP)-MS
2.4. ESI-Q TRAP-MS/MS
Linear ion trap (LIT) and triple quadrupole (QQQ) scans were acquired on a triple quadrupole-linear ion trap mass spectrometer (Q-TRAP), AB4500 Q-TRAP-UPLC/MS/MS System, equipped with an ESI Turbo Ion-Spray interface, operating in positive and negative ion mode and controlled by Analyst 1.6.3 software (AB Sciex, Concord, Ontario, Canada). The ESI source operation parameters were as follows—ion source, turbo spray; source temperature 550 °C; ion spray voltage (IS) 5500 V (positive ion mode)/ −4500 V (negative ion mode); ion source gas I (GSI), gas 28 II (GSII), curtain gas (CUR) were set at 50, 60, and 25.0 psi, respectively; the collision gas (CAD) was high. Instrument tuning and mass calibration were performed with 10 and 100 μmol/L polypropylene glycol solutions in QQQ and LIT modes, respectively. QQQ scans were acquired as multiple reaction monitoring (MRM) experiments with collision gas (nitrogen) set to medium. The declustering potential (DP) and collision energy (CE) for individual MRM transitions were done with further DP and CE optimization. A specific set of MRM transitions were monitored for each period according to the metabolites eluted within this period [29].
2.5. Qualitative and Semi-Quantitative Analysis of Metabolites
The identification and structural analyses of the primary and secondary spectral data of the metabolites detected by mass spectrometry were based on the MWDB database (Metware Biotechnology Co., Ltd. Wuhan, China) and public databases, including MassBank (http://www.massbank.jp/ (accessed on 2 February 2021)), KNAPSAcK (http://kanaya.naist.jp/KNApSAcK/ (accessed on 2 February 2021)), HMDB (http://www.hmdb.ca/ (accessed on 2 February 2021)), MoToDB (http://www.ab.wur.nl/moto/ (accessed on 2 February 2021)), and ChemBank (http://chembank.med.harvard.edu/compounds (accessed on 2 February 2021)); PubChem (https://pubchemblog.ncbi.nlm.nih.gov/ (accessed on 2 February 2021)); NIST Chemistry Webbook (http://webbook.nist.gov/ (accessed on 2 February 2021)); and METLIN (http://metlin.scripps.edu/index.php (accessed on 2 February 2021)). Metabolomics data were processed using Analyst (Version 1.6.3, Sciex, Framingham, MA, USA).
Metabolite quantification was performed using MRM mode of QQQ mass spectrometry. In the MRM mode, the quadrupole filters the precursor ions of the target substance and excludes the ions corresponding to other molecular weights to eliminate interference. After obtaining the metabolite mass spectrometry data, peak area integration was performed using MultiQuant version 3.0.2 (AB SCIEX, Concord, ON, Canada). Finally, the chromatographic peak area was used to determine the relative metabolite contents.
2.6. Principal Component Analysis
Unsupervised principal component analysis (PCA) was performed by statistics function prcomp within R (www.r-project.org (accessed on 2 February 2021)). The data were unit variance scaled before unsupervised PCA.
2.7. Hierarchical Cluster Analysis and Pearson Correlation Coefficients
The hierarchical cluster analysis (HCA) results of samples and metabolites were presented as heatmaps with dendrograms, while Pearson correlation coefficients (PCC) between samples were calculated by the cor function in R (www.r-project.org (accessed on 2 February 2021)) and presented as only heatmaps. Both HCA and PCC were carried out by R package heatmap. For HCA, normalized signal intensities of metabolites (unit variance scaling) are visualized as a color spectrum.
2.8. Differential Metabolites Selected
Orthogonal partial least squares discriminant analysis (OPLS-DA) was performed on the identified metabolites. Differentially accumulated metabolites between groups were determined by fold change ≥ 2 or ≤0.5 and variable importance in project (VIP) ≥ 1. VIP values were extracted from OPLS-DA result, which also contain score plots and permutation plots, were generated using R package MetaboAnalystR (https://github.com/xia-lab/MetaboAnalystR (accessed on 2 February 2021)). The data were log transformed (log2) and mean centered before OPLS-DA. In order to avoid overfitting, a permutation test (200 permutations) was performed.
2.9. KEGG Annotation and Enrichment Analysis
Identified metabolites were annotated using the KEGG Compound database (http://www.kegg.jp/kegg/compound/ (accessed on 2 February 2021)), and annotated metabolites were then mapped to KEGG Pathway database (http://www.kegg.jp/kegg/pathway.html (accessed on 2 February 2021)). Pathways with significantly regulated metabolites mapped to were then fed into metabolite sets enrichment analysis (MSEA), and their significance was determined by the hypergeometric test’s p-values.
3. Results
3.1. Metabolic Profiling of S. collina Based on LC-MS/MS
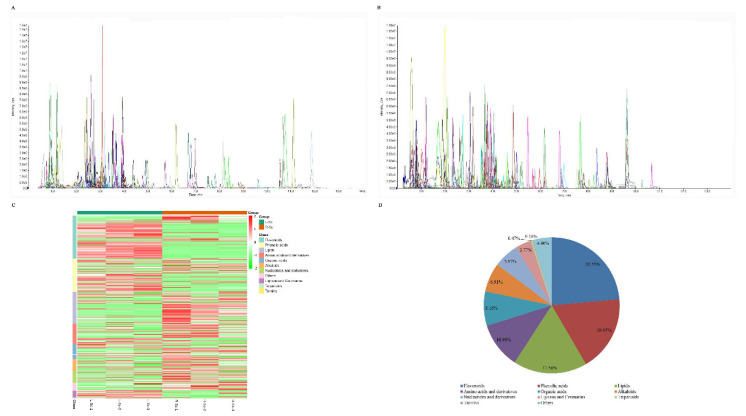
To investigate the chemical composition in shoots and roots of S. collina, the primary and secondary metabolites were identified by LC-MS/MS analysis (Figure S1). The metabolites were quantitatively analyzed using software Analyst under the multiple reaction monitoring modes (Figure 2A,B). A total of 637 putative metabolites were detected and could be categorized into more than ten different classes, including 150 flavonoids, 115 phenolic acids, 112 lipids, 70 amino acids and derivatives, 52 organic acids, 44 alkaloids, 38 nucleotides and derivatives, 24 lignans and coumarins, three terpenoids, one tannin and 28 others (Figure 2C and Table S1). Flavonoids (23.55%), phenolic acids (18.05%), lipids (17.58%), amino acids and derivatives (10.99%) were the four main metabolites (Figure 2D). The flavonoids and lipids could be further categorized into nine and four classes, respectively (Table 1).
Figure 2.
Qualitative and semi-quantitative analysis of metabolites in S. collina. Multipeak mass spectral chromatogram of metabolites acquired in negative ion mode (A) and positive ion mode (B). (C) Heatmap of the metabolites in the shoots and roots of S. collina (L-Sc and R-Sc, respectively). (D) Types and proportions of the identified metabolites from the L-Sc and the R-Sc.
Table 1.
Overview of the identified metabolites in S. collina.
| Primary Classification | Secondary Classification | Number of Metabolites |
|---|---|---|
| Flavonoids | Flavones | 63 |
| Flavonols | 48 | |
| Anthocyanins | 13 | |
| C-flavonoids | 11 | |
| Dihydroflavones | 7 | |
| Isoflavones | 4 | |
| Dihydroflavonols | 2 | |
| Dihydroisoflavone | 1 | |
| Flavanol | 1 | |
| Phenolic acids | Phenolic acids | 115 |
| Lipids | Free fatty acids | 39 |
| Lysophosphatidycholines | 30 | |
| Lysophosphatidyl ethanolamines | 26 | |
| Glycerol esters | 17 | |
| Amino acids and derivatives | Amino acids and derivatives | 70 |
| Organic acids | Organic acids | 52 |
| Alkaloids | Alkaloids | 26 |
| Phenolamines | 11 | |
| Plumeranes | 7 | |
| Nucleotides and derivatives | Nucleotides and derivatives | 38 |
| Lignans and Coumarins | Lignans | 17 |
| Coumarins | 7 | |
| Terpenoids | Triterpene | 1 |
| Triterpene Saponin | 1 | |
| Sesquiterpenoid | 1 | |
| Tannins | Tannin | 1 |
| Others | Saccharides and Alcohols | 17 |
| Vitamins | 4 | |
| Others | 7 |
3.2. Multivariate Statistical Analysis
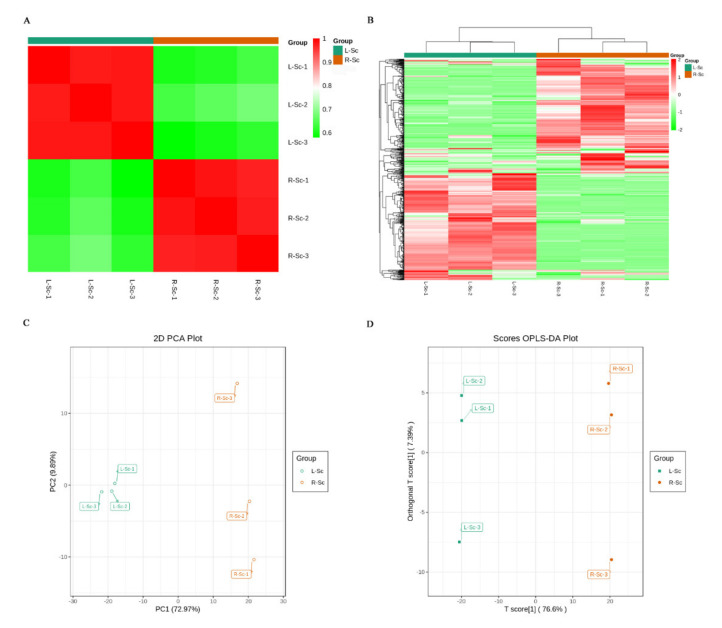
Multivariate statistics were used to assess further the identified metabolites in the L-Sc and the R-Sc. The correlation analysis showed that there was a significant correlation among biological replicates in both L-Sc and R-Sc (Figure 3A). Based on the hierarchical cluster analysis, the L-Sc samples and the R-Sc samples also could be clearly divided into two groups and the metabolites displayed different accumulation patterns between the two sets of samples (Figure 3B).
Figure 3.
The identified metabolites analysis. (A) Pearson’s correlation coefficients among the L-Sc and R-Sc samples. (B) Cluster analysis of the identified metabolites from the L-Sc and the R-Sc. (C) Principal component analysis (PCA) of the L-Sc and R-Sc. (D) Orthogonal partial least squares discriminant analysis (OPLS-DA) model plot of the identified metabolites in the L-Sc and the R-Sc.
In order to further analyze the degree of variability in intergroup samples and intragroup samples, the metabolite profile of six samples was subjected to PCA (Figure 3C). Two principal components, PC1 and PC2, were extracted and explained 72.97% and 9.89% of the variability, respectively. In the PCA plot, the three biological replicates of L-Sc were concentrated in the middle of the left side of the plot, and the three biological replicates of R-Sc were distributed in the right side of the plot. The OPLS-DA mode was also used to screen the identified metabolites and evaluated the differential metabolites between L-Sc and R-Sc (Figure 3D). Like PCA, OPLS-DA also exhibited an obvious separation between L-Sc and R-Sc. We observed high predictability (Q2) and strong goodness of fit (R2X, R2Y) between HW and SW (Q2 = 0.986, R2X = 0.840, R2Y = 1.000), which demonstrated that these modes were stable and reliable and could be used to further identify the differentially accumulated metabolites (Figure S2). Taken together, these results suggested that there were significantly distinct metabolic profiles between L-Sc and R-Sc.
3.3. Differential Metabolites Between L-Sc and R-Sc
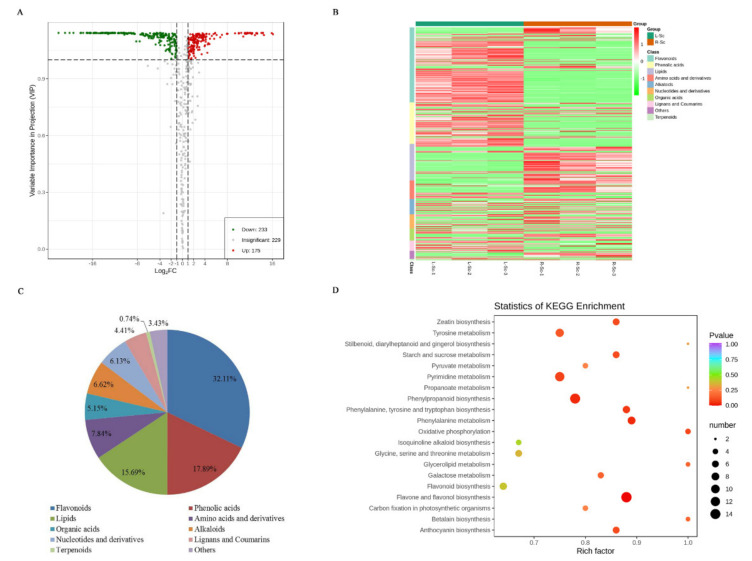
To identify differentially accumulated metabolites between L-Sc and R-Sc, a fold change ≥ 2 or a fold change ≤ 0.5 and variable importance in project (VIP) ≥ 1 were used as the screening criteria. A total of 408 DAMs were detected between L-Sc and R-Sc (Table S2). Of these, 233 putative metabolites were down-regulated and 175 putative metabolites were up-regulated in the R-Sc compared with the L-Sc (Figure 4A). The DAMs could be categorized into more than ten classes (Figure 4B), but the majority of DAMs were categorized into three classes, including flavonoids (32.11%), phenolic acids (17.89%) and lipids (15.69%; Figure 4C).
Figure 4.
Differentially accumulated metabolites between L-Sc and R-Sc. (A) Volcano plot of the differential metabolites. (B) Heatmap of the differential metabolites. (C) Types and proportions of the differential metabolites. (D) Overview of KEGG pathway of the differential metabolites.
Table S3 shows the differential primary and secondary metabolites analysis. One hundred and thirty-three differential metabolites were primary metabolites, including 64 lipids, 32 amino acids and derivatives, 25 nucleotides and derivatives, nine saccharides and alcohols, and three vitamins. Compared with the L-Sc, most of differential primary metabolites, including 51 lipids, 22 amino acids and derivatives, 14 nucleotides and derivatives, and eight saccharides and alcohols, were up-regulated in R-Sc. About 30% of the differential primary metabolites, including 13 lipids, 11 nucleotides and derivatives, ten amino acids and derivatives, three vitamins, and one saccharide and alcohol, were down-regulated in the R-Sc. On the other hand, 275 differential metabolites belonged to secondary metabolites, including 131 flavonoids, 73 phenolic acids, 27 alkaloids, 21 organic acids, 18 lignans and coumarins, three terpenoids and two others. Unlike differential primary metabolites, only a few secondary metabolites were up-regulated in the R-Sc, including 27 flavonoids, 18 phenolic acids, 16 alkaloids, 12 organic acids, four lignans and coumarins, two terpenoids and one other. Most of them were down-regulated in the R-Sc, including 104 flavonoids, 55 phenolic acids, 14 lignans and coumarins, 11 alkaloids, nine organic acids, one terpenoid, and one other.
Furthermore, we mapped the metabolites from the L-Sc and the R-Sc to the KEGG database. A total of 231 metabolites, involving in 127 DAMs, were enriched in 80 pathways (Table S4). Among these pathways, metabolism was the largest category and only a few pathways were classified under genetic information processing and environmental information processing (Figure S3). The top enriched KEGG pathways were mainly involved in flavone and flavonol biosynthesis, biosynthesis of amino acids, phenylpropanoid biosynthesis, pyrimidine metabolism, and others (Figure 4D and Table S4).
3.4. Putative Antioxidant Components Analysis
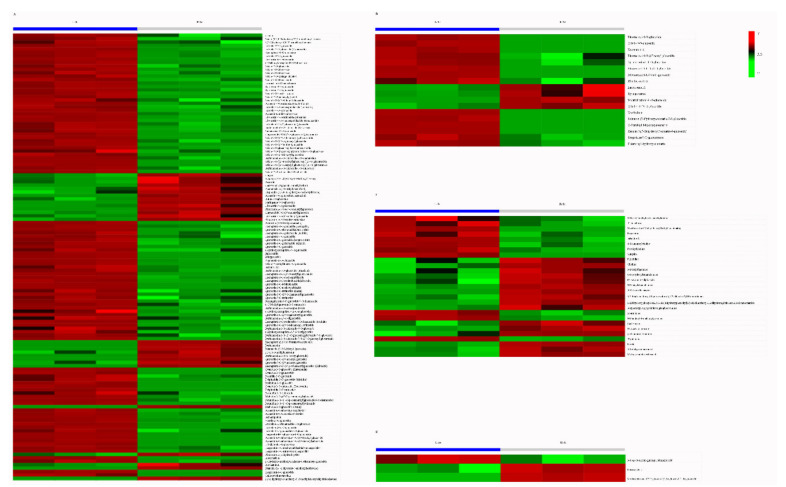
We further investigated the putative antioxidant components in the L-Sc and the R-Sc. Four types of putative antioxidant components were observed from the metabolite database, including flavonoids, lignans and coumarins, alkaloids, and terpenoids (Table 1). Most of putative antioxidant components were significantly different between L-Sc and R-Sc. Flavonesand flavonols were the major flavonoids, and most of flavonoids were found in higher relative concentrations in the L-Sc than in the R-Sc (Figure 5A and Table 2). Similarly, most of lignans and all the coumarins exhibited higher relative concentrations in the L-Sc than in the R-Sc (Figure 5B and Table 2). Conversely, more than half of alkaloids and terpenoids showed higher relative concentrations in the R-Sc than in the L-Sc (Figure 5C–D and Table 2).
Figure 5.
Heatmap of the differentially accumulated metabolites in potential antioxidant components between L-Sc and R-Sc. (A) Flavonoids, (B) lignans and coumarins, (C) alkaloids, and (D) terpenoids.
Table 2.
Overview of the differentially accumulated metabolites in potential antioxidant components between L-Sc and R-Sc.
| Primary Classification | Secondary Classification | L-Sc vs. R-Sc | |
|---|---|---|---|
| Down | Up | ||
| Flavonoids | Flavones | 41 | 14 |
| Flavonols | 35 | 8 | |
| Anthocyanins | 11 | 1 | |
| C-flavonoids | 10 | 0 | |
| Dihydroflavones | 3 | 1 | |
| Isoflavones | 2 | 2 | |
| Dihydroflavonol | 1 | 0 | |
| Flavanol | 1 | 0 | |
| Dihydroisoflavone | 0 | 1 | |
| Lignans and Coumarins | Lignans | 8 | 4 |
| Coumarins | 6 | 0 | |
| Alkaloids | Alkaloids | 8 | 10 |
| Phenolamines | 2 | 3 | |
| Plumeranes | 1 | 3 | |
| Terpenoids | Triterpene | 1 | 0 |
| Triterpene Saponin | 0 | 1 | |
| Sesquiterpenoid | 0 | 1 | |
4. Discussion
S. collina is well known for its medicinal benefits. However, only a few bioactive substances have been reported, and this has focused on flavonoids and phenolic compounds [6,8,9,10,14,17,20]. In our study, the primary and secondary metabolites of S. collina were analyzed widely, involving more than ten types of substances. Our results indicated that the main metabolites of S. collina were flavonoids, phenolic acids, lipids, amino acids and derivatives. Our results have greatly enriched the understanding of the chemical composition in S. collina.
The fresh S. collina is used as traditional medicinal materials or food additive, which can ease blood pressure, improve liver function and treat headache and vertigo [6,30]. The ethanol extract of S. collina has a good antihypertensive effect on senile or essential hypertension, and prolongs the hypnotic effect of pentobarbital sodium [2,7]. The recent research shows that the ethanol extract of S. collina also can promote gastric emptying and intestinal propulsion [8,9,10]. Flavonoids, alkaloids, lignins and coumarins, terpenes, polysaccharides, vitamins, etc., are recognized antihypertensive active ingredients. In this study, we identified a variety of hypotensive substances from S. collina (Table 1). Most of them belonged to flavonoids, alkaloids, and lignins and coumarins (Figure 2D). Therefore, we believe that the three substances are the main medicinal substances in S. collina.
In general, different parts of medicinal plants have unique medicinal values. The flower of Saffron is a valuable traditional Chinese medicine. Coniferin and crocin-2 are special components in stigmas and the content of flavonoids is high in tepals [31]. The root of Platycodon grandiflorum can be used as medicine. Compared with the stem, leaf and seed, the root contains more saponins [21]. Cortex moutan is made by drying the roots of peony, and its main roots have higher medicinal value than lateral roots [22]. Furthermore, the environment and growth age are also important factors affecting the medicinal value [24,32]. In this study, we found that the main putative antioxidant compounds showed higher relative concentrations in the shoots of S. collina, whereas a number of alkaloids and terpenoids were significantly higher in the roots of S. collina (Figure 5A and Table 2). Interestingly, the key of alkaloid, salsoline A, showed higher relative concentrations in the shoots of S. collina (Table S2). Therefore, we speculate that the shoots of S. collina have higher medicinal value.
5. Conclusions
In this study, we identified the chemical components of S. collina using a widely targeted metabolomics method. A total of 637 putative metabolites were detected in both the shoots and roots of S. collina. Flavonoids, alkaloids, lignans and coumarins were the main putative bioactive compounds, and most of them showed higher relative concentrations in the shoots of S. collina. The results improve our understanding of chemical components and medicinal value in S. collina.
Supplementary Materials
The supplementary materials are available online. Figure S1: Total ion chromatogram of the L-Sc and R-Sc under negative ion mode (A) and positive ion mode (B). Figure S2: OPLS-DA model validation diagram. Figure S3: KEGG pathway classification of the differential metabolites in the L-Sc vs. R-Sc dataset. Table S1: List and characteristics of the metabolites identified and quantified in S. collina. Table S2: List of differentially accumulated metabolites in the L-Sc vs. R-Sc dataset. Table S3: Statistics of differentially accumulated metabolites between L-Sc and R-Sc. Table S4: List of KEGG pathway in the L-Sc vs. R-Sc dataset.
Author Contributions
S.L. and H.Y. conceived and designed the research. S.L. conducted most of the experiments, including sample collection, metabolites identification and quantification, differentially accumulated metabolites identification and antioxidant components analysis. Y.C. participated in sample collection, metabolites identification and quantification, and differentially accumulated metabolites identification. Y.D., Y.Z., D.Z. and L.Z. participated in the data analysis. S.L. and Y.C. wrote the paper. All authors have read and agreed to the published version of the manuscript.
Funding
This research was supported by the Key Science and Technology Program of Henan Province (NO. 212102110183).
Data Availability Statement
The data presented in this study are available in Supplementary Materials.
Conflicts of Interest
The authors declare no conflict of interest.
Sample Availability
Samples of the compounds are available from the authors.
Footnotes
Publisher’s Note: MDPI stays neutral with regard to jurisdictional claims in published maps and institutional affiliations.
References
- 1.Kong X. Chenopodiaceae. In: Editorial Committee of Chinese Flora, editor. Flora Repubulicae Popularis Sinicae. Volume 25. Science Press; Beijing, China: 1979. p. 176. [Google Scholar]
- 2.Compilation Group of National Compilation of Chinese Herbal Medicine . National Compilation of Chinese Herbal Medicine. People′s Medical Publishing House; Beijing, China: 1975. pp. 796–797. [Google Scholar]
- 3.Meng X.P., Liu J.X. Antihypertensive effects of alcoholic extracts from Salsola. Mod. Food Sci. Technol. 2007;23:17–19. [Google Scholar]
- 4.Liu D.F., Dong Z.M., Zhang Z.X., Zhu X.W., Wang H.Y., Wang N. Development of fermented milk drink containing Salsola collina juice. Beverage Ind. 2009;12:24–28. [Google Scholar]
- 5.Lee H.J., Pan C.H., Kim E.S., Kim C.Y. Online high performance liquid chromatography (HPLC)-ABTS+ based assay and HPLC-electrospray ionization mass spectrometry analysis of antioxidant phenolic compounds in Salsola komarovii. J. Korean Soc. Appl. Biol. Chem. 2012;55:317–321. doi: 10.1007/s13765-012-1153-2. [DOI] [Google Scholar]
- 6.Tundis R., Loizzo M.R., Statti G.A., Menichini F. Inhibitory effects on the digestive enzyme α-amylase of three Salsola species (Chenopodiaceae) in vitro. Pharmazie. 2007;62:473–475. [PubMed] [Google Scholar]
- 7.Nanjing University of Traditional Chinese Medicine . The Dictionary of Chinese Herbal Medicine. 1st ed. Shanghai Scientific & Technical Publishers; Shanghai, China: 2006. pp. 3070–3071. [Google Scholar]
- 8.Wang S., Yan M., Guo Y., Sun R., Jin H., Gong Y. In vivo and in vitro effects of Salsola collina on gastrointestinal motility in rats. Iran J. Basic Med. Sci. 2020;23:383. doi: 10.22038/IJBMS.2019.40613.9605. [DOI] [PMC free article] [PubMed] [Google Scholar]
- 9.Zhao X., Wang H., Zhang Z., Jin H., Gong Y. Effects of ethyl acetate extract of Salsola collina on brain-gut peptides and interstitial cells of gastric Cajal in rats with diabetic gastroparesis. Iran J. Basic Med. Sci. 2020;23:1218–1224. doi: 10.22038/ijbms.2020.43521.10223. [DOI] [PMC free article] [PubMed] [Google Scholar]
- 10.Zhao X.L., Yuan W., Li Z.Z., Jin H., Gong Y.L. IOP Conference Series: Earth and Environmental Science. Vol. 559. IOP Publishing Ltd.; Bristol, UK: 2020. Salsola collina ethyl acetate extract alleviates diabetic gastroparesis possibly through oxidative stress inhibition; p. 012021. [Google Scholar]
- 11.Oh Y.N., Jin S., Park H.J., Kwon H.J., Kim B.W. Anti-oxidative and anti-cancer activities by cell cycle regulation of Salsola collina extract. Microbiol. Biotechnol. Lett. 2014;42:73–81. doi: 10.4014/kjmb.1311.11009. [DOI] [Google Scholar]
- 12.Nikiforov S.B., Semenov A.A., Syrchina A.I. Effect of an aqueous extract of Salsola collina on the course of experimental cholelithiasis in rabbits. Pharm. Chem. J. 2002;36:496–499. doi: 10.1023/A:1021801023600. [DOI] [Google Scholar]
- 13.Mayakova T.I., Leont’Eva V.G., Zharkaya T.I., Semenov A.A., Kuznetsova E.E., Chupin S.P. Sterols of salsola collina. Chem. Nat. Compd. 1984;20:507. doi: 10.1007/BF00574357. [DOI] [Google Scholar]
- 14.Syrchina A.I., Vereshchagin A.L., Larin M.F., Semenov A.A. Flavonoids of salsola collina. Chem. Nat. Compounds. 1989;25:619–620. doi: 10.1007/BF00598093. [DOI] [Google Scholar]
- 15.Syrchina A.I., Chernykh E.A., Rafeichikova I.V., Zaikov K.L., Vereshchagin A.L. Carbohydrates, carbohydrate ethers, and alcohols of Salsola collina. Chemistry of Natural Compounds. 1991;27:364. [Google Scholar]
- 16.Zhao Y.X., Ding X.B. Studies on the alkaloids from Salsola collina Pall. Acta Pharm. Sin. 2004;39:598–600. [PubMed] [Google Scholar]
- 17.Xiang Y., Li Y.B., Zhang J., Li P., Yao Y.Z. Studies on chemical constituents of Salsola collina. China J. Chin. Mater. Med. 2007;32:409–413. [PubMed] [Google Scholar]
- 18.Jin Y.S., Du J.L., Yang Y., Jin L., Song Y., Zhang W., Chen H.S. Chemical and biologically active constituents of Salsola collina. Chem. Nat. Compd. 2011;47:257–260. doi: 10.1007/s10600-011-9896-2. [DOI] [Google Scholar]
- 19.Wang X.J., Zhao Y.X., Jia X.H., Ding X.B. Studies on the chemical constituents of Salsola collina. J. Chin. Med. Mater. 2011;34:230–231. [PubMed] [Google Scholar]
- 20.Ghorab H., Khettaf A., Lehbili M., Kabouche A., Magid A.A., Harakat D., Voutquenne-Nazabadioko L., Kabouche Z. A new cardenolide and other compounds from Salsola tetragona. Nat. Prod. Commun. 2017;12:1934578X1701200102. doi: 10.1177/1934578X1701200102. [DOI] [PubMed] [Google Scholar]
- 21.Wang C., Zhang N., Wang Z., Qi Z., Zhu H., Zheng B., Li P., Liu J. Nontargeted metabolomic analysis of four different parts of Platycodon grandiflorum grown in northeast China. Molecules. 2017;22:1280. doi: 10.3390/molecules22081280. [DOI] [PMC free article] [PubMed] [Google Scholar]
- 22.Xiao C., Wu M., Chen Y., Zhang Y., Zhao X., Zheng X. Revealing Metabolomic Variations in Cortex Moutan from Different Root Parts using HPLC–MS method. Phytochem. Anal. 2015;26:86–93. doi: 10.1002/pca.2539. [DOI] [PubMed] [Google Scholar]
- 23.Dey P., Chaudhuri T.K. Metabolomic Fingerprinting of the Volatiles in Different Parts of Streptocaulon sylvestre. J. Herbs Spices Med. Plants. 2017;23:308–319. [Google Scholar]
- 24.Wei G., Dong L., Yang J., Zhang L., Xu J., Yang F., Cheng R., Xu R., Chen S. Integrated metabolomic and transcriptomic analyses revealed the distribution of saponins in Panax notoginseng. Acta Pharm. Sin. B. 2018;8:458–465. doi: 10.1016/j.apsb.2017.12.010. [DOI] [PMC free article] [PubMed] [Google Scholar]
- 25.Li H., Lv Q., Ma C., Qu J., Cai F., Deng J., Huang J., Ran P., Shi T., Chen Q. Metabolite profiling and transcriptome analyses provide insights into the flavonoid biosynthesis in the developing seed of tartary buckwheat (Fagopyrum tataricum) J. Agric. Food Chem. 2019;67:11262–11276. doi: 10.1021/acs.jafc.9b03135. [DOI] [PubMed] [Google Scholar]
- 26.Meng J., Wang B., He G., Wang Y., Tang X., Wang S., Ma Y., Fu C., Chai G., Zhou G. Metabolomics integrated with transcriptomics reveals redirection of the phenylpropanoids metabolic flux in Ginkgo biloba. J. Agric. Food Chem. 2019;67:3284–3291. doi: 10.1021/acs.jafc.8b06355. [DOI] [PubMed] [Google Scholar]
- 27.Wang F., Chen L., Chen H., Chen S., Liu Y. Analysis of flavonoid metabolites in citrus peels (Citrus reticulata “Dahongpao”) using UPLC-ESI-MS/MS. Molecules. 2019;24:2680. doi: 10.3390/molecules24152680. [DOI] [PMC free article] [PubMed] [Google Scholar]
- 28.Wang Y., Liang X., Li Y., Fan Y., Li Y., Cao Y., An W., Shi Z., Zhao J., Guo S. Changes in metabolome and nutritional quality of Lycium barbarum fruits from three typical growing areas of China as revealed by widely targeted metabolomics. Metabolites. 2020;10:46. doi: 10.3390/metabo10020046. [DOI] [PMC free article] [PubMed] [Google Scholar]
- 29.Chen W., Gong L., Guo Z., Wang W., Zhang H., Liu X., Yu S., Xiong L., Luo J. A novel integrated method for large-scale detection, identification, and quantification of widely targeted metabolites: Application in the study of rice metabolomics. Mol. Plant. 2013;6:1769–1780. doi: 10.1093/mp/sst080. [DOI] [PubMed] [Google Scholar]
- 30.Woldu Y., Abegaz B. Isoflavonoids from Salsola somalensis. Phytochemistry. 1990;29:2013–2015. doi: 10.1016/0031-9422(90)85058-N. [DOI] [Google Scholar]
- 31.Xu S., Ge X., Li S., Guo X., Dai D., Yang T. Discrimination of Different Parts of Saffron by Metabolomic-Based Ultra-Performance Liquid Chromatography Coupled with High-Definition Mass Spectrometry. Chem. Biodivers. 2019;16:e1900363. doi: 10.1002/cbdv.201900363. [DOI] [PubMed] [Google Scholar]
- 32.Sun X., Li L., Pei J., Liu C., Huang L.F. Metabolome and transcriptome profiling reveals quality variation and underlying regulation of three ecotypes for Cistanche deserticola. Plant Mol. Biol. 2020;102:253–269. doi: 10.1007/s11103-019-00944-5. [DOI] [PubMed] [Google Scholar]
Associated Data
This section collects any data citations, data availability statements, or supplementary materials included in this article.
Supplementary Materials
Data Availability Statement
The data presented in this study are available in Supplementary Materials.


