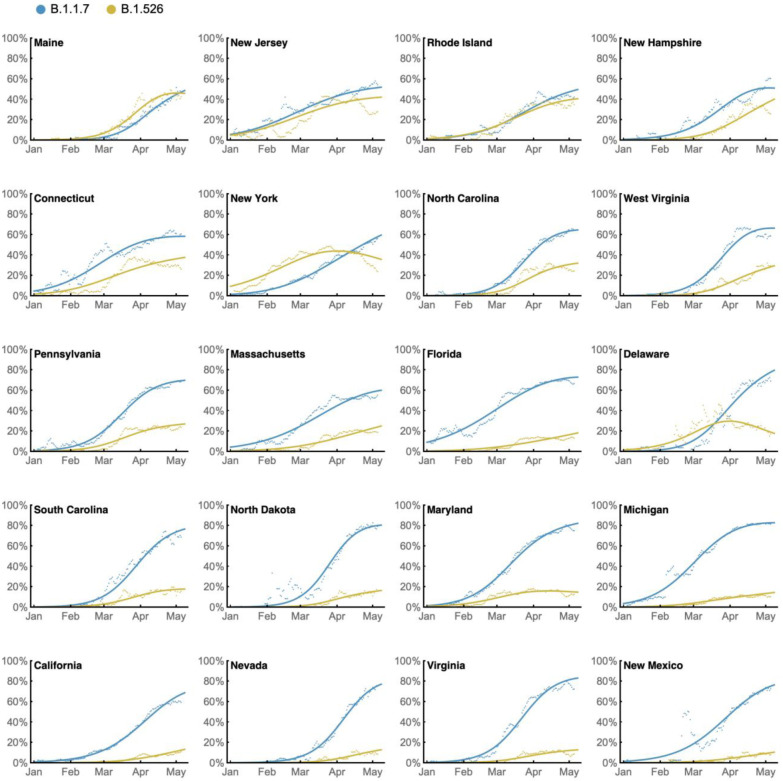
Extended Data Figure 4. State-level growth dynamics of B.1.526 and B.1.1.7.
Daily state-level frequencies of B.1.526 (in yellow) and B.1.1.7 (in blue), based on GISAID data downloaded on June 6, 2021, were used to plot 7-day sliding window averages of the prevalence of each lineage (shown as dots in the figure). A 4-parameter multinomial logistic regression model was fit directly to the observation data, in which both B.1.1.7 and B.1.526 have parameters specified for frequency at day 0 (January 1, 2021) and logistic growth rate (shown as lines in the figure). States are ordered according to frequency of B.1.526 at the final timepoint of May 8, 2021.

