Abstract
Background
Proton density fat fraction (PDFF) estimated by using chemical shift–encoded (CSE) MRI is an accepted imaging biomarker of hepatic steatosis. This work aims to promote standardized use of CSE MRI to estimate PDFF.
Purpose
To assess the accuracy of CSE MRI methods for estimating PDFF by determining the linearity and range of bias observed in a phantom.
Materials and Methods
In this prospective study, a commercial phantom with 12 vials of known PDFF values were shipped across nine U.S. centers. The phantom underwent 160 independent MRI examinations on 27 1.5-T and 3.0-T systems from three vendors. Two three-dimensional CSE MRI protocols with minimal T1 bias were included: vendor and standardized. Each vendor’s confounder-corrected complex or hybrid magnitude-complex based reconstruction algorithm was used to generate PDFF maps in both protocols. The Siemens reconstruction required a configuration change to correct for water-fat swaps in the phantom. The MRI PDFF values were compared with the known PDFF values by using linear regression with mixed-effects modeling. The 95% CIs were calculated for the regression slope (ie, proportional bias) and intercept (ie, constant bias) and compared with the null hypothesis (slope = 1, intercept = 0).
Results
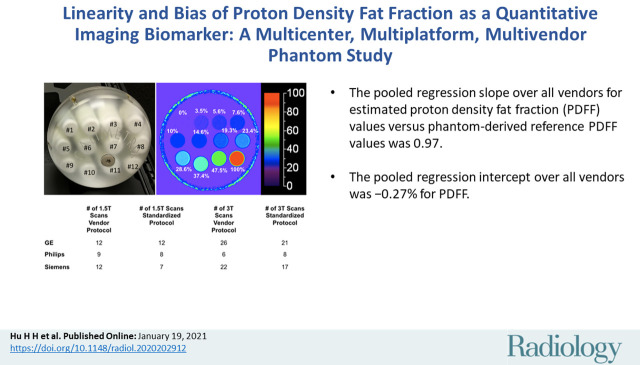
Pooled regression slope for estimated PDFF values versus phantom-derived reference PDFF values was 0.97 (95% CI: 0.96, 0.98) in the biologically relevant 0%–47.5% PDFF range. The corresponding pooled intercept was −0.27% (95% CI: −0.50%, −0.05%). Across vendors, slope ranges were 0.86–1.02 (vendor protocols) and 0.97–1.0 (standardized protocol) at 1.5 T and 0.91–1.01 (vendor protocols) and 0.87–1.01 (standardized protocol) at 3.0 T. The intercept ranges (absolute PDFF percentage) were −0.65% to 0.18% (vendor protocols) and −0.69% to −0.17% (standardized protocol) at 1.5 T and −0.48% to 0.10% (vendor protocols) and −0.78% to −0.21% (standardized protocol) at 3.0 T.
Conclusion
Proton density fat fraction estimation derived from three-dimensional chemical shift–encoded MRI in a commercial phantom was accurate across vendors, imaging centers, and field strengths, with use of the vendors’ product acquisition and reconstruction software.
© RSNA, 2021
See also the editorial by Dyke in this issue.
Summary
Proton density fat fraction estimated by using chemical shift–encoded MRI in a commercial phantom was accurate across three vendors, nine imaging centers, and two magnetic field strengths, with use of two protocols and complex or hybrid magnitude-complex based vendor reconstruction software.
Key Results
■ Pooled regression slope for estimated proton density fat fraction (PDFF) values versus phantom-derived reference PDFF values was 0.97. Slope ranged from 0.86 to 1.02 (vendor protocols) and from 0.97 to 1.0 (standardized protocol) at 1.5 T and from 0.91 to 1.01 (vendor protocols) and from 0.87 to 1.01 (standardized protocol) at 3.0 T.
■ Pooled regression intercept was −0.27% PDFF. Intercept (absolute PDFF percentage) ranged from −0.65% to 0.18% (vendor protocols) and −0.69% to −0.17% (standardized protocol) at 1.5 T and −0.48% to 0.10% (vendor protocols) and −0.78% to −0.21% (standardized protocol) at 3.0 T.
Introduction
Abnormal hepatic intracellular triglyceride accumulation (ie, hepatic steatosis) is the earliest and hallmark feature of nonalcoholic fatty liver disease (1). Nonalcoholic fatty liver disease is the leading cause of liver disease in the Western World and affects an estimated 1 billion people worldwide (2). Nonalcoholic steatohepatitis, its aggressive form, is widely expected to become the leading liver transplantation indication in the coming decade (2). Furthermore, hepatic steatosis increasingly is recognized as an independent risk factor for cardiovascular disease, cancer, metabolic disorders, and obesity (3–7). Accordingly, there is interest in developing noninvasive, accurate, and precise methods to quantify hepatic steatosis for diagnosis, quantitative staging, and treatment monitoring of nonalcoholic fatty liver disease. Confounder-corrected chemical shift–encoded (CSE) MRI proton density fat fraction (PDFF) is an accurate and precise biomarker of hepatic steatosis (8–11). CSE MRI methods are increasingly used for both research and clinical purposes in the liver and in other organs and are commercially available on multiple vendor platforms (12,13). Repeatability and reproducibility of CSE MRI–derived PDFF have been investigated in vitro and in vivo (14–22).
In 2015 the PDFF Biomarker Committee was formed within the Quantitative Imaging Biomarkers Alliance (QIBA) of the Radiological Society of North America. The committee was tasked with promoting standardized use and facilitating widespread adoption of MRI-based PDFF for clinical care and research and with developing technical standards on the basis of in vivo data from the literature. One of the QIBA missions is to characterize biomarker accuracy through assessment of biomarker linearity (ie, proportional) and bias (ie, constant) under expected hardware and software variations in clinical practice—for example, magnetic field strength and vendor-specific image reconstruction algorithms.
Although linearity and bias of MRI-derived PDFF have been validated in vivo against MR spectroscopy–derived PDFF as reference standard (23), there is a lack of definitive data validating linearity and bias across vendors, platforms, and magnetic field strength against an independent non–MRI-based reference standard. Therefore, the purpose of our work was to assess the accuracy of commercially available CSE MRI methods for estimating PDFF in a multicenter, multivendor, multiplatform round-robin phantom study at 1.5 T and 3.0 T at nine academic centers. The data from this study will inform future technical development of CSE MRI methods for PDFF estimation and establish appropriate boundaries and limits on bias. The data will provide confirmation of linearity and bias of MRI-derived PDFF, thus guiding QIBA and other technical specifications for PDFF as a quantitative imaging biomarker of fat content (24,25), including in organs and tissue beyond the liver (26–28).
Materials and Methods
This prospective study was conducted at nine participating centers affiliated with the QIBA PDFF Biomarker Committee between September 2018 and October 2019. The study included no human participants and was exempt from institutional board review and Health Insurance Portability and Accountability Act requirements.
Phantom
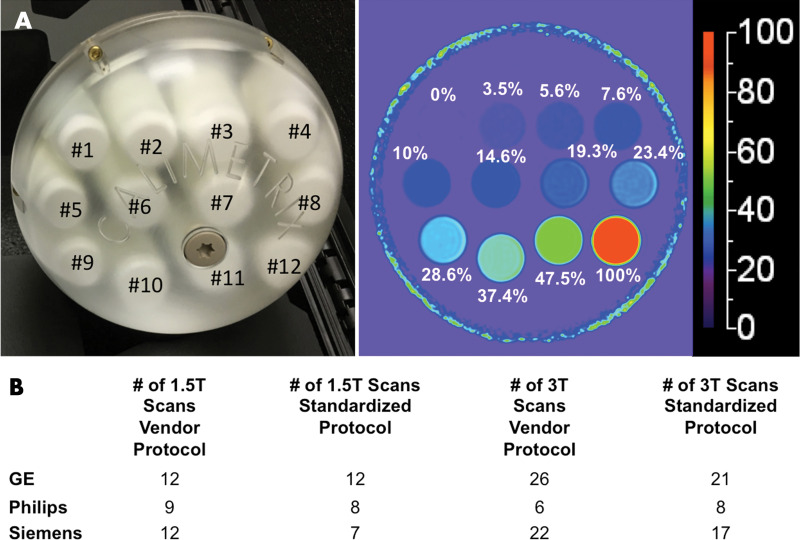
A single, commercially available PDFF phantom (Fat Fraction Phantom, Model 300; Calimetrix) was constructed from 12 vials (20 mL, 27 mm in diameter, 61 mm long). The volume of the emulsion ingredients defined the reference PDFF values in each vial, which were verified by standard Calimetrix quality procedures. A representative photograph and PDFF map of the phantom is shown in Figure 1. The PDFF values of these vials were selected to capture the relevant biologic range of PDFF in human liver (0% to ∼50%) and the entire physical range (0%–100%). The vials were agar gel based, with the exception of the 100% PDFF vial, to avoid motion-related artifacts (ie, vibrations) and to minimize susceptibility artifacts caused by air bubbles. The vials were housed within a spherical acrylic casing (19-cm outer diameter) filled with doped water to optimize magnetic field homogeneity. The phantom was shipped between centers during the study period by next-day courier. When not in use, the phantom was kept in a foam-padded storage case at room temperature. At each center, staff was instructed to allow the phantom to equilibrate to room temperature in the MRI suite before imaging.
Figure 1:
A, Photograph of phantom, which consisted of spherical acrylic housing containing 12 vials with known proton density fat fraction (PDFF) values, submerged in contrast medium–doped water bath. Representative PDFF parametric map with 0%–100% color scale. Phantom-derived reference PDFF values are shown based on volumes of ingredients used. B, Total number of examinations performed, categorized according to protocol, magnetic field strength, and vendor.
Imaging Experiments
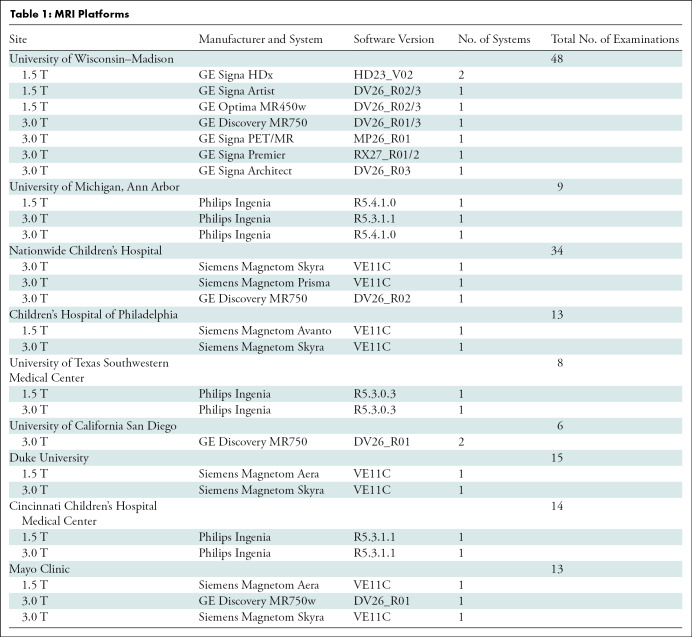
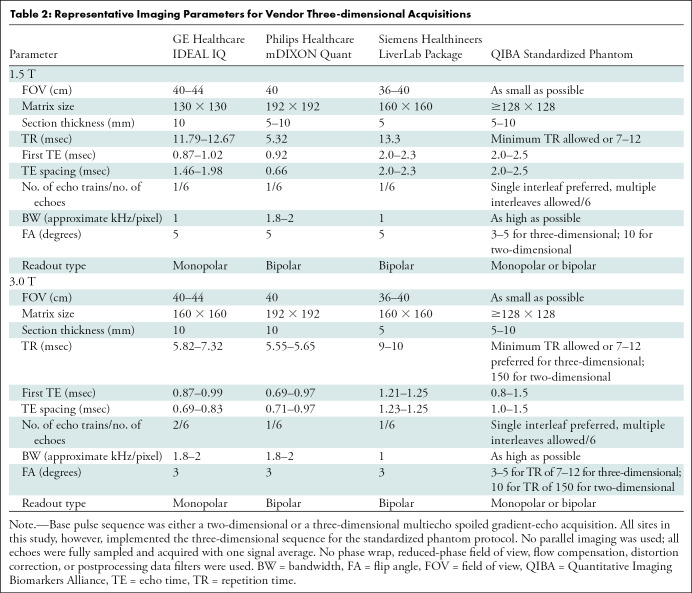
Table 1 summarizes the details of the nine imaging centers and their MRI systems. Each center was asked to acquire data by using two protocols. The first protocol was a vendor default CSE MRI PDFF protocol (LiverLab package, Siemens Healthineers; mDIXON Quant, Philips Healthcare; IDEAL IQ, GE Healthcare). Each center ran this protocol with default system parameters for the acquisition. The second protocol was a standardized protocol developed for phantom imaging by the QIBA PDFF Biomarker Committee for this study. Each center was requested to strictly follow parameters for the standardized protocol. On Philips platforms, adherence to the standardized protocol required the local clinical scientist to remove parameter limitations (ie, allowed range) to achieve the requested echo times. Hereafter, these will be referred to as vendor and standardized protocols, respectively. Table 2 summarizes the typical imaging parameters used for each protocol and MRI system.
Table 1:
MRI Platforms
Table 2:
Representative Imaging Parameters for Vendor Three-dimensional Acquisitions
For both protocols, three-dimensional volumetric CSE MRI image data sets were acquired in the axial orientation, centered on the phantom, capturing the cross sections of the 12 vials as shown in Figure 1. Vendor-supplied multichannel head or torso array coils were used. Online software from each vendor was used to reconstruct quantitative parametric PDFF maps, accounting for multipeak fat spectral modeling and correcting for T2* (1/R2*) decay (29–31), with no modifications to PDFF reconstruction or postprocessing parameters. Water-fat swaps were observed at all Siemens Healthineers sites in the majority of acquisitions. When water-fat swaps occurred in the phantom, they were commonly observed across the entire PDFF map, regardless of protocol. In such cases, the on-line reconstruction was repeated by utilizing a built-in option of the product reconstruction algorithm to force unswapping of the water-fat misassignment, by using a script provided by the manufacturer. The script makes a change in the configuration file accessed by the product reconstruction algorithm. Water-fat swaps in the phantom were not observed on GE Healthcare and Philips Healthcare systems used in this study. To assess temporal phantom stability, one site (University of Wisconsin–Madison) imaged the phantom with both protocols on three separate occasions across all of their imaging systems (September 2018, April 2019, and October 2019).
Image Processing
The PDFF maps were submitted to a central data processing center not affiliated with Calimetrix, any MRI vendor, or the University of Wisconsin–Madison. A single analyst (H.H.H., with 20 years of MRI experience), unblinded, reviewed each center’s data to ensure adherence to acquisition protocol parameters and to confirm absence of gross artifacts. The analyst subsequently made all PDFF estimations with software (OsiriX MD 10; Pixmeo). A single, large, circular region of interest (∼3.5–4 cm2) was drawn on the cross section of each vial.
Statistical Analysis
A separate team member (T.Y., with 20 years of experience) performed statistical analysis under supervision of a faculty biostatistician (N.O., with 30 years of experience). These investigators were not affiliated with Calimetrix, the University of Wisconsin–Madison, or any MRI vendor. Statistical analyses were performed with software (R version 3.6.3; R Foundation for Statistical Computing).
Linearity was assessed over the biologically relevant range for human liver fat (ie, 0% to ∼50% PDFF) and over the entire physical range of 0%–100% PDFF. This was done by fitting the MRI data collected on the 0%–47.5% vials (ie, biologically relevant range) and the 0%–100% vials (ie, full physical PDFF range), respectively, at all imaging centers and by using all vendors, magnetic field strengths, and protocols. Linearity, or lack of nonlinearity, is generally assessed by comparing a linear fit with alternative nonlinear (ie, quadratic, cubic, and higher order polynomial) fits. Per typical QIBA convention, a linear model (y = c0 + c1*x), a quadratic model (y = c0 + c1*x + c2*x2), and a cubic model (y = c0 + c1*x + c2*x2 + c3*x3) were postulated herein, where phantom-derived reference PDFF value was the independent variable and estimated PDFF was the dependent variable. The second-degree quadratic coefficient c2 and its 95% CI were compared with the maximum acceptable value of c2 less than 0.01, above which the quadratic effect of a quantitative imaging biomarker cannot be ignored in clinical use (32).
Estimation bias of MRI PDFF was assessed against phantom-derived reference PDFF values by using linear regression with mixed-effects modeling. The regression intercept (ie, constant bias) and the slope (ie, proportional bias) were compared with the null hypotheses of intercept of 0 and slope of 1, respectively, and 95% CIs were predominantly used. Repeated examinations in the same system per vial were modeled as a random effect. Because scanners from different vendors at different field strengths were unequally represented in the sample (Table 1), inverse probability sampling weights were used in the fitting procedure, where appropriate, to correct for the imbalanced population of MRI systems. For point estimates, 95% CIs outside of the null hypothesis (ie, P < .05) were considered to indicate a statistically significant difference.
Next, the PDFF estimation bias assessment was stratified for each combination of vendor and field strength, graphically by using scatter plots and statistically by using mixed-model regression, with repeated examinations modeled as a random effect. Regression intercept and slope estimates and their 95% CIs were compared with the null hypotheses of intercept of 0 and slope of 1, respectively. Bias was also compared between the two protocols by calculating the magnitude of biases in estimated intercept and slope (between 0 and 1, respectively) and by testing the statistical significance of their differences by using bootstrap 95% CIs. Bias in the regression intercept and slope was also assessed on a per-scanner basis.
Last, potential temporal drift in the phantom-derived reference PDFF values was assessed by comparing PDFF values between paired points (September 2018 vs April 2019, April 2019 vs October 2019). Analysis was performed by using a mixed-effects linear model, with repeated estimations on the same vial in the same imaging session modeled as a random effect.
A priori sample-size calculation was not performed. Instead, we required at least three different MRI systems for each combination of vendor and magnetic field strength to calculate the mean and standard deviation of each point estimate.
Results
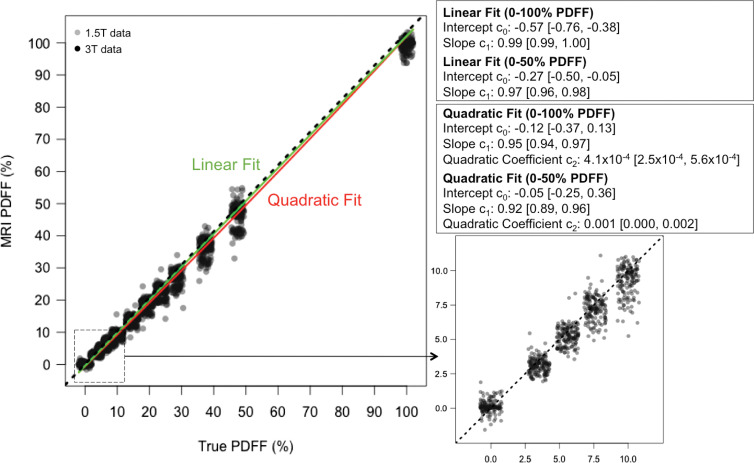
At all centers, data from both protocols were successfully acquired. MRI PDFF linearity was assessed by comparing the linear and alternative quadratic model fits (Fig 2). The second-degree coefficient (c2) was significant but very close to 0, regardless of whether it was calculated from the 0%–50% or 0%–100% PDFF data. The 95% CI for c2 did not exceed the 0.01 threshold for clinically significant nonlinearity (32). A third-degree cubic fit yielded c0 = −0.001 (95% CI: −0.38, 0.38), c1 = 0.94 (95% CI: 0.86, 1.02), c2 = 0.00 (95% CI: −0.01, 0.01), and c3 = −4.3 (95% CI: −4.3, 7.1) × 10−5, further confirming the small contribution from nonlinear terms. Therefore, linear modeling was used for all subsequent analyses. Pooling across all vendors, magnetic field strengths, protocols, and systems, the intercept and slope of the linear model were lower than the identity line, with absolute PDFF percentage of the intercept equal to −0.27% (95% CI: −0.50, −0.05) and the slope equal to 0.97 (95% CI: 0.96, 0.98), but the differences from ideal intercept of 0 and slope of 1 (ie, null hypothesis) were small (Fig 2).
Figure 2:
Plots show chemical shift–encoded MRI-based proton density fat fraction (PDFF) versus phantom’s reference PDFF values, summarizing linear (green) and quadratic (red) regression fits. Data pooled from all acquisitions, independent of protocol, magnetic field strength, and vendor. Dashed line represents identity. Corresponding table shows linear and quadratic regression fit parameters for entire physical range (0%–100% PDFF). For comparison, linear and quadratic regression fit parameters for biologically relevant PDFF range (0%–47.5%) were also computed. Enlarged inset further illustrates data from 0%–10% PDFF, showing strong linearity of measurements in low-PDFF range.
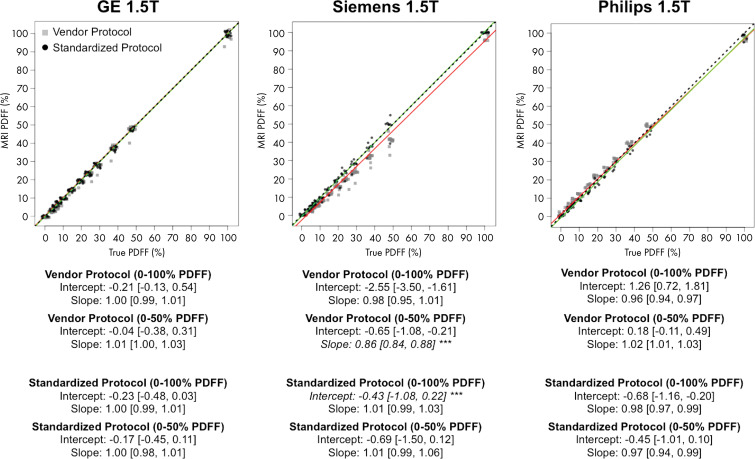
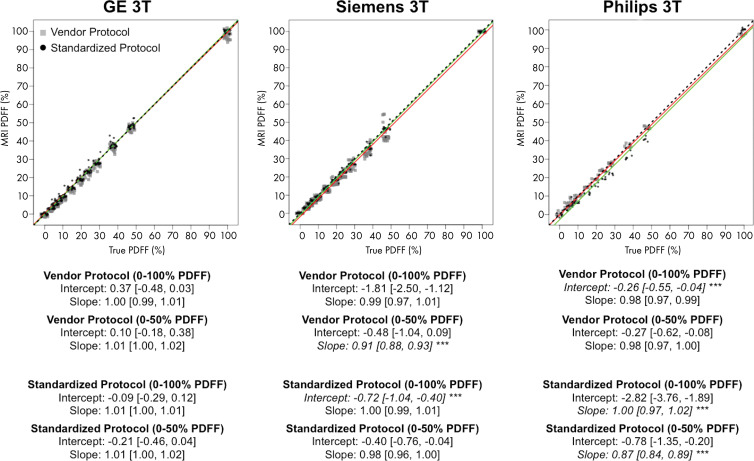
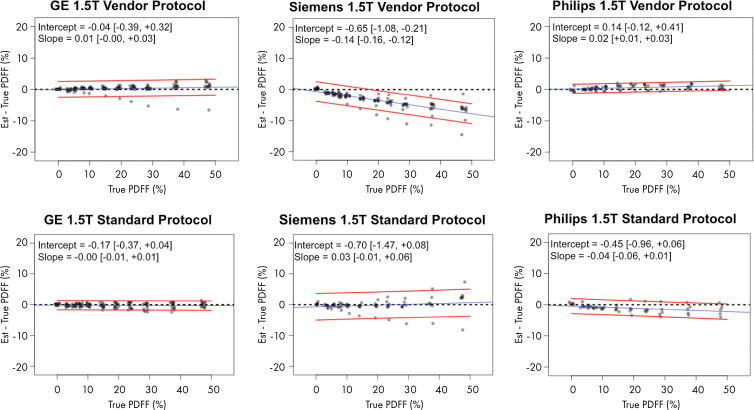
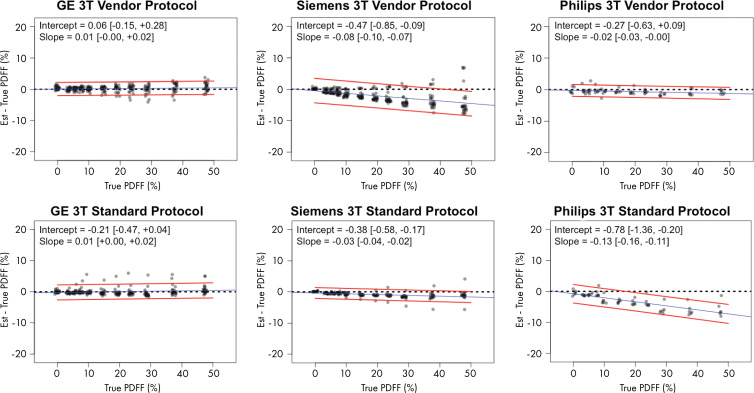
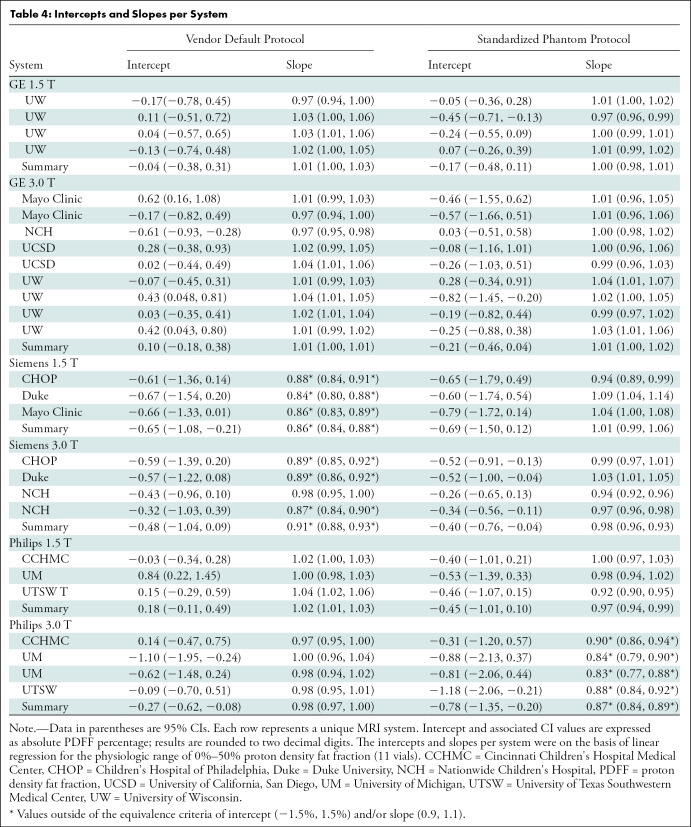
The results of the stratified regression analyses per vendor and magnetic field strength are shown in Figures 3 and 4. Again, separate regression coefficients for 0%–50% PDFF and 0%–100% PDFF are presented. The differences in bias because of protocol (vendor default vs standardized protocol) are further summarized in Table 3. Figure 5 illustrates the data as residual plots, highlighting differences between vendors, magnetic field strength, and protocol. On GE Healthcare systems with IDEAL IQ (Fig 5), no deviation from the identity line was observed in the intercepts or slopes regardless of the protocols, magnetic field strengths, or PDFF range of regression (0%–50% vs 0%–100%), with the 95% CIs of the intercept and slope estimates inclusive of the values 0 and 1, respectively.
Figure 3:
Plots show chemical shift–encoded MRI-based proton density fat fraction (PDFF) versus phantom-derived reference PDFF values, categorized according to vendor (columns), at 1.5 T. Data have been slightly jittered for visualization purposes. Red line represents linear regression fit of vendor protocol data, and green line represents regression fit of standardized phantom protocol data. The two lines nearly overlap in some instances. Regression parameters are summarized below each plot for 0%–47.5% PDFF and for 0%–100% PDFF ranges. Asterisks (***) and italicized text under each subplot indicate statistically smaller bias (ie, intercept and/or slope) compared with other protocol for given vendor, magnetic field strength, and PDFF range considered. Dashed lines represent identity. Data in brackets are 95% CIs.
Figure 4:
Plots show chemical shift–encoded MRI-based proton density fat fraction (PDFF) versus phantom-derived reference PDFF values, categorized according to vendor (columns), at 3.0 T. Data have been slightly jittered for visualization purposes. Red line represents linear regression fit of vendor protocol data, and green line represents regression fit of standardized phantom protocol data. The two lines nearly overlap in some instances. Regression parameters are summarized below each plot for 0%–47.5% PDFF and for 0%–100% PDFF ranges. Asterisks (***) and italicized text under each subplot indicate statistically smaller bias (ie, intercept and/or slope) compared with other protocol for given vendor, magnetic field strength, and PDFF range considered. Dashed lines represent identity. Data in brackets are 95% CIs.
Table 3:
Bias Comparison of Vendor Default versus Standardized Phantom Protocols
Figure 5a:
Plots show chemical shift–encoded MRI-based proton density fat fraction (PDFF) versus phantom-derived reference PDFF values, categorized according to vendor and protocol, shown for (a) 1.5 T and (b) 3.0 T. Difference between estimated (est.) PDFF versus reference (ie, true) PDFF is plotted on y-axis. Dashed black line denotes zero error. Blue line is linear regression fit of data. Two accompanying red lines are 95% prediction interval bounds. Data in brackets are 95% CIs.
Figure 5b:
Plots show chemical shift–encoded MRI-based proton density fat fraction (PDFF) versus phantom-derived reference PDFF values, categorized according to vendor and protocol, shown for (a) 1.5 T and (b) 3.0 T. Difference between estimated (est.) PDFF versus reference (ie, true) PDFF is plotted on y-axis. Dashed black line denotes zero error. Blue line is linear regression fit of data. Two accompanying red lines are 95% prediction interval bounds. Data in brackets are 95% CIs.
On Siemens Healthineers systems with the LiverLab package (Fig 5), no bias in intercept was found regardless of the protocol or magnetic field strength with 95% CIs including 0. However, the slope was biased away from 1 for the vendor protocol, with values of 0.86 (95% CI: 0.85, 0.88) at 1.5 T and 0.91 (95% CI: 0.89, 0.94) at 3.0 T. However, no bias was found in the slope at either magnetic field strength with the standardized protocol, with 95% CIs inclusive of the ideal value 1. The standardized protocol was less biased than the vendor protocol in slope (differences in bias 95% CI: 0.07, 0.16; exclusive of 0) at 1.5 T, but not at 3.0 T (Table 3).
On Philips Healthcare systems with mDIXON Quant (Fig 5), no bias in intercept or slope was found for the vendor protocol at either magnetic field strength, with 95% CIs including 0 and 1, respectively. By using the standardized protocol, however, the slope was 0.97 (95% CI: 0.94, 0.99) at 1.5 T, and at 3.0 T the slope was 0.87 (95% CI: 0.84, 0.89). Both slopes were biased from identity. This may be because the echo times of the standardized protocol were outside the permissible range for the default Philips mDIXON Quant inversion algorithm. Although the standardized protocol parameters were achievable after the local clinical scientist removed such parameter constraints in the software, the resultant PDFF could have consequentially become more biased.
Figure 5 illustrates the data as residual plots, highlighting differences between vendors, magnetic field strength, and protocol. Individual scanner accuracy and bias assessments are shown in Table 4.
Table 4:
Intercepts and Slopes per System
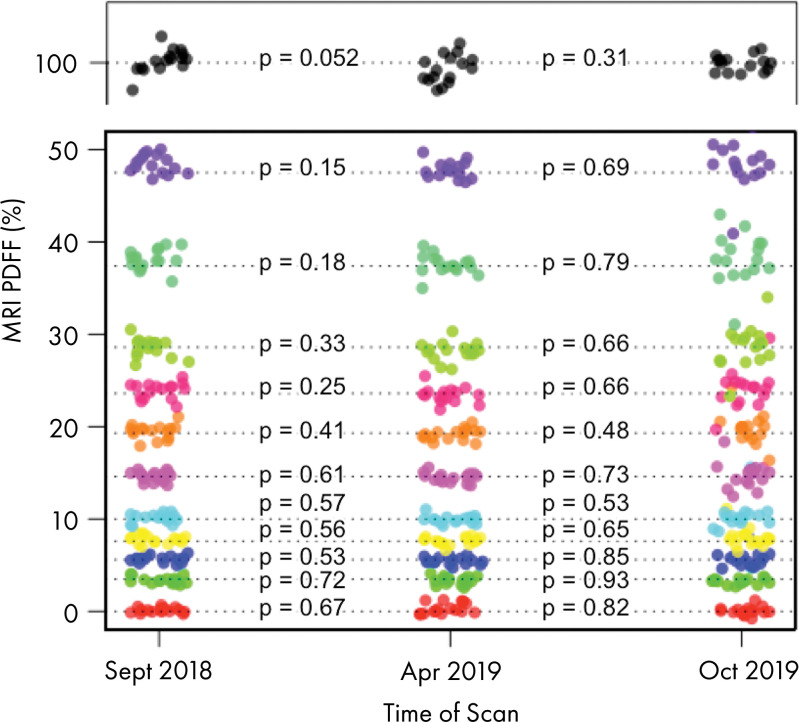
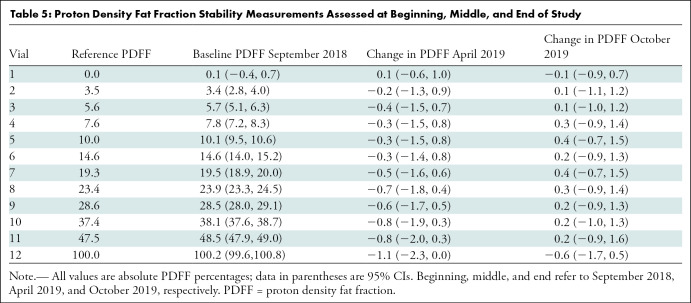
The temporal stability data of the PDFF phantom are shown in Figure 6 and Table 5. The greatest change was a mere −0.8% (95% CI: −2.0, 0.3), observed in the 47.5% vial. No temporal drift of 2.0% or greater in absolute PDFF occurred in any of the 0%–47.5% vials.
Figure 6:
Image shows results of repeated assessments of phantom during span of 13 months. Different colors denote each of 12 vials, and each point represents one acquisition. P values across three points for each vial are shown and reveal that no vial-specific changes in proton density fat fraction (PDFF) values were detected. Apr = April, Oct = October, Sept = September.
Table 5:
Proton Density Fat Fraction Stability Measurements Assessed at Beginning, Middle, and End of Study
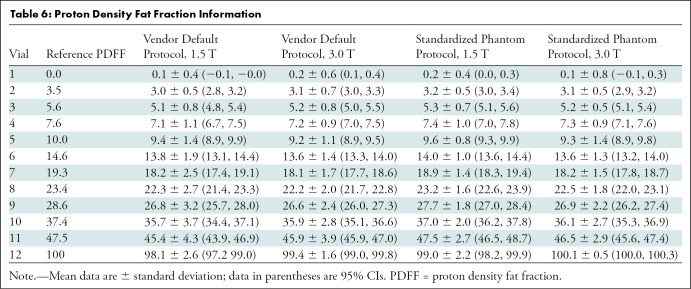
Finally, Table 6 summarizes distributions of PDFF across magnetic field strength and protocols by pooling data from all centers and across the three vendors.
Table 6:
Proton Density Fat Fraction Information
Discussion
Proton density fat fraction (PDFF) estimated by using chemical shift–encoded (CSE) MRI is an accepted imaging biomarker of hepatic steatosis. We performed a phantom study involving nine academic centers and multiple vendor platforms to evaluate the accuracy of CSE MRI to quantify PDFF by using vendor default and Quantitative Imaging Biomarkers Alliance (QIBA)–standardized protocols and vendor-specific reconstruction algorithms. By using a commercially available phantom, we demonstrated high linearity and low bias of CSE MRI across the entire physiologic range of PDFF values. We found that PDFF bias can depend on vendor, magnetic field strength, or protocol, but it can be controlled within the intercept range (−1.5% to 1.5%) and the slope range (0.9 to −1.1), regardless of field strength or vendor, by informed selection of the appropriate protocol (either vendor default or QIBA standardized). Specifically, GE Healthcare systems regardless of vendor or standardized protocol, Siemens systems that use standardized protocol, and Philips systems that use vendor protocol are within these bias margins. These small constant and proportional biases are unlikely to be consequential in most human clinical use cases for liver imaging and assessment. Therefore, we propose these ranges to define the acceptance bias margins for PDFF derived from commercially available quantitative CSE MRI pulse sequences.
Previously, Hernando et al (19) performed a similar study to evaluate complex-based CSE MRI methods in estimating PDFF across multiple vendors by using a centralized reconstruction pipeline. That study relied on investigational reconstruction software to reconstruct data from participating centers. More recently, Jang et al (21) performed a study evaluating three commercial CSE MRI methods on a limited number of systems by using a fat fraction phantom. That study demonstrated excellent linearity and reproducibility of the evaluated commercial CSE MRI methods. However, it also relied on investigational reconstruction software to reconstruct data from participating centers. Decoupling contributions to deviations related specifically to acquisition (hardware, pulse sequence) and PDFF reconstruction method would require reconstruction of raw data by using a common, centralized reconstruction algorithm. Use of a common approach to spectral modeling of PDFF and T2* (1/R2*) correction, for example, may reduce variability. However, use of a centralized reconstruction algorithm may not address vendor-specific hardware constraints or imperfections that are mitigated by vendor-specific reconstruction algorithms, and thus could introduce additional sources of error. In our study, we intentionally included all sources of variability and error likely to be encountered in clinical scenarios in which default vendor-supplied hardware and software are used to produce PDFF estimations.
Compared with prior works, our reference standard was a commercial PDFF phantom constructed with a wide range of PDFF values. Repeated acquisitions at one center (University of Wisconsin–Madison) demonstrated temporal phantom stability, providing important evidence that the phantom-derived reference PDFF values were stable during our study. Among the advantages of using commercial PDFF phantoms are the use of materials and geometries optimized during multiple development cycles and the use of quality controls during manufacturing and assembly. In addition, the same type of phantom can be used for comparison studies in the future.
Our study had limitations. First, although an evaluation of all commercially available CSE MRI methods was performed on the majority of available platforms, a comprehensive evaluation of all possible combinations of hardware platforms and software versions was not feasible. Second, the phantom did not modulate T2* (1/R2*) over the full physiologic range of R2* values, in particular not reflecting values seen in patients with moderate to severe iron overload. All of the CSE MRI methods assessed in our study used R2* correction (29–31) to correct for the presence of iron in vivo in patients with mild to moderate iron overload (33,34). Third, all acquisitions were performed at room temperature, and temperature can affect relative chemical shifts across water and fat resonance peaks (35,36). Differences in temperature at which imaging was performed could explain, in part, differences between estimated and reference PDFF values. The degree of the temperature dependency may also vary across vendors, imaging parameters, and reconstruction algorithms. Fourth, in the vendor protocols, we did not make any changes to parameters such as flip angle, repetition time, echo time, echo spacing, and bandwidth. Although default values for each vendor’s software were used, additional adjustments may improve acquisition time and signal-to-noise ratio, minimize T1 bias, and increase accuracy of PDFF values. Related to this, we did not explicitly measure the T1 and T2 properties of the phantom. Finally, we limited the scope of this work to complex and hybrid magnitude-complex based CSE protocols. The study can be repeated with magnitude-based CSE methods that use in-phase and opposed-phase data.
In conclusion, through this multicenter, multiplatform, multivendor round-robin phantom study across nine centers, the Quantitative Imaging Biomarkers Alliance Proton Density Fat Fraction (PDFF) Committee successfully demonstrated linearity of PDFF estimations from complex and hybrid magnitude-complex based chemical shift–encoded (CSE) MRI in a commercial phantom, and further determined the range of PDFF bias across existing commercially available CSE MRI methods at both 1.5 T and 3.0 T.
Acknowledgments
Acknowledgments
H.H.H. and M.A.S. acknowledge the assistance Lacey J. Lubeley for assistance with experiments. M.R.B. and J.S. acknowledge the assistance of Sophia Cui, PhD, from Siemens Healthineers for assistance with experiments. Y.S. acknowledges Peter Kollasch, PhD, from Siemens Healthineers for assistance with experiments. A.T.T. and J.A.T. acknowledge the assistance of Hui Wang, PhD, from Philips Healthcare for assistance with experiments. T.L.C. and D.M. acknowledge Johannes Peeters, PhD, from Philips Healthcare for assistance with experiments. All authors acknowledge Calimetrix for providing the phantom used in this study. The authors dedicate this manuscript to the memory of Dr Edward Jackson.
H.H.H. and T.Y. contributed equally to this work.
Supported by the National Institutes of Health (grants R41EB025729, R44EB025729, R01DK088925, K24DK102595, R01DK083380, R01CA23802301, and U24CA237683). Quantitative Imaging Biomarkers Alliance projects and activities have been funded in whole or in part with Federal funds from the National Institutes of Health.
Disclosures of Conflicts of Interest: H.H.H. disclosed no relevant relationships. T.Y. Activities related to the present article: disclosed no relevant relationships. Activities not related to the present article: disclosed money paid to author for consultancy from ABC Medical Education; disclosed payment for lectures from Japanese Society of MR in Medicine annual meeting, 2018. Other relationships: disclosed no relevant relationships. M.R.B. Activities related to the present article: disclosed no relevant relationships. Activities not related to the present article: disclosed money paid to author for consultancy from Corcept and Icon; disclosed money paid to author’s institution for grants/grants pending from Carmot Therapeutics, Corcept, Madrigal Pharmaceuticals, Metacrine, NGM Biopharmaceuticals, Pinnacle Clinical Research; disclosed payment to author’s institution for development of educational presentations from MedPace. Other relationships: disclosed no relevant relationships. C.B.S. Activities related to the present article: disclosed no relevant relationships. Activities not related to the present article: disclosed money to author’s institution for board membership from AMRA; disclosed money to author for consultancy from Epigenomics, Blade, Boehringer; grants/grants pending from Bayer, GE, Gilead, Philips, Siemens; payment for lectures from Resoundant; royalties from Wolters Kluwer; payment for development of educational presentations from Medscape; money to author’s institution for consultation from AMRA, BMS, Exact Sciences, GE Digital, and IBM-Watson; lab service agreements from Enanta, Gilead, ICON, Intercept, Nusirt, Shire, Synageva, Takeda. Other relationships: disclosed no relevant relationships. D.H. Activities related to the present article: disclosed no relevant relationships. Activities not related to the present article: disclosed no relevant relationships. Other relationships: disclosed that author is cofounder of Calimetrix. D.M. disclosed no relevant relationships. T.L.C. Activities related to the present article: disclosed no relevant relationships. Activities not related to the present article: disclosed money to author for patents from Philips Healthcare. Other relationships: disclosed no relevant relationships. M.A.S. disclosed no relevant relationships. S.D.S. disclosed no relevant relationships. M.S.M. Activities related to the present article: disclosed no relevant relationships. Activities not related to the present article: disclosed money paid to author for consultancy from Arrowhead, Kowa, Median, Glympse, Novo Nordisk; grants/grants pending from Guerbet; stock from GE, Pfizer. Other relationships: disclosed lab service agreements from Alexion, Gilead, Pfizer, AstraZeneca, Guerbet Roche, Bristol-Myers Squibb, Intercept, Sanofi, Celgene Ionis, Shire, Enanta, Janssen, Synageva, Galmed, NuSirt, Takeda, Genzyme, Organovo, Kowa, Median, Novo Nordisk. W.C.H. disclosed no relevant relationships. G.H. disclosed no relevant relationships. J.S. disclosed no relevant relationships. Y.S. Activities related to the present article: disclosed no relevant relationships. Activities not related to the present article: disclosed royalties from GE Healthcare. Other relationships: disclosed no relevant relationships. J.A.T. disclosed no relevant relationships. A.T.T. Activities related to the present article: disclosed no relevant relationships. Activities not related to the present article: disclosed grant from Perspectum; grant funding from Siemens Healthcare, Canon Medical Systems. Other relationships: disclosed no relevant relationships. N.O. Activities related to the present article: disclosed no relevant relationships. Activities not related to the present article: disclosed consultancy from Quantitative Imaging Biomarkers Alliance. Other relationships: disclosed no relevant relationships. J.H.B. Activities related to the present article: disclosed no relevant relationships. Activities not related to the present article: disclosed that author is an employee and owner of Calimetrix. Other relationships: disclosed ownership interests in Reveal Pharmaceuticals, Cellectar Biosciences, Elucent Medical, HeartVista. E.F.J. disclosed no relevant relationships. S.B.R. Activities related to the present article: disclosed no relevant relationships. Activities not related to the present article: disclosed that author’s institution receives research support from GE Healthcare, Bracco Diagnostics. Other relationships: disclosed that author is a founder of Calimetrix; disclosed ownership interests in Reveal Pharmaceuticals, Cellectar Biosciences, Elucent Medical, HeartVista.
Abbreviations:
- CSE
- chemical shift encoded
- PDFF
- proton density fat fraction
- QIBA
- Quantitative Imaging Biomarkers Alliance
References
- 1.Rinella ME. Nonalcoholic fatty liver disease: a systematic review. JAMA 2015;313(22):2263–2273. [DOI] [PubMed] [Google Scholar]
- 2.Estes C, Razavi H, Loomba R, Younossi Z, Sanyal AJ. Modeling the epidemic of nonalcoholic fatty liver disease demonstrates an exponential increase in burden of disease. Hepatology 2018;67(1):123–133. [DOI] [PMC free article] [PubMed] [Google Scholar]
- 3.Kumar R, Priyadarshi RN, Anand U. Non-alcoholic fatty liver disease: growing burden, adverse outcomes and associations. J Clin Transl Hepatol 2020;8(1):76–86. [DOI] [PMC free article] [PubMed] [Google Scholar]
- 4.Ahmed A, Wong RJ, Harrison SA. Nonalcoholic Fatty Liver Disease Review: Diagnosis, Treatment, and Outcomes. Clin Gastroenterol Hepatol 2015;13(12):2062–2070. [DOI] [PubMed] [Google Scholar]
- 5.Schindhelm RK, Diamant M, Heine RJ. Nonalcoholic fatty liver disease and cardiovascular disease risk. Curr Diab Rep 2007;7(3):181–187. [DOI] [PubMed] [Google Scholar]
- 6.Ismaiel A, Dumitraşcu DL. Cardiovascular Risk in Fatty Liver Disease: The Liver-Heart Axis-Literature Review. Front Med (Lausanne) 2019;6:202. [DOI] [PMC free article] [PubMed] [Google Scholar]
- 7.Targher G, Bertolini L, Padovani R, et al. Prevalence of nonalcoholic fatty liver disease and its association with cardiovascular disease among type 2 diabetic patients. Diabetes Care 2007;30(5):1212–1218. [DOI] [PubMed] [Google Scholar]
- 8.Reeder SB, Cruite I, Hamilton G, Sirlin CB. Quantitative assessment of liver fat with magnetic resonance imaging and spectroscopy. J Magn Reson Imaging 2011;34(4):729–749. [DOI] [PMC free article] [PubMed] [Google Scholar]
- 9.Zhong X, Nickel MD, Kannengiesser SA, Dale BM, Kiefer B, Bashir MR. Liver fat quantification using a multi-step adaptive fitting approach with multi-echo GRE imaging. Magn Reson Med 2014;72(5):1353–1365. [DOI] [PubMed] [Google Scholar]
- 10.Bashir MR, Zhong X, Nickel MD, et al. Quantification of hepatic steatosis with a multistep adaptive fitting MRI approach: prospective validation against MR spectroscopy. AJR Am J Roentgenol 2015;204(2):297–306. [DOI] [PubMed] [Google Scholar]
- 11.Yokoo T, Serai SD, Pirasteh A, et al. Linearity, bias, and precision of hepatic proton density fat fraction measurements by using MR imaging: a meta-analysis. Radiology 2018;286(2):486–498. [DOI] [PMC free article] [PubMed] [Google Scholar]
- 12.Gu J, Liu S, Du S, et al. Diagnostic value of MRI-PDFF for hepatic steatosis in patients with non-alcoholic fatty liver disease: a meta-analysis. Eur Radiol 2019;29(7):3564–3573. [DOI] [PubMed] [Google Scholar]
- 13.Hu HH, Branca RT, Hernando D, et al. Magnetic resonance imaging of obesity and metabolic disorders: summary from the 2019 ISMRM Workshop. Magn Reson Med 2020;83(5):1565–1576. [DOI] [PubMed] [Google Scholar]
- 14.Kang GH, Cruite I, Shiehmorteza M, et al. Reproducibility of MRI-determined proton density fat fraction across two different MR scanner platforms. J Magn Reson Imaging 2011;34(4):928–934 10.1002/jmri.22701. [DOI] [PMC free article] [PubMed] [Google Scholar]
- 15.Johnson BL, Schroeder ME, Wolfson T, et al. Effect of flip angle on the accuracy and repeatability of hepatic proton density fat fraction estimation by complex data-based, T1-independent, T2*-corrected, spectrum-modeled MRI. J Magn Reson Imaging 2014;39(2):440–447. [DOI] [PMC free article] [PubMed] [Google Scholar]
- 16.Sofue K, Mileto A, Dale BM, Zhong X, Bashir MR. Interexamination repeatability and spatial heterogeneity of liver iron and fat quantification using MRI-based multistep adaptive fitting algorithm. J Magn Reson Imaging 2015;42(5):1281–1290. [DOI] [PubMed] [Google Scholar]
- 17.Artz NS, Haufe WM, Hooker CA, et al. Reproducibility of MR-based liver fat quantification across field strength: same-day comparison between 1.5T and 3T in obese subjects. J Magn Reson Imaging 2015;42(3):811–817. [DOI] [PMC free article] [PubMed] [Google Scholar]
- 18.Wu B, Han W, Li Z, et al. Reproducibility of Intra- and Inter-scanner Measurements of Liver Fat Using Complex Confounder-corrected Chemical Shift Encoded MRI at 3.0 Tesla. Sci Rep 2016;6:19339. [DOI] [PMC free article] [PubMed] [Google Scholar]
- 19.Hernando D, Sharma SD, Aliyari Ghasabeh M, et al. Multisite, multivendor validation of the accuracy and reproducibility of proton-density fat-fraction quantification at 1.5T and 3T using a fat-water phantom. Magn Reson Med 2017;77(4):1516–1524. [DOI] [PMC free article] [PubMed] [Google Scholar]
- 20.Serai SD, Dillman JR, Trout AT. Proton density fat fraction measurements at 1.5- and 3-T hepatic MR imaging: same-day agreement among readers and across two imager manufacturers. Radiology 2017;284(1):244–254. [DOI] [PubMed] [Google Scholar]
- 21.Jang JK, Lee SS, Kim B, et al. Agreement and reproducibility of proton density fat fraction measurements using commercial MR sequences across different platforms: a multivendor, multi-institutional phantom experiment. Invest Radiol 2019;54(8):517–523. [DOI] [PubMed] [Google Scholar]
- 22.Kim HJ, Cho HJ, Kim B, et al. Accuracy and precision of proton density fat fraction measurement across field strengths and scan intervals: a phantom and human study. J Magn Reson Imaging 2019;50(1):305–314. [DOI] [PubMed] [Google Scholar]
- 23.Tyagi A, Yeganeh O, Levin Y, et al. Intra- and inter-examination repeatability of magnetic resonance spectroscopy, magnitude-based MRI, and complex-based MRI for estimation of hepatic proton density fat fraction in overweight and obese children and adults. Abdom Imaging 2015;40(8):3070–3077. [DOI] [PMC free article] [PubMed] [Google Scholar]
- 24.Hansen KH, Schroeder ME, Hamilton G, Sirlin CB, Bydder M. Robustness of fat quantification using chemical shift imaging. Magn Reson Imaging 2012;30(2):151–157. [DOI] [PMC free article] [PubMed] [Google Scholar]
- 25.Keenan KE, Biller JR, Delfino JG, et al. Recommendations towards standards for quantitative MRI (qMRI) and outstanding needs. J Magn Reson Imaging 2019;49(7):e26–e39. [DOI] [PMC free article] [PubMed] [Google Scholar]
- 26.Schlaffke L, Rehmann R, Rohm M, et al. Multi-center evaluation of stability and reproducibility of quantitative MRI measures in healthy calf muscles. NMR Biomed 2019;32(9):e4119. [DOI] [PubMed] [Google Scholar]
- 27.Schmeel FC, Vomweg T, Träber F, et al. Proton density fat fraction MRI of vertebral bone marrow: accuracy, repeatability, and reproducibility among readers, field strengths, and imaging platforms. J Magn Reson Imaging 2019;50(6):1762–1772. [DOI] [PubMed] [Google Scholar]
- 28.Bainbridge A, Bray TJP, Sengupta R, Hall-Craggs MA. Practical approaches to bone marrow fat fraction quantification across magnetic resonance imaging platforms. J Magn Reson Imaging 2020;52(1):298–306. [DOI] [PubMed] [Google Scholar]
- 29.Yu H, McKenzie CA, Shimakawa A, et al. Multiecho reconstruction for simultaneous water-fat decomposition and T2* estimation. J Magn Reson Imaging 2007;26(4):1153–1161. [DOI] [PubMed] [Google Scholar]
- 30.Yu H, Shimakawa A, McKenzie CA, Brodsky E, Brittain JH, Reeder SB. Multiecho water-fat separation and simultaneous R2* estimation with multifrequency fat spectrum modeling. Magn Reson Med 2008;60(5):1122–1134. [DOI] [PMC free article] [PubMed] [Google Scholar]
- 31.Bydder M, Yokoo T, Hamilton G, et al. Relaxation effects in the quantification of fat using gradient echo imaging. Magn Reson Imaging 2008;26(3):347–359. [DOI] [PMC free article] [PubMed] [Google Scholar]
- 32.Obuchowski NA, Bullen J. Quantitative imaging biomarkers: effect of sample size and bias on confidence interval coverage. Stat Methods Med Res 2018;27(10):3139–3150. [DOI] [PubMed] [Google Scholar]
- 33.Sofue K, Zhong X, Nickel MD, Dale BM, Bashir MR. Stability of liver proton density fat fraction and changes in R 2* measurements induced by administering gadoxetic acid at 3T MRI. Abdom Radiol (NY) 2016;41(8):1555–1564. [DOI] [PubMed] [Google Scholar]
- 34.Meisamy S, Hines CDG, Hamilton G, et al. Quantification of hepatic steatosis with T1-independent, T2-corrected MR imaging with spectral modeling of fat: blinded comparison with MR spectroscopy. Radiology 2011;258(3):767–775. [DOI] [PMC free article] [PubMed] [Google Scholar]
- 35.Kuroda K, Oshio K, Chung AH, Hynynen K, Jolesz FA. Temperature mapping using the water proton chemical shift: a chemical shift selective phase mapping method. Magn Reson Med 1997;38(5):845–851. [DOI] [PubMed] [Google Scholar]
- 36.Hernando D, Sharma SD, Kramer H, Reeder SB. On the confounding effect of temperature on chemical shift-encoded fat quantification. Magn Reson Med 2014;72(2):464–470. [DOI] [PMC free article] [PubMed] [Google Scholar]


