Abstract
The increasing prevalence of dementia worldwide places a high demand on healthcare providers to perform a diagnostic work-up in relatively early stages of the disease, given that the pathologic process usually begins decades before symptoms are evident. Structural imaging is recommended to rule out other disorders and can only provide diagnosis in a late stage with limited specificity. Where PET imaging previously focused on the spatial pattern of hypometabolism, the past decade has seen the development of novel tracers to demonstrate characteristic protein abnormalities. Molecular imaging using PET/SPECT is able to show amyloid and tau deposition in Alzheimer disease and dopamine depletion in parkinsonian disorders starting decades before symptom onset. Novel tracers for neuroinflammation and synaptic density are being developed to further unravel the molecular pathologic characteristics of dementia disorders. In this article, the authors review the current status of established and emerging PET tracers in a diagnostic setting and also their value as prognostic markers in research studies and outcome measures for clinical trials in Alzheimer disease.
© RSNA, 2021
Summary
Not only can molecular imaging using PET help show the pathologic hallmarks of Alzheimer disease and assess loss of dopaminergic terminals in parkinsonian disorders, but the development of novel tracers for neuroinflammation and synaptic density further allows for elucidation of the molecular pathologic characteristics of dementia disorders.
Essentials
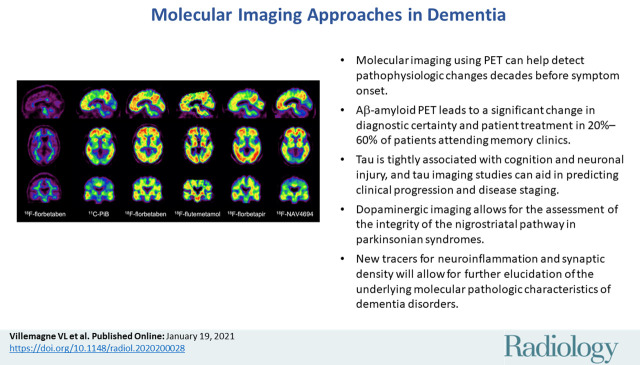
■ Molecular imaging using PET can help detect pathophysiologic changes decades before symptom onset.
■ Aβ-amyloid PET leads to a significant change in diagnostic certainty and patient treatment in 20%–60% of patients attending memory clinics.
■ Tau is tightly associated with cognition and neuronal injury, and tau imaging studies can aid in predicting clinical progression and disease staging.
■ Dopaminergic imaging allows for the assessment of the integrity of the nigrostriatal pathway in parkinsonian syndromes.
■ New tracers for neuroinflammation and synaptic density will allow for further elucidation of the underlying molecular pathologic characteristics of dementia disorders.
Introduction
The prevalence of dementia is rising worldwide, partly because of increased life expectancy (1). The increased awareness about dementia places a high demand on health-care providers to perform a diagnostic work-up in relatively early stages of the disease. In parallel, there has been an increasing recognition of atypical manifestations of Alzheimer disease (AD), the leading causes of dementia, and other disorders that may cause dementia. Posterior variants of AD may mimic dementia with Lewy bodies (DLB), whereas frontal variants of AD may resemble frontotemporal dementia. Establishing an accurate diagnosis is important for prognosis, pharmacologic management, and identification of individuals suitable for participation in therapeutic trials.
The selection of diagnostic tests is somewhat variable and depends on the availability of different techniques and clinician preferences. In most countries, once differential diagnoses, such as metabolic and psychiatric causes, have been ruled out, structural imaging is recommended to rule out a surgically treatable cause (eg, tumor or hydrocephalus). CT and especially MRI may provide important diagnostic clues in patients with vascular dementia and various primary neurodegenerative disorders. The finding of medial temporal lobe atrophy is quite sensitive for AD (2), although several other disorders can cause similar findings (eg, limbic-predominant age-related TAR DNA binding protein 43 encephalopathy) (3).
Because of the limitations of MRI to provide a specific nosologic diagnosis, there is an increasing demand to establish a more definitive molecular diagnosis. Although cerebrospinal fluid (CSF) testing can provide relevant information (eg, Aβ-amyloid and tau pathologic findings), this procedure is invasive and there have been challenges in standardizing measurements. Like the emerging serum makers, CSF analysis does not provide information about the spatial distribution of pathologic findings and is unable to provide information about dopamine transporter status that can be revealed by SPECT or PET. Aβ-PET leads to a significant change in diagnostic certainty and patient treatment even in individuals with clinically probable AD (4,5), whereas dopamine imaging can support a diagnosis of DLB or Parkinson disease (PD) dementia. Molecular imaging using PET in dementia is a rapidly developing field, including tracers for tau, neuroinflammation, and synaptic density. In this article, we review the current status of established and emerging tracers in a diagnostic setting and also their value as prognostic markers in research studies and outcome measures for clinical trials in AD.
Aβ and Tau Imaging in AD
The pathologic process in neurodegenerative conditions usually begins decades before symptoms are evident. The clinical inability to detect the pathologic process precluded potential early interventions with disease-modifying therapy during the presymptomatic period, which by arresting neuronal loss would presumably achieve the maximum benefits of such therapies (6). Therefore, a change in diagnostic paradigm was sought, where diagnosis moves away from identification of signs and symptoms of neuronal failure—indicating that central compensatory mechanisms have been exhausted and extensive synaptic and neuronal damage is already present—to the noninvasive detection of specific biomarkers for particular traits underlying the pathologic process (7,8).
The introduction of in vivo imaging of Aβ-amyloid and tau pathologic findings has transformed the assessment of AD by providing reproducible statements of regional or global Aβ-amyloid and tau burden in the brain.
Aβ-Amyloid Imaging
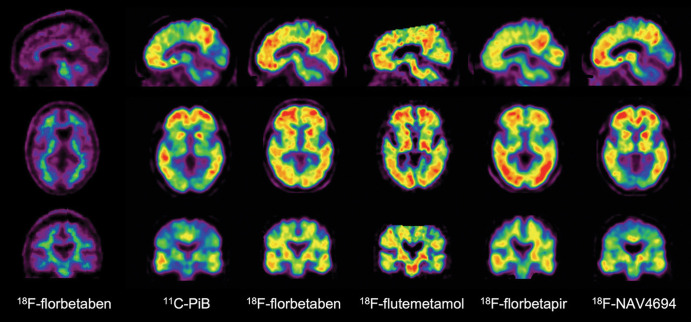
Aβ-amyloid plaques are one of the hallmark brain lesions of AD, and several Aβ-amyloid–selective radiotracers have been developed for the in vivo assessment of Aβ-amyloid pathologic findings in the brain (9) (Table 1). Initial human Aβ-amyloid imaging studies were conducted using carbon 11 (11C) Pittsburgh compound B (PiB) (10) (Fig 1). To overcome the limitations of the short decay half-life of 11C, several Aβ-amyloid tracers labeled with fluorine 18 (18F) (half-life of 110 minutes), which permits centralized production and regional distribution, were developed. The most successful ones, 18F-florbetaben (11), 18F-flutemetamol (12), and 18F-florbetapir (13) (Fig 1), have shown high correlation with Aβ-amyloid neuropathologic findings (14–16), clinical validity (17), and have already been approved for clinical use in the United States, Europe, and Japan. A third-generation tracer, 18F-NAV4694 (18) with very similar characteristics to PiB, has also been used mainly for research studies (Fig 1).
Table 1:
Currently Used Aβ-Amyloid Tracers
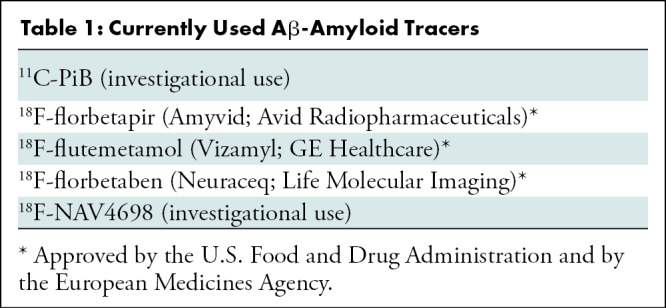
Figure 1:
Aβ imaging. Representative sagittal, transaxial, and coronal PET images in control patient without cognitive impairment (left column) and five different patients with Alzheimer disease (AD). At visual inspection, fluorine 18 (18F) florbetaben scan in control patient without cognitive impairment shows nonspecific tracer retention in white matter. All patients with AD have present high Aβ burdens, reflected in marked radiotracer retention in cortical and subcortical gray matter areas. Cortical tracer retention is higher in patients with AD compared with the control patient, leading to blurring of normally visible gray matter and white matter interface. Tracer retention in AD is particularly higher in frontal, cingulate, precuneus, striatum, parietal, and lateral temporal cortices, whereas occipital, sensorimotor, and mesial temporal lobes are much less affected. All of these tracers show a variable degree of nonspecific binding to white matter. Patients with AD were scanned with carbon 11 Pittsburgh compound B (11C-PiB), 18F-florbetaben, 18F-flutemetamol, 18F-florbetapir, and 18F-NAV-4696. 18F-flutemetamol (Vizamyl; GE Healthcare), 18F-florbetaben (Neuraceq; Life Molecular Imaging), and 18F-florbetapir (Amyvid; Avid Radiopharmaceuticals) have already been approved for clinical use by the U.S. Food and Drug Administration and European Medicines Agency. A binary visual readout approach ruling out Aβ-amyloid pathologic findings is recommended for the clinically approved tracers and is the one used for exclusion and/or inclusion in most anti-Aβ-amyloid therapeutic trials.
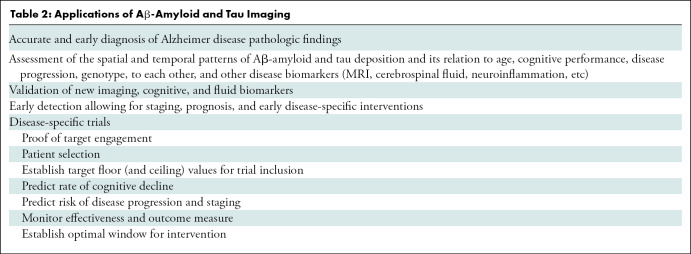
Several applications of Aβ-amyloid imaging have been implemented (Table 2). All of these tracers have shown a robust difference in tracer retention between patients with AD and age-matched control patients (Fig 1). Aβ-amyloid imaging has also facilitated differential diagnosis in patients with atypical manifestations of dementia such as language presentation in the logopenic (Alzheimer) variant of primary progressive aphasia (19). Although there is usually no cortical Aβ-amyloid tracer retention in patients with frontotemporal lobar degeneration (20) or sporadic Creutzfeldt-Jakob disease (21), other neurodegenerative conditions, such as DLB and cerebral amyloid angiopathy, may manifest with Aβ-amyloid deposition. Patients with DLB usually show a pattern similar to the one observed in patients with AD (20,22), whereas posterior cortical Aβ-amyloid deposition is observed in cerebral amyloid angiopathy (23).
Table 2:
Applications of Aβ-Amyloid and Tau Imaging
The early Aβ-amyloid accumulation is challenging in terms of clinical applicability in individuals with no symptoms because an Aβ-amyloid–positive scan may reflect clinically silent AD pathologic findings, which may precede dementia onset by 15–20 years. In a diagnostic setting, the finding of an Aβ-amyloid–negative PET scan in a patient with symptoms is therefore much more informative as it definitively rules out AD. In most studies, 20%–30% of patients with clinically diagnosed AD and approximately 30%–50% of patients with mild cognitive impairment (MCI) have been shown to have a normal Aβ-amyloid PET scan, which effectively rules out AD as the cause. Aβ-amyloid PET leads to change in diagnostic confidence and patient treatment in 20%–60% of patients attending memory clinics (4,5), the latter mostly because of a change in acetylcholine esterase inhibitor medication.
Both age and apolipoprotein ε4 carriage, the strongest risk factors in sporadic AD, have been directly associated with Aβ-amyloid burden as measured by PET (24). Apolipoprotein ε4 allele carriership, a risk factor for AD, is associated with significantly higher Aβ-amyloid deposition (24). Although the prevalence of high Aβ-amyloid was higher in ε4 carriers (25), the rates of Aβ-amyloid accumulation above the threshold of abnormality did not differ from those in non-ε4 carriers (26).
Although Aβ-amyloid burden correlates with memory impairment and a higher risk for cognitive decline in the aging population and patients with MCI (27), it does not strongly correlate with cognitive impairment, synaptic activity, and neurodegeneration in AD, likely because Aβ-amyloid accumulation has already reached a plateau (28). Taking all this into account, it is clear that Aβ-amyloid deposition in the brain is not a benign process that is part of normal aging, but an early and necessary, although not sufficient, cause for cognitive decline in AD (29). This indicates the involvement of other downstream mechanisms, likely triggered by Aβ-amyloid such as neurofibrillary tangle formation, neuroinflammation, synaptic failure, and eventually neuronal loss (30).
Aβ-amyloid imaging is widely used in patient selection and evaluation of treatment response in many multicenter therapeutic trials around the world (31). Aβ-amyloid imaging has also been used as proof of target engagement for these therapies (32). Although these studies represent today one of the principal applications of Aβ-amyloid imaging, a key challenge in the development of AD therapeutic treatment is that Aβ-amyloid reductions have not necessarily accompanied cognitive improvement. For example, several notable trials of monoclonal antibodies directed at Aβ-amyloid appeared to successfully reduce Aβ-amyloid, but similar to trials inhibiting β- and γ-secretases, they showed no significant improvement in cognition (33,34). Another concern is that some of these treatments were associated with concerning adverse effects such as edema and microhemorrhages. These setbacks have fueled controversy about treatments that target Aβ-amyloid, with advocates for Aβ-amyloid–modifying therapies arguing that treatment occurred too late in the course of the disease to reverse the pathologic cascade of Aβ amyloid–initiated events because study participants were patients without symptoms. About 25%–35% of older patients performing within normal limits on cognitive tests present with high Aβ-amyloid burden in the brain. This detection of Aβ-amyloid pathologic findings at the presymptomatic stages is of crucial importance because it is precisely the group that may benefit the most from therapies aimed at reducing or eliminating Aβ-amyloid from the brain before irreversible neuronal or synaptic loss occurs (35). Based on this premise, the A4 trial has enrolled individuals with normal cognition and abnormal Aβ-amyloid, with the goal of reducing the cognitive decline expected in this group (36). Others, however, have interpreted trial failures as evidence that Aβ-amyloid reduction will not be an effective strategy for modifying AD symptoms at any stage and that non–Aβ-amyloid targets, such as tau, immune dysfunction, gene therapy (eg, promoting expression of apolipoprotein ε2), cardiovascular risk (37), and poor lifestyle practices (38), should be pursued.
Aβ-amyloid imaging studies have shown that Aβ-amyloid accumulation is a slow and protracted process extending for more than 2 decades before the onset of the clinical phenotype. Longitudinal studies have demonstrated that significant, albeit small, increases in Aβ-amyloid deposition can be measured but also that these increases in Aβ-amyloid deposition are present in both those with high and low Aβ-amyloid burden in the brain (39) and throughout all clinical stages (26,28,40).
Selective Tau Imaging
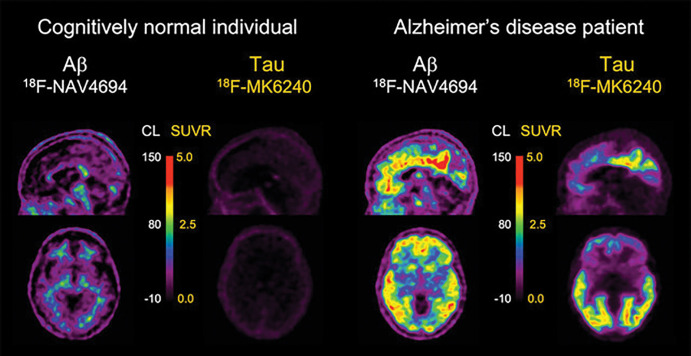
The most recent addition for the assessment of neurodegenerative proteinopathies has been tau imaging. Despite the idiosyncratic characteristics of tau physiopathologic findings (for in-depth review, see reference [41)]), great progress has been made in the past few years, with several selective tau tracers extensively used in research studies, and novel tau tracers starting to be applied (42–44) (Table 3). The most widely used early-generation selective tau tracers have been 18F-flortaucipir (also known as AV1451, T807, and recently approved for clinical use by the U.S. Food and Drug Administration under the name of Tauvid; Avid Radiopharmaceuticals) (42,45) (Fig 2). Others include the THK tracer series (18F-THK5317 and 18F-THK5351) (46,47) and carbon 11 pyridinyl-butadienyl-benzothiazole 3 (48). Most of the research and potential clinical applications of tau imaging are similar to those of Aβ-amyloid imaging (Table 2), whereas additional applications like tracking disease progression, disease staging, or as a surrogate marker of cognition are more closely related to tau. One of the issues associated with first-generation tau tracers has been “off-target” binding in the basal ganglia, choroid plexus, or substantia nigra. In the particular case of 18F-flortaucipir, it has been shown that 60% of the signal in individuals who are Aβ-amyloid–negative and have normal cognition is nonspecific (49). Newer-generation tracers, such as 18F-RO948 or 18F-GTP1, have shown less noticeable off-target binding (50), whereas others, such as 18F-MK6240 (Fig 3) or 18F-PI2620, show different off-target patterns (43,44). Low MK6240 or PI2620 retention in control patients who are Aβ-amyloid negative yields high effect sizes when compared with patients with AD, suggesting that these tracers might be suitable to detect early and subtle increases in tau levels in the brain. Additionally, PI2620 has been shown to bind to 4R tau deposits, which may assist in the early and differential diagnosis of 4R tauopathies such as progressive supranuclear palsy (PSP) (51) and corticobasal degeneration.
Table 3:
Currently Used Tau Tracers
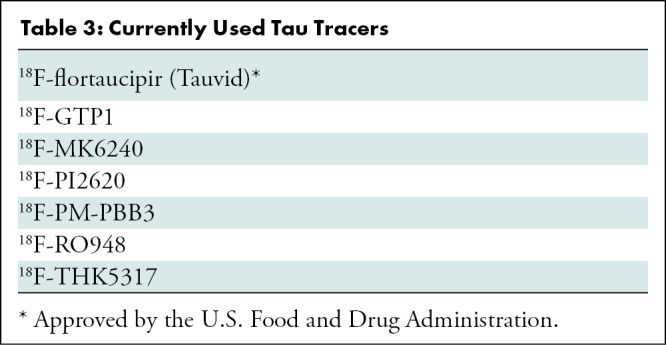
Figure 2:
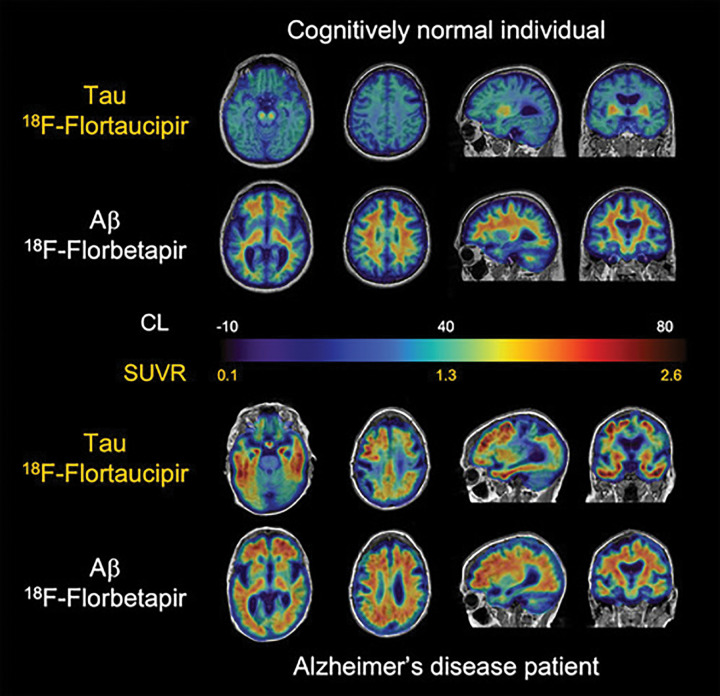
Aβ and tau imaging. Representative transaxial, sagittal, and coronal Aβ-amyloid fluorine 18 (18F) florbetapir and tau (18F-flortaucipir) PET images overlayed on MRI scans in individual with normal cognition (top two rows) and patient with Alzheimer disease (AD) (bottom two rows). Individual with normal cognition has typical pattern of flortaucipir off-target binding in basal ganglia and choroid plexus but minimal on-target binding related to tau accumulation in medial temporal lobe or throughout cortex. Florbetapir PET images are representative of typical “negative” Aβ-amyloid scan, showing typical widespread nonspecific retention throughout white matter, but this retention does not extend to cortex. Although patient with AD has similar flortaucipir off-target binding, there is extensive and marked on-target tracer retention in medial and lateral temporal lobes, extending to frontal and parietal lobes, despite considerable atrophy that is apparent from structural MRI. Florbetapir PET scans show Aβ-amyloid accumulation distributed relatively uniformly throughout neocortex. CL = Centiloids, SUVR = standardized uptake value ratio.
Figure 3:
Aβ and tau imaging. Representative transaxial and sagittal Aβ-amyloid and tau PET images in older control patient with normal cognition (left) and in patient with Alzheimer disease (AD) (right) obtained with fluorine 18 (18F) NAV4694 for Aβ and 18F-MK6240 for tau, respectively. 18F-NAV4694 images show typical nonspecific tracer retention in white matter in control patient with normal cognition, whereas typical pattern of tracer retention in frontal, temporal, and posterior cingulate cortices is observed in patient with AD. 18F-MK6240 images show low tracer brain retention in control patient with normal cognition, whereas in patient with AD, a typical widespread pattern of high-contrast tracer retention, involving mesial temporal lobes and temporoparietal and posterior cingulate areas, and to a lesser extent in prefrontal cortex, is observed. Faint off-target retention in meninges is clearly observed in control patient with normal cognition. CL = Centiloids, SUVR = standardized uptake value ratio.
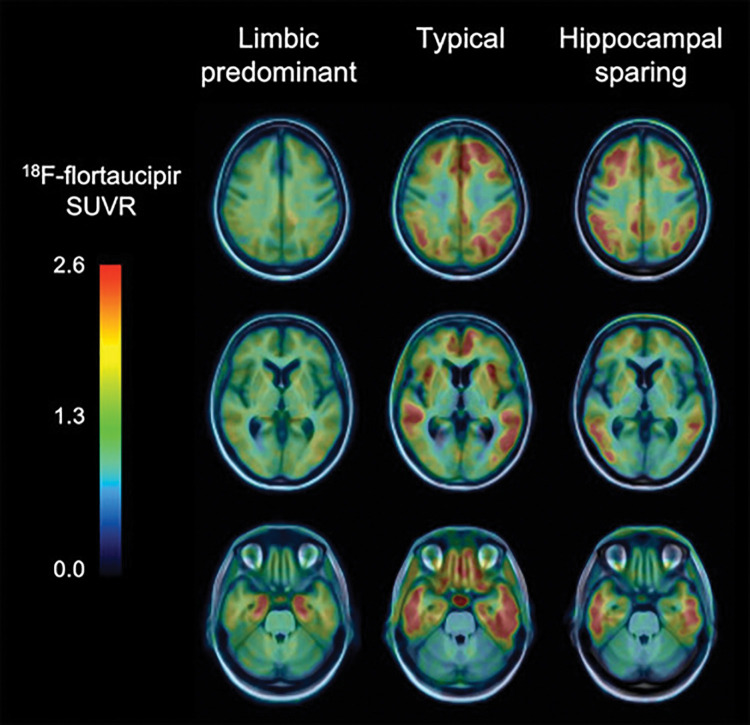
Aβ-amyloid imaging studies have demonstrated that the global amount of Aβ-amyloid in the brain is more relevant than the regional Aβ-amyloid distribution as an early driver of cognitive decline. Conversely, postmortem and initial tau imaging studies indicate that the topographical distribution of tau deposits in the brain might be more relevant and more closely associated with neurodegeneration and cognitive decline (52). Tau imaging has been widely used for evaluation of AD (45,53). Tau imaging studies, in stark contrast to CSF and/or plasma assessments, allow for the examination of the stereotypical spatial distribution of tau deposits in the brain (54,55). Typically, in patients with AD, PET shows high tracer retention in the mesial temporal lobe (MTL), inferior and middle temporal lobes, angular and supramarginal gyri, and the temporooccipital, inferior parietal, posterior cingulate, with varying degrees of involvement of the frontal lobe, mainly the dorsolateral prefrontal region (Figs 2, 3). Although high tracer retention can be observed in MTL in presymptomatic patients, patients with symptoms of MCI and/or AD show involvement of neocortical areas. Also, tau imaging can differentiate the different pathologic subtypes of AD: limbic predominant, typical, and hippocampal sparing (56,57) (Fig 4).
Figure 4:
Tau imaging helps identify pathologic subtypes in Alzheimer disease (AD). Fluorine 18 (18F) flortaucipir PET images in three patients with AD show three different pathologic subtypes of AD: limbic predominant (left column) with tracer retention mostly restricted to mesial temporal lobes, typical presentation (center column) with widespread retention in both mesial temporal lobes and neocortical areas, and hippocampal sparing subtype (right column) where tracer retention is predominantly in neocortex. SUVR = standardized uptake value ratio.
Tau has a close relationship with markers of neuronal injury such as 18F fluorodeoxyglucose (FDG) or cortical gray matter atrophy (58,59) and is able to predict clinical progression and neurodegeneration (60). Tau imaging is shedding light into the relationship between tau deposits and cognition, where increasing cortical tau in individuals who are Aβ-amyloid positive was associated with increasing impairment in several cognitive domains (53,61). Several studies have shown a robust difference in tau tracer retention between older control patients with normal cognition and patients with AD (45,53), as well as in atypical AD presentations where 18F-flortaucipir regional retention—not Aβ-amyloid as assessed by PiB—matched the clinical phenotype (62). Although the vast majority of patients with AD present with both high Aβ-amyloid and high tau (45,53), and tau PET has high specificity to distinguish AD from other neurodegenerative conditions, between 15% and 25% of patients with elevated Aβ-amyloid who are clinically diagnosed as having probable AD have subthreshold levels of cortical tau tracer retention (63,64). Interestingly, symptomatic mutation carriers have much higher tau levels in the brain than patients with sporadic AD with the same degree of cognitive impairment (65). Similarly, patients with early-onset AD have higher tau levels than patients with late-onset AD (66). Former football players with chronic exposure to trauma show an anterior pattern of 18F-flortaucipir retention in prefrontal regions and the MTL, quite distinct from the posterior pattern usually observed in AD (67).
Biomarker Classification of Disease
Recently, a multimodality approach combining biochemical and neuroimaging biomarkers was implemented, establishing a biologic definition of the disease and leading to new research criteria for the diagnosis of AD according to three types of markers as follows: those specific for Aβ-amyloid (Aβ-amyloid imaging, CSF Aβ1–42), those specific for tau (tau imaging, CSF p-tau), and nonspecific biomarkers reflecting neuronal injury (elevated neurofilament light in CSF and/or plasma, AD-like glucose hypometabolism as assessed by FDG PET and/or brain atrophy as measured with structural MRI) and grouped under “neurodegeneration” (68). The use of biomarkers, implemented in the new Amyloid, Tau, and (Neurodegeneration) biomarker framework, is also guiding the approach to disease-specific therapeutic trials, either as proof of target engagement, patient selection, or outcome measure, eventually allowing for shorter trials with a smaller sample size. Recent studies have validated the AT(N) framework in population-based cohort studies (69), memory clinic populations (70,71), and in individuals with normal cognition (72), which also provides preliminary evidence on the longitudinal cognitive outcomes (69,70,72). The observation that the pathologic sequence of events throughout presymptomatic and symptomatic phases of AD spans decades has motivated several large studies tracking biomarker and neuropsychologic trajectories in individuals at various stages of disease. Several multisite longitudinal prospective studies have enabled the characterization of cognitive and biomarker trajectories in cohorts made up of thousands of participants. The Alzheimer’s Disease Neuroimaging Initiative (North America), the Australian Imaging, Biomarker, and Lifestyle Flagship Study of Aging (Australia), and Amyloid Imaging to Prevent Alzheimer’s Disease (Europe) are multisite longitudinal studies designed to track the natural history of AD, evaluate the role of fluid and imaging biomarkers in AD diagnosis, and identify clinical trial-ready populations (73–75). A key feature of these studies is the enrolment of patients with normal cognition who are not on the AD pathway and/or who are early in the course of disease and can be followed longitudinally to detect the earliest abnormal changes. The Dominantly Inherited Alzheimer Network and its clinical trial component have goals similar to the Alzheimer’s Disease Neuroimaging Initiative and focus on rarer, early-onset, autosomal dominant forms of AD (76). Biomarker data from these studies have been further merged to examine the prevalence of Aβ-amyloid and tau in exceptionally large cohorts (63).
The use of a variety of Aβ-amyloid measurement strategies in clinical trials has brought forward several methodologic issues such as the validity of using semiquantitative methods to evaluate changes in Aβ burden. In addition, different Aβ-amyloid tracers present with differing pharmacologic and pharmacokinetic properties such that multicenter studies using different Aβ-amyloid tracers, such as the Imaging Dementia—Evidence for Amyloid Scanning Study (4) or Amyloid Imaging to Prevent Alzheimer’s Disease (74), would not be able to compare results. For that purpose, a method has recently been developed to produce a single common quantitative output value, called the Centiloid, for Aβ-amyloid imaging across tracers and imaging analysis approaches to improve clinical and research use of these Aβ-amyloid tracers (77). Since then, all 18F-labeled radiotracers and Aβ-amyloid tracers currently in use have been cross-calibrated against PiB (78–81) to enable translation into Centiloids.
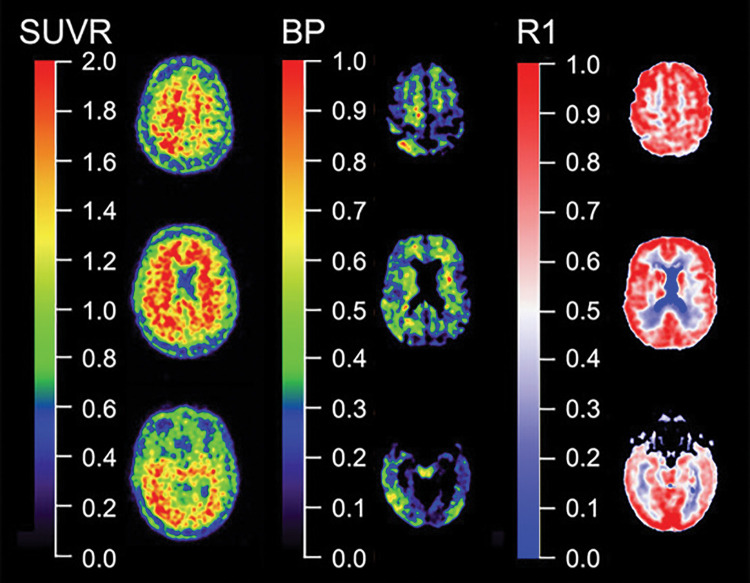
The vast majority of Aβ-amyloid and tau PET studies have used short (20–30 minutes) static scans to measure tracer binding. The popularity of static scans is understandable because they are relatively easy to acquire, patient friendly, and less sensitive to patient movement, all with a limited use of expensive and scarce scanner time. The outcome measure resulting from static scans in brain PET studies is usually the standardized uptake value ratio (SUVR) (Fig 5), which is the cortical uptake normalized to uptake in a reference region, a region supposedly devoid of specific binding. The downside of SUVR, and by extension Centiloids, is that they are a semiquantitative measure, sensitive to differences in especially the influx and outflux of the tracer between patients (82,83). This makes SUVR sensitive to changes in cerebral blood flow, which are known to differ daily (84) but also occur with disease progression in AD (85). This implies that acquisition outside the predefined time window (which happens frequently in clinical practice) may render different results.
Figure 5:
Quantitative versus semiquantitative imaging. Representative standard uptake value ratio (SUVR) (left column), binding potential (BP) (center column), and relative perfusion measure (R1) (right column) carbon 11 Pittsburgh compound B images. In contrast with semiquantitative SUVR from a 20–30–minute static acquisition, quantitative parametric BP images derived from dynamic acquisition not only yield much higher contrast images than SUVR, facilitating visual inspection by eliminating nonspecific binding, but dynamic acquisition also allows for quantification of regional relative perfusion measures that add valuable information for assessment of a patient or therapeutic trial participant.
More quantitative approaches, which account for the majority of these factors, require dynamic imaging. The most frequently used quantitative models, such as the simplified reference tissue model (86), reference parametric mapping (87), or Logan graphical analysis (88), yield nondisplaceable binding potential (Fig 5) or distribution volume ratio, respectively. Interestingly, in a direct comparison using PiB (82), it was found that SUVR overestimated nondisplaceable binding potential values by 10%–13% (89). Although the inherent bias of SUVR is also dependent on the amount of specific binding, test-retest reproducibility studies with PiB (90), florbetapir (91), and flortaucipir (92) comparing SUVR with nondisplaceable binding potential show a good correlation between the two measures, indicating that SUVR gives a reasonable estimate of specific binding. As such, SUVR can be used for assessment of Aβ-amyloid and tau status (eg, high or low Aβ-amyloid and/or tau) or in cross-sectional studies when accurate quantification of specific binding is not required (92). However, this is not transferable to longitudinal studies, especially in patients with AD, as atrophy and cerebral blood flow differences over time occur because of the natural time course of the disease (93). Many efforts have been taken to increase the reliability of SUVR, for instance, with different reference regions such as subcortical white matter. However, influx and efflux differences of the tracer between patients and between different regions also affect the reference regions and do not solve the inherent bias associated with SUVR. As such, for accurate longitudinal assessment of Aβ-amyloid and tau load, quantitative models are preferred (82). The bias associated with SUVR is likely to be even more marked when used in clinical trials with disease-modifying agents with PET ligands as surrogate markers (32,34). Indeed, these studies are designed to reduce Aβ-amyloid load in the brain, and invariably report a decrease in SUVR, which is interpreted as a desired decrease in Aβ-amyloid pathologic findings, but the decrease could have been attributed to decreased cerebral blood flow because of disease progression (32,82). In addition, the active drug itself may affect both local and global perfusion, and its effects most likely will be different for target and reference tissues (82,94), influencing SUVR measures substantially, even in a dose-dependent way, but also tracer metabolism, tracer binding in peripheral tissues, blood-brain barrier permeability or even competing with the tracer for the same binding site. These phenomena are unpredictable and make SUVR too unreliable to assess treatment effects. To date, little evidence shows that the doses used in these experiments really lowered the Aβ-amyloid burden in the brain, and we cannot exclude the possibility that the failure of these drugs was in part due to underdosing of the patients. Quantitative PET with dynamic imaging is the only way to circumvent the vast majority of these problems. The long acquisition time of dynamic scanning can be circumvented using a steady-state approach with a bolus-with-continuous-infusion protocol, which can be performed outside the PET camera (95). Another way to circumvent long acquisition procedures is to use a dual time window protocol in which a dynamic scan is acquired in two parts with a break in between when the patient can leave the camera. These dual time window protocols have been validated for several tracers (96) and are ready to be implemented in clinical trials.
Dopaminergic Imaging
Neurodegenerative conditions associated with dementia might also affect the dopaminergic system. This occurs typically in Lewy body disorders such as PD, PD with dementia and DLB, and in other parkinsonian syndromes possibly associated with dementia, such as corticobasal degeneration, PSP, and multiple-system atrophy (MSA).
The integrity of the nigrostriatal dopaminergic system can be best evaluated with molecular imaging techniques. Many SPECT (Fig 6) and PET (Fig 7) tracers specific to different targets in the dopaminergic synapse exist, with dopamine transporters (DATs) and dihydroxyphenylalanine (DOPA) activity in the presynaptic terminal the targets most commonly investigated clinically (97).
Figure 6:
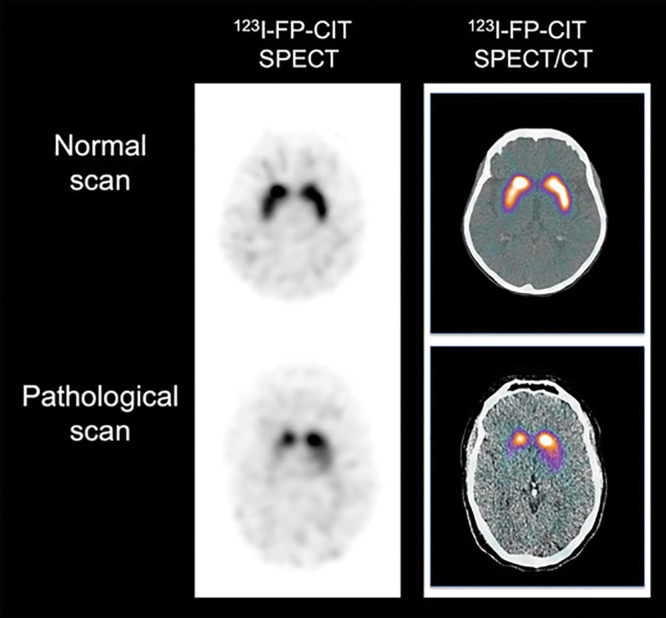
Dopaminergic imaging with SPECT. Representative transaxial iodine 123–2β-carbomethoxy-3β-(4-iodophenyl)-N-(3-fluoropropyl)-nortropane (123I-FP-CIT) SPECT (left column) and 123I-FP-CIT SPECT/CT (right column) images show normal binding of tracer (top row) in healthy control patient with symmetrical and homogeneous tracer retention in striatum. Bottom row shows pathologic 123I-FP-CIT binding, with marked and asymmetric decrease of tracer binding in striatum. Images reflect typical progression of decreased 123I-FP-CIT binding reflecting asymmetric loss of nigrostriatal terminals in striatum, usually starting in tail of putamen progressing rostrally through anterior putamen and into head of caudate nucleus.
Figure 7:
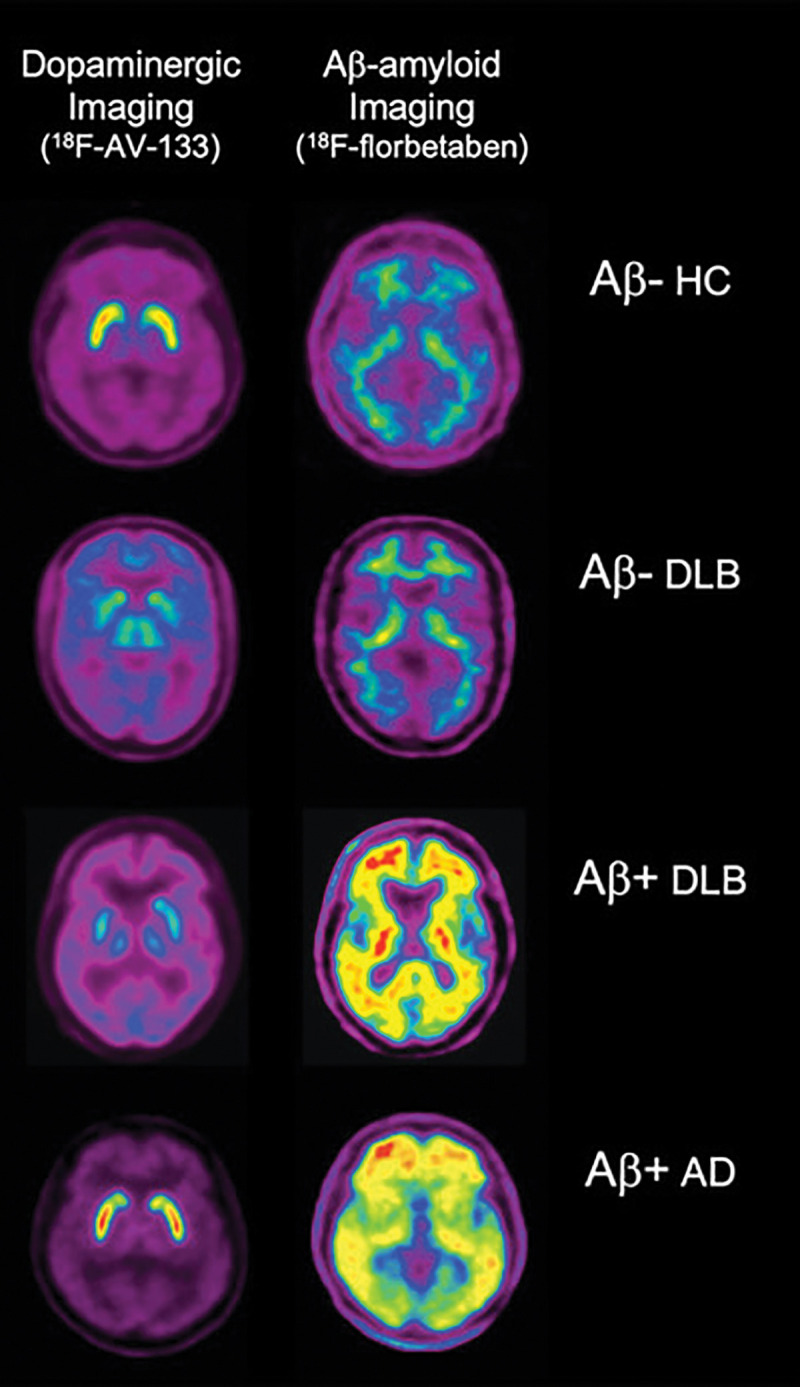
Comparison of vesicular monoamine transporter type 2 (VMAT2) imaging with fluorine 18 (18F) AV-133 and Aβ imaging with 18F florbetaben. Representative coregistered transaxial 18F AV-133 and florbetaben PET images in an older healthy control (HC) patient show low Aβ burden and normal striatal VMAT2 densities. PET images in patient with Alzheimer disease (AD) show high Aβ burden and normal striatal VMAT2 densities. For the two patients with dementia with Lewy bodies (DLB), images in patient with DLB with low Aβ burden are indistinguishable from those in the HC patient, and images in patient with DLB with high Aβ burden are indistinguishable from those in the patient with AD. In contrast to Aβ burden images, both patients show markedly reduced VMAT2 densities in striatum, clearly differentiating them from the healthy control patient and the patient with AD. Moreover, PET images provide higher resolution and sensitivity, making separation between caudate and putaminal binding by internal capsule better visible.
DAT Imaging
Among the tracers targeting DATs, 123I-FP-CIT is approved by both the U.S. Food and Drug Administration and the European Medicines Agency for testing dopaminergic neuronal integrity in Lewy body disorders and parkinsonian syndromes. The reduction of tracer binding is associated with the integrity of the nigrostriatal pathway, namely dopaminergic neuronal density and axonal dysfunction (98), rather than levels of alpha-synuclein, tau, or Aβ-amyloid pathologic findings (99) (Fig 7).
In PD, DAT imaging typically shows an asymmetric reduction, predominantly in the striatum contralateral to the clinically most affected side and has excellent diagnostic accuracy to distinguish degenerative parkinsonism from essential tremor (100). Dopaminergic imaging is not required for diagnosis in patients in whom there is no diagnostic doubt, but when performed, in doubtful cases, the presence of normal results is an absolute exclusion criterion in the current diagnostic criteria (101). A few studies suggest an impact of DAT imaging on management in patients with suspected parkinsonism, among which a prospective study showing a significant difference in diagnostic confidence in the group undergoing imaging, without impact on quality of life or health resource use at 1-year follow-up (102).
PD with dementia is defined as the onset of cognitive impairment in the setting of an established PD condition (103). Although PD with dementia is characterized by a higher amount of structural and functional neurodegeneration compared with PD, as evaluated by MRI and FDG PET studies, the presence of significant differences in DAT density is still under discussion. PD with dementia has a different pattern of onset clinically but otherwise largely overlaps with DLB (104). In DLB, the diagnostic accuracy of dopaminergic imaging reported across studies, although variable, is higher than clinical diagnosis (105). This is also confirmed by more recent studies using neuropathologic findings as the standard (106).
For these reasons, DAT imaging is included in the current diagnostic criteria for DLB as an indicative biomarker (107). Importantly, however, it has been reported that up to 10% of patients with pathologically proven DLB can show normal DAT imaging results at diagnosis, possibly explained by predominant limbic and neocortical cortical α-synuclein deposition (108). Notably, as in PD, decreased striatal DAT levels have been found to be associated with neuropsychiatric symptoms in DLB (109). Although the clinical validity of the test in patients with DLB has been consistently shown, only preliminary investigations address the impact on patient treatment (102).
The diagnosis of corticobasal degeneration is clinically based (110). Patients presenting with a corticobasal syndrome might have different underlying causes, most commonly corticobasal degeneration, but also AD or DLB, and the ability of dopaminergic imaging biomarkers to identify the different subtypes has not been sufficiently investigated yet (110), although 18F-FDG may be used for this purpose. The involvement of the nigrostriatal pathway is influenced by the underlying pathologic characteristics and forms with prevalent cortical involvement might have normal imaging, namely in the earliest disease phases (111). DAT imaging is typically severely abnormal in PSP, particularly in the clinical manifestation of Richardson syndrome (112). However, given the lack of specificity of DAT imaging to differentiate PSP from other parkinsonian syndromes, dopaminergic imaging was not included in the current diagnostic criteria for PSP (113).
Diagnostic criteria for MSA identify two main clinical subtypes, with predominant parkinsonism, or MSA-P, and predominant cerebellar ataxia, or MSA-C (114). Nigrostriatal degeneration is more severe in the P form, but a DAT reduction can also be observed in a majority of probable and possible individuals with MSA-C, for whom it has a recognized diagnostic value as an additional feature (98).
Overall, these studies provided evidence of a good diagnostic accuracy of DAT imaging in detecting neurodegenerative conditions characterized by a loss of integrity of the nigrostriatal dopaminergic system. Notably, recent evidence also suggests possible clinical use in the initial manifestation of the disease, as, for example, in patients with idiopathic rapid eye movement behavioral disorders, but further investigation is needed (115).
DOPA-Decarboxylase Activity in the Dopaminergic Nerve Terminal
18F-FDG DOPA PET allows for the measurement of DOPA-decarboxylase activity in the nerve terminal, which is reduced in parallel with the degeneration of the nigrostriatal pathway and with DAT reduction. It should be noted, however, that the effect sizes tend to be smaller than with DAT SPECT, possibly because of a compensatory upregulation of DOPA conversion to dopamine in the early disease stages (97). The abnormal patterns observed in the different conditions are overall comparable to the changes observed in DAT imaging (98).
Imaging Neuroinflammation and Synaptic Density
Neuroinflammation has an active role in the pathogenesis of different proteinopathies, which strongly motivate a deeper understanding of the involvement of early inflammatory processes and their possible causal role in disease progression. In postmortem AD brain tissue, astrocytes and microglia are present in the proximity of Aβ-amyloid plaques, suggesting a role in the inflammatory processes of AD (116,117). It has been suggested that neuroinflammation can occur before significant Aβ-amyloid deposition in the brain and may have a neuroprotective effect in clearing Aβ-amyloid but may also contribute to neuronal toxicity.
Most studies regarding PET imaging of neuroinflammation have aimed to visualize microglia activation, as measured by elevated expression of translocator protein 18 kDa (TPSO), which is also elevated in activated astrocytes (118). 11C-PK1195 is the most widely used TPSO PET tracer, although low brain penetration and high nonspecific binding (119) led to the development of second-generation TPSO tracers, including 11C-PBR28, 18F-DPA-714, 18F-FEPPA, 11C-DAA1106, and 18F-GE180 (119,120). Several studies with 11C-PK11195 have shown increased cortical microglia activation in patients with AD (121,122), whereas some studies reported no increase in 11C-PK11195 binding in comparison to control patients (123,124). Higher binding of 11C-PBR28 was reported in patients with early-onset AD (age <65 years) compared with late-onset AD (125). Increased binding of 18F-DPA-714 has been reported in patients with prodromal AD, especially in patients with slow cognitive decline compared with patients with fast cognitive decline. A positive correlation between cortical 11C-PK11195 binding and tau and Aβ-amyloid deposition in the brain has been observed in individuals with MCI and AD (126). A complicating factor for second-generation TPSO tracers is the existence of TPSO polymorphism leading to high and low binders in the study populations. Some non-TPSO neuroinflammatory PET tracers, including 11C-NE40 targeting the cannabinoid type 2 receptor and 11C-JNJ717 and 11C-SMW130 targeting the P2 × 7 receptor, are presently under exploration (120,127).
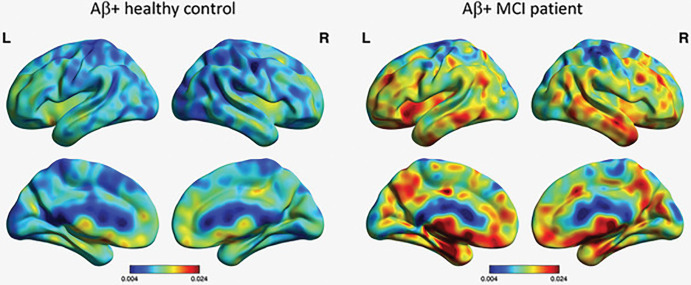
11C-deuterium-l-deprenyl (11C-DED) binds to monoamine oxidase B, which is overexpressed in activated astrocytes. 11C-DED was initially used as a PET tracer to visualize astrocytosis in several central nervous system disorders, including epilepsy (128), Creutzfeldt-Jakob disease (129), and amyotrophic lateral sclerosis (130). A significant higher 11C-DED binding has been demonstrated in prodromal AD (Fig 8) in comparison with patients with AD dementia (131). 11C-DED was measurable in a presymptomatic carrier of autosomal dominant AD 17 years before the expected onset of clinical AD (132). Longitudinal studies showed increased Aβ-amyloid deposition measured by 11C-PiB, whereas astrocytosis measured by 11C-DED declined (132). The longitudinal decline in astrocytosis in autosomal dominant AD carriers was significantly associated with progressive hypometabolism measured with FDG (133), which suggests that astrocytes may partly reflect metabolic activity in patients with AD (134).
Figure 8:
Imaging of astrocytosis. Carbon 11-deuterium-l-deprenyl PET surface projection images of astrocyte activation in healthy control patient and patient with mild cognitive impairment (MCI). Both patients are Aβ-amyloid positive. Color scale indicates modified reference (cerebellar gray matter) Paltak slope values (Nordberg Translational Molecular Imaging Laboratory, Karolinska Institutet, Sweden).
The synaptic glycoprotein 2 is a protein expressed in synaptic vesicles. Initial studies with the synaptic glycoprotein 2 tracer 11C-UCB-J, have shown reduced binding in the temporal lobe of patients with epilepsy (135) and in the hippocampus of patients with MCI and/or AD compared with control patients (136). A recent study by Bastin and colleagues (137) in 25 patients who were Aβ-amyloid positive demonstrated a significant reduced uptake of 18F-UCB-H in the hippocampus, which correlated to impaired cognitive performance. Further studies are needed to explore the lack of reduction of ligand binding in other cortical brain regions and discrepancies with a regional hypometabolism pattern.
Outstanding Issues
PET imaging in dementia has undergone major developments in the past decade and has moved well beyond the use of nonspecific metabolic tracers (eg, FDG) to provide molecular information, thus allowing greater pathologic specificity in the work-up of patients with suspected neurodegenerative diseases. Despite several new molecular tracers becoming available for the study of patients with dementia, there are still no imaging tracers for several important targets, such as α-synuclein crucial for the study of diseases associated with α-synuclein aggregation in PD and DLB (138) or TAR DNA binding protein 43 associated with the semantic and behavioral variants of frontotemporal lobar degeneration and motor neuron disease (139).
For clinical applications, an important consideration is the cost of imaging studies in comparison to those assessing biomarkers in biologic fluids such as cerebrospinal fluid (CSF) or plasma (140,141). Although CSF is less expensive and provides markers not only of abnormal proteins, but also of a whole spectrum of analytes (glucose, albumin, pH, etc) and other specific markers of neuroinflammation and neuronal and/or synaptic integrity, it requires lumbar puncture and is considered invasive by many. Newly developed plasma biomarkers for Aβ (142,143), p-tau (144), and neurofilament light (145) are undergoing validation. With blood being an easily accessible tissue, these tests might prove essential for the widespread screening of the population, thus significantly lowering trial costs by identifying people at risk for having high Aβ, tau, or neurodegeneration in the brain. PET imaging helps provide more definite evidence of global and regional molecular pathologic findings within the brain but has the disadvantage of measuring only one target at a time and is much more expensive, typically precluding reimbursement. Real-world studies examining the impact of molecular PET therefore are urgently needed (4,5).
F.B. supported by the National Institute for Health Research Biomedical Research Center at University College of London Hospital and the coordinator of Amyloid Imaging to Prevent Alzheimer’s Disease, a European Union and Federation of Pharmaceutical Industries and Associations Innovative Medicines Initiatives 2 Joint Undertaking project (grant no. 115952). V.G. supported by the Swiss National Science Foundation (grant nos. 320030_169876, IZSEZ0_188355, and 320030_185028) and Velux Foundation (project no. 1123). A.N. supported by the Swedish Foundation for Strategic Research, Swedish Research Council (project nos. 05817, 2017-02965, and 2017-06086). B.N.M.v.B. supported by the Netherlands Organization for Health Research and Development (ZonMW, project nos. 70-73305-98-211, 70-73305-98-1119, and 70-73305-0819).
Disclosures of Conflicts of Interest: V.L.V. Activities related to present article: disclosed no relevant relationships. Activities not related to the present article: is a consultant for Ixico. Other relationships: disclosed no relevant relationships. F.B. Activities related to the present article: disclosed no relevant relationships. Activities not related to the present article: receives payment for board membership from Biogen, Roche, and Merck; is a consultant for Lundbeck, Ixico, and Roche; has grants/grants pending with Innovative Medicines Initiative, Horizon 2020, Teva, and Novartis. Other relationships: disclosed no relevant relationships. V.G. Activities related to present article: disclosed no relevant relationships. Activities not related to the present article: has grants/grants pending with Roche, Merck, GE Healthcare, Siemens, and Cerveau. Other relationships: disclosed no relevant relationships. S.M.L. Activities related to the present article: disclosed no relevant relationships. Activities not related to the present article: is a consultant for Cortexzyme and NeuroVision; has grants/grants pending with National Institutes of Health; received reimbursement for travel, accommodations, and meeting expenses from Alzheimer’s Association. Other relationships: disclosed no relevant relationships. A.N. Activities related to the present article: institution received grant from Swedish Research Council, Swedish Foundation for Strategic Research, Innovative Medicines Initiative, and Amyloid Imaging to Prevent Alzheimer’s Disease. Activities not related to the present article: disclosed no relevant relationships. Other relationships: disclosed no relevant relationships. B.N.M.v.B. disclosed no relevant relationships.
Abbreviations:
- AD
- Alzheimer disease
- CSF
- cerebrospinal fluid
- DAT
- dopamine transporter
- DLB
- dementia with Lewy bodies
- DOPA
- dihydroxyphenylalanine
- FDG
- fluorine 18 fluorodeoxyglucose
- MCI
- mild cognitive impairment
- MSA
- multiple-system atrophy
- MTL
- mesial temporal lobe
- PD
- Parkinson disease
- PiB
- Pittsburgh compound B
- PSP
- progressive supranuclear palsy
- SUVR
- standardized uptake value ratio
- TPSO
- translocator protein 18 kDa
References
- 1.Winblad B, Amouyel P, Andrieu S, et al. Defeating Alzheimer’s disease and other dementias: a priority for European science and society. Lancet Neurol 2016;15(5):455–532. [DOI] [PubMed] [Google Scholar]
- 2.Ten Kate M, Barkhof F, Boccardi M, et al. Clinical validity of medial temporal atrophy as a biomarker for Alzheimer’s disease in the context of a structured 5-phase development framework. Neurobiol Aging 2017;52:167–182.e1. [DOI] [PubMed] [Google Scholar]
- 3.Nelson PT, Dickson DW, Trojanowski JQ, et al. Limbic-predominant age-related TDP-43 encephalopathy (LATE): consensus working group report. Brain 2019;142(6):1503–1527. [DOI] [PMC free article] [PubMed] [Google Scholar]
- 4.Rabinovici GD, Gatsonis C, Apgar C, et al. Association of Amyloid Positron Emission Tomography With Subsequent Change in Clinical Management Among Medicare Beneficiaries With Mild Cognitive Impairment or Dementia. JAMA 2019;321(13):1286–1294. [DOI] [PMC free article] [PubMed] [Google Scholar]
- 5.de Wilde A, van der Flier WM, Pelkmans W, et al. Association of Amyloid Positron Emission Tomography With Changes in Diagnosis and Patient Treatment in an Unselected Memory Clinic Cohort: The ABIDE Project. JAMA Neurol 2018;75(9):1062–1070. [DOI] [PMC free article] [PubMed] [Google Scholar]
- 6.Villemagne VL, Fodero-Tavoletti MT, Pike KE, Cappai R, Masters CL, Rowe CC. The ART of loss: Abeta imaging in the evaluation of Alzheimer’s disease and other dementias. Mol Neurobiol 2008;38(1):1–15. [DOI] [PubMed] [Google Scholar]
- 7.Clark CM, Davatzikos C, Borthakur A, et al. Biomarkers for early detection of Alzheimer pathology. Neurosignals 2008;16(1):11–18. [DOI] [PMC free article] [PubMed] [Google Scholar]
- 8.Jack CR Jr, Bennett DA, Blennow K, et al. A/T/N: An unbiased descriptive classification scheme for Alzheimer disease biomarkers. Neurology 2016;87(5):539–547. [DOI] [PMC free article] [PubMed] [Google Scholar]
- 9.Villemagne VL, Rowe CC. Amyloid PET Ligands for Dementia. PET Clin 2010;5(1):33–53. [DOI] [PubMed] [Google Scholar]
- 10.Klunk WE, Engler H, Nordberg A, et al. Imaging brain amyloid in Alzheimer’s disease with Pittsburgh Compound-B. Ann Neurol 2004;55(3):306–319. [DOI] [PubMed] [Google Scholar]
- 11.Rowe CC, Ackerman U, Browne W, et al. Imaging of amyloid beta in Alzheimer’s disease with 18F-BAY94-9172, a novel PET tracer: proof of mechanism. Lancet Neurol 2008;7(2):129–135. [DOI] [PubMed] [Google Scholar]
- 12.Serdons K, Terwinghe C, Vermaelen P, et al. Synthesis and evaluation of 18F-labeled 2-phenylbenzothiazoles as positron emission tomography imaging agents for amyloid plaques in Alzheimer’s disease. J Med Chem 2009;52(5):1428–1437. [DOI] [PubMed] [Google Scholar]
- 13.Wong DF, Rosenberg PB, Zhou Y, et al. In vivo imaging of amyloid deposition in Alzheimer disease using the radioligand 18F-AV-45 (florbetapir [corrected] F 18). J Nucl Med 2010;51(6):913–920. [DOI] [PMC free article] [PubMed] [Google Scholar]
- 14.Clark CM, Pontecorvo MJ, Beach TG, et al. Cerebral PET with florbetapir compared with neuropathology at autopsy for detection of neuritic amyloid-β plaques: a prospective cohort study. Lancet Neurol 2012;11(8):669–678. [DOI] [PubMed] [Google Scholar]
- 15.Curtis C, Gamez JE, Singh U, et al. Phase 3 trial of flutemetamol labeled with radioactive fluorine 18 imaging and neuritic plaque density. JAMA Neurol 2015;72(3):287–294. [DOI] [PubMed] [Google Scholar]
- 16.Sabri O, Sabbagh MN, Seibyl J, et al. Florbetaben PET imaging to detect amyloid beta plaques in Alzheimer’s disease: phase 3 study. Alzheimers Dement 2015;11(8):964–974. [DOI] [PubMed] [Google Scholar]
- 17.Chiotis K, Saint-Aubert L, Boccardi M, et al. Clinical validity of increased cortical uptake of amyloid ligands on PET as a biomarker for Alzheimer’s disease in the context of a structured 5-phase development framework. Neurobiol Aging 2017;52:214–227. [DOI] [PubMed] [Google Scholar]
- 18.Rowe CC, Pejoska S, Mulligan RS, et al. Head-to-head comparison of 11C-PiB and 18F-AZD4694 (NAV4694) for β-amyloid imaging in aging and dementia. J Nucl Med 2013;54(6):880–886. [DOI] [PubMed] [Google Scholar]
- 19.Rabinovici GD, Jagust WJ, Furst AJ, et al. Abeta amyloid and glucose metabolism in three variants of primary progressive aphasia. Ann Neurol 2008;64(4):388–401. [DOI] [PMC free article] [PubMed] [Google Scholar]
- 20.Rowe CC, Ng S, Ackermann U, et al. Imaging beta-amyloid burden in aging and dementia. Neurology 2007;68(20):1718–1725. [DOI] [PubMed] [Google Scholar]
- 21.Villemagne VL, McLean CA, Reardon K, et al. 11C-PiB PET studies in typical sporadic Creutzfeldt-Jakob disease. J Neurol Neurosurg Psychiatry 2009;80(9):998–1001. [DOI] [PubMed] [Google Scholar]
- 22.Gomperts SN, Rentz DM, Moran E, et al. Imaging amyloid deposition in Lewy body diseases. Neurology 2008;71(12):903–910. [DOI] [PMC free article] [PubMed] [Google Scholar]
- 23.Johnson KA, Gregas M, Becker JA, et al. Imaging of amyloid burden and distribution in cerebral amyloid angiopathy. Ann Neurol 2007;62(3):229–234. [DOI] [PubMed] [Google Scholar]
- 24.Reiman EM, Chen K, Liu X, et al. Fibrillar amyloid-beta burden in cognitively normal people at 3 levels of genetic risk for Alzheimer’s disease. Proc Natl Acad Sci U S A 2009;106(16):6820–6825. [DOI] [PMC free article] [PubMed] [Google Scholar]
- 25.Ossenkoppele R, Jansen WJ, Rabinovici GD, et al. Prevalence of amyloid PET positivity in dementia syndromes: a meta-analysis. JAMA 2015;313(19):1939–1949. [DOI] [PMC free article] [PubMed] [Google Scholar]
- 26.Villemagne VL, Burnham S, Bourgeat P, et al. Amyloid β deposition, neurodegeneration, and cognitive decline in sporadic Alzheimer’s disease: a prospective cohort study. Lancet Neurol 2013;12(4):357–367. [DOI] [PubMed] [Google Scholar]
- 27.Rowe CC, Bourgeat P, Ellis KA, et al. Predicting Alzheimer disease with β-amyloid imaging: results from the Australian imaging, biomarkers, and lifestyle study of ageing. Ann Neurol 2013;74(6):905–913. [DOI] [PubMed] [Google Scholar]
- 28.Jack CR Jr, Wiste HJ, Lesnick TG, et al. Brain β-amyloid load approaches a plateau. Neurology 2013;80(10):890–896. [DOI] [PMC free article] [PubMed] [Google Scholar]
- 29.Villemagne VL, Pike KE, Darby D, et al. Abeta deposits in older non-demented individuals with cognitive decline are indicative of preclinical Alzheimer’s disease. Neuropsychologia 2008;46(6):1688–1697. [DOI] [PubMed] [Google Scholar]
- 30.Jack CR Jr. PART and SNAP. Acta Neuropathol (Berl) 2014;128(6):773–776. [DOI] [PMC free article] [PubMed] [Google Scholar]
- 31.Long JM, Holtzman DM. Alzheimer Disease: An Update on Pathobiology and Treatment Strategies. Cell 2019;179(2):312–339. [DOI] [PMC free article] [PubMed] [Google Scholar]
- 32.Rinne JO, Brooks DJ, Rossor MN, et al. 11C-PiB PET assessment of change in fibrillar amyloid-beta load in patients with Alzheimer’s disease treated with bapineuzumab: a phase 2, double-blind, placebo-controlled, ascending-dose study. Lancet Neurol 2010;9(4):363–372. [DOI] [PubMed] [Google Scholar]
- 33.Salloway S, Sperling R, Fox NC, et al. Two phase 3 trials of bapineuzumab in mild-to-moderate Alzheimer’s disease. N Engl J Med 2014;370(4):322–333. [DOI] [PMC free article] [PubMed] [Google Scholar]
- 34.Sevigny J, Chiao P, Bussière T, et al. The antibody aducanumab reduces Aβ plaques in Alzheimer’s disease. Nature 2016;537(7618):50–56. [DOI] [PubMed] [Google Scholar]
- 35.Sperling RA, Jack CR Jr, Aisen PS. Testing the right target and right drug at the right stage. Sci Transl Med 2011;3(111):111cm33. [DOI] [PMC free article] [PubMed] [Google Scholar]
- 36.Sperling RA, Rentz DM, Johnson KA, et al. The A4 study: stopping AD before symptoms begin? Sci Transl Med 2014;6(228):228fs13. [DOI] [PMC free article] [PubMed] [Google Scholar]
- 37.SPRINT MIND Investigators for the SPRINT Research Group ; Williamson JD, Pajewski NM, et al. Effect of Intensive vs Standard Blood Pressure Control on Probable Dementia: A Randomized Clinical Trial. JAMA 2019;321(6):553–561. [DOI] [PMC free article] [PubMed] [Google Scholar]
- 38.Ngandu T, Lehtisalo J, Solomon A, et al. A 2 year multidomain intervention of diet, exercise, cognitive training, and vascular risk monitoring versus control to prevent cognitive decline in at-risk elderly people (FINGER): a randomised controlled trial. Lancet 2015;385(9984):2255–2263. [DOI] [PubMed] [Google Scholar]
- 39.Villain N, Chételat G, Grassiot B, et al. Regional dynamics of amyloid-β deposition in healthy elderly, mild cognitive impairment and Alzheimer’s disease: a voxelwise PiB-PET longitudinal study. Brain 2012;135(Pt 7):2126–2139. [DOI] [PubMed] [Google Scholar]
- 40.Landau SM, Fero A, Baker SL, et al. Measurement of longitudinal β-amyloid change with 18F-florbetapir PET and standardized uptake value ratios. J Nucl Med 2015;56(4):567–574. [DOI] [PMC free article] [PubMed] [Google Scholar]
- 41.Villemagne VL, Fodero-Tavoletti MT, Masters CL, Rowe CC. Tau imaging: early progress and future directions. Lancet Neurol 2015;14(1):114–124. [DOI] [PubMed] [Google Scholar]
- 42.Chien DT, Bahri S, Szardenings AK, et al. Early clinical PET imaging results with the novel PHF-tau radioligand [F-18]-T807. J Alzheimers Dis 2013;34(2):457–468. [DOI] [PubMed] [Google Scholar]
- 43.Stephens A, Kroth H, Berndt M, et al. Characterization of novel PET tracers for the assessment of tau pathology In Alzheimer’s disease and other tauopathies. AD/PD. Vienna, Austria: Krager, 2017. [Google Scholar]
- 44.Walji AM, Hostetler ED, Selnick H, et al. Discovery of 6-(Fluoro-(18)F)-3-(1H-pyrrolo[2,3-c]pyridin-1-yl)isoquinolin-5-amine ([(18)F]-MK-6240): A Positron Emission Tomography (PET) Imaging Agent for Quantification of Neurofibrillary Tangles (NFTs). J Med Chem 2016;59(10):4778–4789. [DOI] [PubMed] [Google Scholar]
- 45.Johnson KA, Schultz A, Betensky RA, et al. Tau positron emission tomographic imaging in aging and early Alzheimer disease. Ann Neurol 2016;79(1):110–119. [DOI] [PMC free article] [PubMed] [Google Scholar]
- 46.Lockhart SN, Baker SL, Okamura N, et al. Dynamic PET Measures of Tau Accumulation in Cognitively Normal Older Adults and Alzheimer’s Disease Patients Measured Using [18F] THK-5351. PLoS One 2016;11(6):e0158460. [DOI] [PMC free article] [PubMed] [Google Scholar]
- 47.Chiotis K, Saint-Aubert L, Savitcheva I, et al. Imaging in-vivo tau pathology in Alzheimer’s disease with THK5317 PET in a multimodal paradigm. Eur J Nucl Med Mol Imaging 2016;43(9):1686–1699. [DOI] [PMC free article] [PubMed] [Google Scholar]
- 48.Maruyama M, Shimada H, Suhara T, et al. Imaging of tau pathology in a tauopathy mouse model and in Alzheimer patients compared to normal controls. Neuron 2013;79(6):1094–1108. [DOI] [PMC free article] [PubMed] [Google Scholar]
- 49.Baker SL, Harrison TM, Maass A, La Joie R, Jagust WJ. Effect of Off-Target Binding on 18F-Flortaucipir Variability in Healthy Controls Across the Life Span. J Nucl Med 2019;60(10):1444–1451. [DOI] [PMC free article] [PubMed] [Google Scholar]
- 50.Gobbi LC, Knust H, Körner M, et al. Identification of three novel radiotracers for imaging aggregated tau in Alzheimer’s disease with Positron Emission Tomography. J Med Chem 2017;60(17):7350–7370. [DOI] [PubMed] [Google Scholar]
- 51.Brendel M, Barthel H, van Eimeren T, et al. Assessment of 18F-PI-2620 as a Biomarker in Progressive Supranuclear Palsy. JAMA Neurol 2020;77(11):1408–1419. [DOI] [PMC free article] [PubMed] [Google Scholar]
- 52.Delacourte A, David JP, Sergeant N, et al. The biochemical pathway of neurofibrillary degeneration in aging and Alzheimer’s disease. Neurology 1999;52(6):1158–1165. [DOI] [PubMed] [Google Scholar]
- 53.Schöll M, Lockhart SN, Schonhaut DR, et al. PET Imaging of Tau Deposition in the Aging Human Brain. Neuron 2016;89(5):971–982. [DOI] [PMC free article] [PubMed] [Google Scholar]
- 54.Braak H, Braak E. Frequency of stages of Alzheimer-related lesions in different age categories. Neurobiol Aging 1997;18(4):351–357. [DOI] [PubMed] [Google Scholar]
- 55.Delacourte A, Sergeant N, Wattez A, et al. Tau aggregation in the hippocampal formation: an ageing or a pathological process? Exp Gerontol 2002;37(10-11):1291–1296. [DOI] [PubMed] [Google Scholar]
- 56.Janocko NJ, Brodersen KA, Soto-Ortolaza AI, et al. Neuropathologically defined subtypes of Alzheimer’s disease differ significantly from neurofibrillary tangle-predominant dementia. Acta Neuropathol (Berl) 2012;124(5):681–692. [DOI] [PMC free article] [PubMed] [Google Scholar]
- 57.Charil A, Shcherbinin S, Southekal S, et al. Tau Subtypes of Alzheimer’s Disease Determined in vivo Using Flortaucipir PET Imaging. J Alzheimers Dis 2019;71(3):1037–1048. [DOI] [PubMed] [Google Scholar]
- 58.Xia C, Makaretz SJ, Caso C, et al. Association of in vivo [18F]AV-1451 tau PET imaging results with cortical atrophy and symptoms in typical and atypical Alzheimer disease. JAMA Neurol 2017;74(4):427–436. [DOI] [PMC free article] [PubMed] [Google Scholar]
- 59.Chiotis K, Saint-Aubert L, Rodriguez-Vieitez E, et al. Longitudinal changes of tau PET imaging in relation to hypometabolism in prodromal and Alzheimer’s disease dementia. Mol Psychiatry 2018;23(7):1666–1673. [DOI] [PubMed] [Google Scholar]
- 60.La Joie R, Visani AV, Baker SL, et al. Prospective longitudinal atrophy in Alzheimer’s disease correlates with the intensity and topography of baseline tau-PET. Sci Transl Med 2020;12(524):eaau5732. [DOI] [PMC free article] [PubMed] [Google Scholar]
- 61.Pontecorvo MJ, Devous MD Sr, Navitsky M, et al. Relationships between flortaucipir PET tau binding and amyloid burden, clinical diagnosis, age and cognition. Brain 2017;140(3):748–763. [DOI] [PMC free article] [PubMed] [Google Scholar]
- 62.Ossenkoppele R, Schonhaut DR, Schöll M, et al. Tau PET patterns mirror clinical and neuroanatomical variability in Alzheimer’s disease. Brain 2016;139(Pt 5):1551–1567. [DOI] [PMC free article] [PubMed] [Google Scholar]
- 63.Ossenkoppele R, Rabinovici GD, Smith R, et al. Discriminative Accuracy of [18F]flortaucipir Positron Emission Tomography for Alzheimer Disease vs Other Neurodegenerative Disorders. JAMA 2018;320(11):1151–1162. [DOI] [PMC free article] [PubMed] [Google Scholar]
- 64.Leuzy A, Smith R, Ossenkoppele R, et al. Diagnostic Performance of RO948 F 18 Tau Positron Emission Tomography in the Differentiation of Alzheimer Disease From Other Neurodegenerative Disorders. JAMA Neurol 2020;77(8):955–965. [DOI] [PMC free article] [PubMed] [Google Scholar]
- 65.Benzinger T, Gordon B, Friedrichsen K, et al. Tau PET imaging with AV-1451 in autosomal dominant Alzheimer’s disease: Update from the Dominantly Inherited Alzheimer Network (DIAN). Alzheimers Dement 2016;12(7S_Part_7)P378. [Google Scholar]
- 66.Schöll M, Ossenkoppele R, Strandberg O, et al. Distinct 18F-AV-1451 tau PET retention patterns in early- and late-onset Alzheimer’s disease. Brain 2017;140(9):2286–2294. [DOI] [PubMed] [Google Scholar]
- 67.Stern RA, Adler CH, Chen K, et al. Tau Positron-Emission Tomography in Former National Football League Players. N Engl J Med 2019;380(18):1716–1725. [DOI] [PMC free article] [PubMed] [Google Scholar]
- 68.Jack CR Jr, Bennett DA, Blennow K, et al. NIA-AA Research Framework: Toward a biological definition of Alzheimer’s disease. Alzheimers Dement 2018;14(4):535–562. [DOI] [PMC free article] [PubMed] [Google Scholar]
- 69.Jack CR Jr, Therneau TM, Weigand SD, et al. Prevalence of Biologically vs Clinically Defined Alzheimer Spectrum Entities Using the National Institute on Aging-Alzheimer’s Association Research Framework. JAMA Neurol 2019;76(10):1174. [DOI] [PMC free article] [PubMed] [Google Scholar]
- 70.Altomare D, de Wilde A, Ossenkoppele R, et al. Applying the ATN scheme in a memory clinic population: The ABIDE project. Neurology 2019;93(17):e1635–e1646. [DOI] [PubMed] [Google Scholar]
- 71.Dodich A, Mendes A, Assal F, et al. The A/T/N model applied through imaging biomarkers in a memory clinic. Eur J Nucl Med Mol Imaging 2020;47(2):247–255. [DOI] [PubMed] [Google Scholar]
- 72.Soldan A, Pettigrew C, Fagan AM, et al. ATN profiles among cognitively normal individuals and longitudinal cognitive outcomes. Neurology 2019;92(14):e1567–e1579. [DOI] [PMC free article] [PubMed] [Google Scholar]
- 73.Ellis KA, Bush AI, Darby D, et al. The Australian Imaging, Biomarkers and Lifestyle (AIBL) study of aging: methodology and baseline characteristics of 1112 individuals recruited for a longitudinal study of Alzheimer’s disease. Int Psychogeriatr 2009;21(4):672–687. [DOI] [PubMed] [Google Scholar]
- 74.Frisoni GB, Barkhof F, Altomare D, et al. AMYPAD Diagnostic and Patient Management Study: Rationale and design. Alzheimers Dement 2019;15(3):388–399 [Published correction appears in Alzheimers Dement 2019;15(11):1505.]. [DOI] [PubMed] [Google Scholar]
- 75.Mueller SG, Weiner MW, Thal LJ, et al. Ways toward an early diagnosis in Alzheimer’s disease: the Alzheimer’s Disease Neuroimaging Initiative (ADNI). Alzheimers Dement 2005;1(1):55–66. [DOI] [PMC free article] [PubMed] [Google Scholar]
- 76.Bateman RJ, Xiong C, Benzinger TL, et al. Clinical and biomarker changes in dominantly inherited Alzheimer’s disease. N Engl J Med 2012;367(9):795–804. [DOI] [PMC free article] [PubMed] [Google Scholar]
- 77.Klunk WE, Koeppe RA, Price JC, et al. The Centiloid Project: standardizing quantitative amyloid plaque estimation by PET. Alzheimers Dement 2015;11(1):1–15.e1–e4. [DOI] [PMC free article] [PubMed] [Google Scholar]
- 78.Rowe CC, Jones G, Doré V, et al. Standardized Expression of 18F-NAV4694 and 11C-PiB β-Amyloid PET Results with the Centiloid Scale. J Nucl Med 2016;57(8):1233–1237. [DOI] [PubMed] [Google Scholar]
- 79.Navitsky M, Joshi AD, Kennedy I, et al. Standardization of amyloid quantitation with florbetapir standardized uptake value ratios to the Centiloid scale. Alzheimers Dement 2018;14(12):1565–1571. [DOI] [PubMed] [Google Scholar]
- 80.Battle MR, Pillay LC, Lowe VJ, et al. Centiloid scaling for quantification of brain amyloid with [18F]flutemetamol using multiple processing methods. EJNMMI Res 2018;8(1):107. [DOI] [PMC free article] [PubMed] [Google Scholar]
- 81.Rowe CC, Doré V, Jones G, et al. 18F-Florbetaben PET beta-amyloid binding expressed in Centiloids. Eur J Nucl Med Mol Imaging 2017;44(12):2053–2059. [DOI] [PMC free article] [PubMed] [Google Scholar]
- 82.van Berckel BN, Ossenkoppele R, Tolboom N, et al. Longitudinal amyloid imaging using 11C-PiB: methodologic considerations. J Nucl Med 2013;54(9):1570–1576. [DOI] [PubMed] [Google Scholar]
- 83.Carson RE, Channing MA, Blasberg RG, et al. Comparison of bolus and infusion methods for receptor quantitation: application to [18F]cyclofoxy and positron emission tomography. J Cereb Blood Flow Metab 1993;13(1):24–42. [DOI] [PubMed] [Google Scholar]
- 84.Bremmer JP, van Berckel BN, Persoon S, et al. Day-to-day test-retest variability of CBF, CMRO2, and OEF measurements using dynamic 15O PET studies. Mol Imaging Biol 2011;13(4):759–768. [DOI] [PMC free article] [PubMed] [Google Scholar]
- 85.Austin BP, Nair VA, Meier TB, et al. Effects of hypoperfusion in Alzheimer’s disease. J Alzheimers Dis 2011;26 Suppl 3(Suppl 3):123–133. [DOI] [PMC free article] [PubMed] [Google Scholar]
- 86.Lammertsma AA, Hume SP. Simplified reference tissue model for PET receptor studies. Neuroimage 1996;4(3 Pt 1):153–158. [DOI] [PubMed] [Google Scholar]
- 87.Gunn RN, Lammertsma AA, Hume SP, Cunningham VJ. Parametric imaging of ligand-receptor binding in PET using a simplified reference region model. Neuroimage 1997;6(4):279–287. [DOI] [PubMed] [Google Scholar]
- 88.Logan J, Fowler JS, Volkow ND, Wang GJ, Ding YS, Alexoff DL. Distribution volume ratios without blood sampling from graphical analysis of PET data. J Cereb Blood Flow Metab 1996;16(5):834–840. [DOI] [PubMed] [Google Scholar]
- 89.Slifstein M, Laruelle M. Effects of statistical noise on graphic analysis of PET neuroreceptor studies. J Nucl Med 2000;41(12):2083–2088. [PubMed] [Google Scholar]
- 90.Tolboom N, Yaqub M, Boellaard R, et al. Test-retest variability of quantitative [11C]PIB studies in Alzheimer’s disease. Eur J Nucl Med Mol Imaging 2009;36(10):1629–1638. [DOI] [PMC free article] [PubMed] [Google Scholar]
- 91.Golla SS, Verfaillie SC, Boellaard R, et al. Quantification of [18F]florbetapir: A test-retest tracer kinetic modelling study. J Cereb Blood Flow Metab 2019;39(11):2172–2180. [DOI] [PMC free article] [PubMed] [Google Scholar]
- 92.Timmers T, Ossenkoppele R, Visser D, et al. Test-retest repeatability of [18F]Flortaucipir PET in Alzheimer’s disease and cognitively normal individuals. J Cereb Blood Flow Metab 2019. 10.1177/0271678X19879226. Published online October 1, 2019. [DOI] [PMC free article] [PubMed] [Google Scholar]
- 93.Love S, Miners JS. Cerebral Hypoperfusion and the Energy Deficit in Alzheimer’s Disease. Brain Pathol 2016;26(5):607–617. [DOI] [PMC free article] [PubMed] [Google Scholar]
- 94.Salinas CA, Searle GE, Gunn RN. The simplified reference tissue model: model assumption violations and their impact on binding potential. J Cereb Blood Flow Metab 2015;35(2):304–311. [DOI] [PMC free article] [PubMed] [Google Scholar]
- 95.Koeppe RA, Frey KA, Kume A, Albin R, Kilbourn MR, Kuhl DE. Equilibrium versus compartmental analysis for assessment of the vesicular monoamine transporter using (+)-alpha-[11C]dihydrotetrabenazine (DTBZ) and positron emission tomography. J Cereb Blood Flow Metab 1997;17(9):919–931. [DOI] [PubMed] [Google Scholar]
- 96.Heeman F, Yaqub M, Lopes Alves I, et al. Optimized dual-time-window protocols for quantitative [18F]flutemetamol and [18F]florbetaben PET studies. EJNMMI Res 2019;9(1):32. [DOI] [PMC free article] [PubMed] [Google Scholar]
- 97.Morbelli S, Esposito G, Arbizu J, et al. EANM practice guideline/SNMMI procedure standard for dopaminergic imaging in Parkinsonian syndromes 1.0. Eur J Nucl Med Mol Imaging 2020;47(8):1885–1912. [DOI] [PMC free article] [PubMed] [Google Scholar]
- 98.Kaasinen V, Kankare T, Joutsa J, Vahlberg T. Presynaptic Striatal Dopaminergic Function in Atypical Parkinsonism: A Metaanalysis of Imaging Studies. J Nucl Med 2019;60(12):1757–1763. [DOI] [PMC free article] [PubMed] [Google Scholar]
- 99.Saari L, Kivinen K, Gardberg M, Joutsa J, Noponen T, Kaasinen V. Dopamine transporter imaging does not predict the number of nigral neurons in Parkinson disease. Neurology 2017;88(15):1461–1467. [DOI] [PubMed] [Google Scholar]
- 100.Marshall VL, Reininger CB, Marquardt M, et al. Parkinson’s disease is overdiagnosed clinically at baseline in diagnostically uncertain cases: a 3-year European multicenter study with repeat [123I]FP-CIT SPECT. Mov Disord 2009;24(4):500–508. [DOI] [PubMed] [Google Scholar]
- 101.Postuma RB, Berg D, Stern M, et al. MDS clinical diagnostic criteria for Parkinson’s disease. Mov Disord 2015;30(12):1591–1601. [DOI] [PubMed] [Google Scholar]
- 102.Bhattacharjee S, Paramanandam V, Bhattacharya A. Analysis of the Effect of Dopamine Transporter Scan on the Diagnosis and Management in a Tertiary Neurology Center. Neurohospitalist 2019;9(3):144–150. [DOI] [PMC free article] [PubMed] [Google Scholar]
- 103.Emre M, Aarsland D, Brown R, et al. Clinical diagnostic criteria for dementia associated with Parkinson’s disease. Mov Disord 2007;22(12):1689–1707; quiz 1837. [DOI] [PubMed] [Google Scholar]
- 104.Jellinger KA, Korczyn AD. Are dementia with Lewy bodies and Parkinson’s disease dementia the same disease? BMC Med 2018;16(1):34. [DOI] [PMC free article] [PubMed] [Google Scholar]
- 105.McCleery J, Morgan S, Bradley KM, Noel-Storr AH, Ansorge O, Hyde C. Dopamine transporter imaging for the diagnosis of dementia with Lewy bodies. Cochrane Database Syst Rev 2015;1(1):CD010633. [DOI] [PMC free article] [PubMed] [Google Scholar]
- 106.Shirvan J, Clement N, Ye R, et al. Neuropathologic correlates of amyloid and dopamine transporter imaging in Lewy body disease. Neurology 2019;93(5):e476–e484. [DOI] [PMC free article] [PubMed] [Google Scholar]
- 107.McKeith IG, Boeve BF, Dickson DW, et al. Diagnosis and management of dementia with Lewy bodies: Fourth consensus report of the DLB Consortium. Neurology 2017;89(1):88–100. [DOI] [PMC free article] [PubMed] [Google Scholar]
- 108.Thomas AJ, Attems J, Colloby SJ, et al. Autopsy validation of 123I-FP-CIT dopaminergic neuroimaging for the diagnosis of DLB. Neurology 2017;88(3):276–283. [DOI] [PMC free article] [PubMed] [Google Scholar]
- 109.Roselli F, Pisciotta NM, Perneczky R, et al. Severity of neuropsychiatric symptoms and dopamine transporter levels in dementia with Lewy bodies: a 123I-FP-CIT SPECT study. Mov Disord 2009;24(14):2097–2103. [DOI] [PubMed] [Google Scholar]
- 110.Armstrong MJ, Litvan I, Lang AE, et al. Criteria for the diagnosis of corticobasal degeneration. Neurology 2013;80(5):496–503. [DOI] [PMC free article] [PubMed] [Google Scholar]
- 111.Pirker S, Perju-Dumbrava L, Kovacs GG, Traub-Weidinger T, Pirker W. Progressive Dopamine Transporter Binding Loss in Autopsy-Confirmed Corticobasal Degeneration. J Parkinsons Dis 2015;5(4):907–912. [DOI] [PubMed] [Google Scholar]
- 112.Whitwell JL, Höglinger GU, Antonini A, et al. Radiological biomarkers for diagnosis in PSP: Where are we and where do we need to be? Mov Disord 2017;32(7):955–971. [DOI] [PMC free article] [PubMed] [Google Scholar]
- 113.Höglinger GU, Respondek G, Stamelou M, et al. Clinical diagnosis of progressive supranuclear palsy: The movement disorder society criteria. Mov Disord 2017;32(6):853–864. [DOI] [PMC free article] [PubMed] [Google Scholar]
- 114.Gilman S, Wenning GK, Low PA, et al. Second consensus statement on the diagnosis of multiple system atrophy. Neurology 2008;71(9):670–676. [DOI] [PMC free article] [PubMed] [Google Scholar]
- 115.Heller J, Brcina N, Dogan I, et al. Brain imaging findings in idiopathic REM sleep behavior disorder (RBD) - A systematic review on potential biomarkers for neurodegeneration. Sleep Med Rev 2017;34:23–33. [DOI] [PubMed] [Google Scholar]
- 116.Heneka MT, Carson MJ, El Khoury J, et al. Neuroinflammation in Alzheimer’s disease. Lancet Neurol 2015;14(4):388–405. [DOI] [PMC free article] [PubMed] [Google Scholar]
- 117.Arranz AM, De Strooper B. The role of astroglia in Alzheimer’s disease: pathophysiology and clinical implications. Lancet Neurol 2019;18(4):406–414. [DOI] [PubMed] [Google Scholar]
- 118.Lavisse S, Guillermier M, Hérard AS, et al. Reactive astrocytes overexpress TSPO and are detected by TSPO positron emission tomography imaging. J Neurosci 2012;32(32):10809–10818. [DOI] [PMC free article] [PubMed] [Google Scholar]
- 119.Varrone A, Oikonen V, Forsberg A, et al. Positron emission tomography imaging of the 18-kDa translocator protein (TSPO) with [18F]FEMPA in Alzheimer’s disease patients and control subjects. Eur J Nucl Med Mol Imaging 2015;42(3):438–446. [DOI] [PubMed] [Google Scholar]
- 120.Boche D, Gerhard A, Rodriguez-Vieitez E; MINC Faculty. Prospects and challenges of imaging neuroinflammation beyond TSPO in Alzheimer’s disease. Eur J Nucl Med Mol Imaging 2019;46(13):2831–2847. [DOI] [PMC free article] [PubMed] [Google Scholar]
- 121.Edison P, Archer HA, Gerhard A, et al. Microglia, amyloid, and cognition in Alzheimer’s disease: An [11C](R)PK11195-PET and [11C]PIB-PET study. Neurobiol Dis 2008;32(3):412–419. [DOI] [PubMed] [Google Scholar]
- 122.Yokokura M, Mori N, Yagi S, et al. In vivo changes in microglial activation and amyloid deposits in brain regions with hypometabolism in Alzheimer’s disease. Eur J Nucl Med Mol Imaging 2011;38(2):343–351. [DOI] [PubMed] [Google Scholar]
- 123.Wiley CA, Lopresti BJ, Venneti S, et al. Carbon 11-labeled Pittsburgh Compound B and carbon 11-labeled (R)-PK11195 positron emission tomographic imaging in Alzheimer disease. Arch Neurol 2009;66(1):60–67. [DOI] [PMC free article] [PubMed] [Google Scholar]
- 124.Schuitemaker A, Kropholler MA, Boellaard R, et al. Microglial activation in Alzheimer’s disease: an (R)-[11C]PK11195 positron emission tomography study. Neurobiol Aging 2013;34(1):128–136. [DOI] [PubMed] [Google Scholar]
- 125.Kreisl WC, Lyoo CH, McGwier M, et al. In vivo radioligand binding to translocator protein correlates with severity of Alzheimer’s disease. Brain 2013;136(Pt 7):2228–2238. [DOI] [PMC free article] [PubMed] [Google Scholar]
- 126.Dani M, Wood M, Mizoguchi R, et al. Microglial activation correlates in vivo with both tau and amyloid in Alzheimer’s disease. Brain 2018;141(9):2740–2754. [DOI] [PubMed] [Google Scholar]
- 127.Hagens MHJ, Golla SSV, Janssen B, et al. The P2X7 receptor tracer [11C]SMW139 as an in vivo marker of neuroinflammation in multiple sclerosis: a first-in man study. Eur J Nucl Med Mol Imaging 2020;47(2):379–389. [DOI] [PMC free article] [PubMed] [Google Scholar]
- 128.Kumlien E, Nilsson A, Hagberg G, Långström B, Bergström M. PET with 11C-deuterium-deprenyl and 18F-FDG in focal epilepsy. Acta Neurol Scand 2001;103(6):360–366. [DOI] [PubMed] [Google Scholar]
- 129.Engler H, Lundberg PO, Ekbom K, et al. Multitracer study with positron emission tomography in Creutzfeldt-Jakob disease. Eur J Nucl Med Mol Imaging 2003;30(1):85–95. [DOI] [PubMed] [Google Scholar]
- 130.Johansson A, Engler H, Blomquist G, et al. Evidence for astrocytosis in ALS demonstrated by [11C](L)-deprenyl-D2 PET. J Neurol Sci 2007;255(1-2):17–22. [DOI] [PubMed] [Google Scholar]
- 131.Carter SF, Schöll M, Almkvist O, et al. Evidence for astrocytosis in prodromal Alzheimer disease provided by 11C-deuterium-L-deprenyl: a multitracer PET paradigm combining 11C-Pittsburgh compound B and 18F-FDG. J Nucl Med 2012;53(1):37–46. [DOI] [PubMed] [Google Scholar]
- 132.Rodriguez-Vieitez E, Saint-Aubert L, Carter SF, et al. Diverging longitudinal changes in astrocytosis and amyloid PET in autosomal dominant Alzheimer’s disease. Brain 2016;139(Pt 3):922–936. [DOI] [PMC free article] [PubMed] [Google Scholar]
- 133.Carter SF, Chiotis K, Nordberg A, Rodriguez-Vieitez E. Longitudinal association between astrocyte function and glucose metabolism in autosomal dominant Alzheimer’s disease. Eur J Nucl Med Mol Imaging 2019;46(2):348–356. [DOI] [PMC free article] [PubMed] [Google Scholar]
- 134.Carter SF, Herholz K, Rosa-Neto P, Pellerin L, Nordberg A, Zimmer ER. Astrocyte Biomarkers in Alzheimer’s Disease. Trends Mol Med 2019;25(2):77–95. [DOI] [PubMed] [Google Scholar]
- 135.Finnema SJ, Nabulsi NB, Eid T, et al. Imaging synaptic density in the living human brain. Sci Transl Med 2016;8(348):348ra96. [DOI] [PubMed] [Google Scholar]
- 136.Chen MK, Mecca AP, Naganawa M, et al. Assessing Synaptic Density in Alzheimer Disease With Synaptic Vesicle Glycoprotein 2A Positron Emission Tomographic Imaging. JAMA Neurol 2018;75(10):1215–1224. [DOI] [PMC free article] [PubMed] [Google Scholar]
- 137.Bastin C, Bahri MA, Meyer F, et al. In vivo imaging of synaptic loss in Alzheimer’s disease with [18F]UCB-H positron emission tomography. Eur J Nucl Med Mol Imaging 2020;47(2):390–402. [DOI] [PubMed] [Google Scholar]
- 138.Peelaerts W, Baekelandt V. α-Synuclein strains and the variable pathologies of synucleinopathies. J Neurochem 2016;139(Suppl 1):256–274. [DOI] [PubMed] [Google Scholar]
- 139.Baradaran-Heravi Y, Van Broeckhoven C, van der Zee J. Stress granule mediated protein aggregation and underlying gene defects in the FTD-ALS spectrum. Neurobiol Dis 2020;134:104639. [DOI] [PubMed] [Google Scholar]
- 140.Mielke MM, Syrjanen JA, Blennow K, et al. Plasma and CSF neurofilament light: Relation to longitudinal neuroimaging and cognitive measures. Neurology 2019;93(3):e252–e260. [DOI] [PMC free article] [PubMed] [Google Scholar]
- 141.Startin CM, Ashton NJ, Hamburg S, et al. Plasma biomarkers for amyloid, tau, and cytokines in Down syndrome and sporadic Alzheimer’s disease. Alzheimers Res Ther 2019;11(1):26. [DOI] [PMC free article] [PubMed] [Google Scholar]
- 142.Ovod V, Ramsey KN, Mawuenyega KG, et al. Amyloid β concentrations and stable isotope labeling kinetics of human plasma specific to central nervous system amyloidosis. Alzheimers Dement 2017;13(8):841–849 [Published correction appears in Alzheimers Dement 2017;13(10):1185.]. [DOI] [PMC free article] [PubMed] [Google Scholar]
- 143.Nakamura A, Kaneko N, Villemagne VL, et al. High performance plasma amyloid-β biomarkers for Alzheimer’s disease. Nature 2018;554(7691):249–254. [DOI] [PubMed] [Google Scholar]
- 144.Fossati S, Ramos Cejudo J, Debure L, et al. Plasma tau complements CSF tau and P-tau in the diagnosis of Alzheimer’s disease. Alzheimers Dement (Amst) 2019;11(1):483–492. [DOI] [PMC free article] [PubMed] [Google Scholar]
- 145.Lewczuk P, Ermann N, Andreasson U, et al. Plasma neurofilament light as a potential biomarker of neurodegeneration in Alzheimer’s disease. Alzheimers Res Ther 2018;10(1):71. [DOI] [PMC free article] [PubMed] [Google Scholar]


