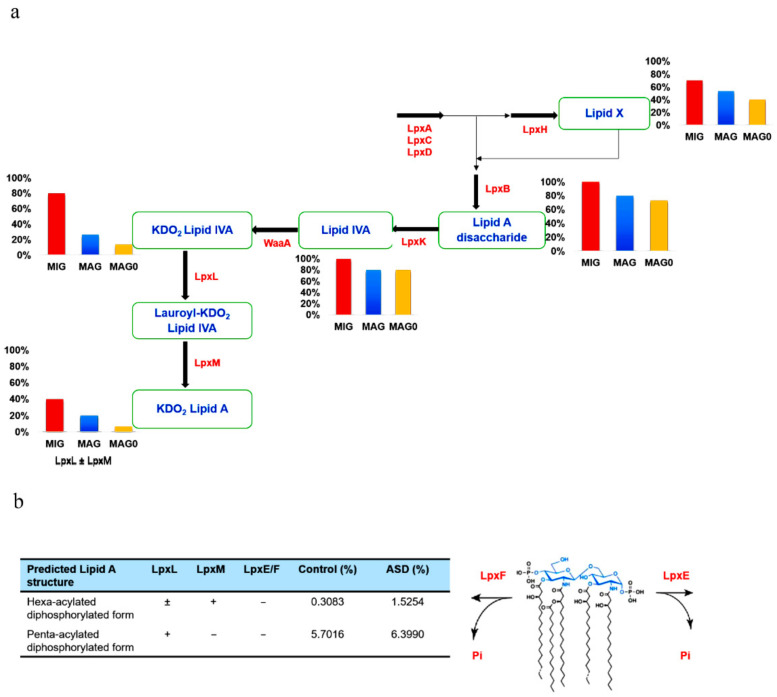
Figure 5.
(a) Prediction of lipopolysaccharide (LPS) products based on gut bacteria counts at the genus level. The 10 most increased genera (MIG) and the 15 most abundant genera for both autism spectrum disorder (ASD) (MAG) and control subjects (MAG0) were considered. The products of enzymes are written in blue. The bar plot depicting the genera count at each stage is below or behind the respective enzyme product. The percentage value indicates the proportion of genera capable of producing the particular metabolic product at each respective stage. (b) Predicted distribution of the late-stage lipid A products at the species level. Key enzymes for the lipid A acylation and modification were analyzed at the species level and their relative abundances were calculated in the ASD and control samples. Lipid X, 2,3-diacyl-GlcN-1-phosphate; Lipid IVA, lipid A disaccharide bisphosphate; KDO2, 2-keto-3-deoxy-D-mannooctanoic acid.

