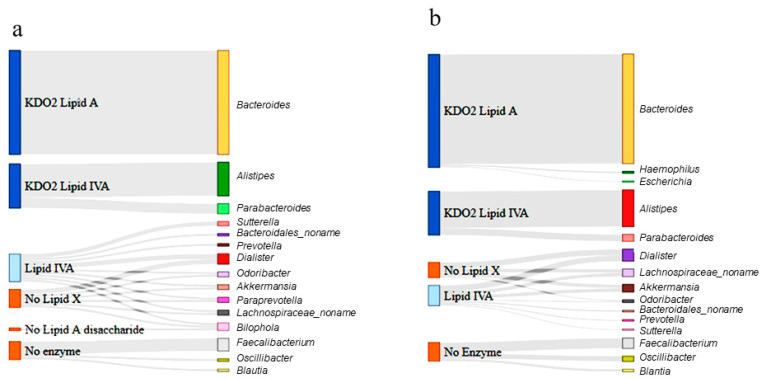
Figure 6.
Sankey diagram depicting the lipopolysaccharide (LPS) metabolism pathway in the 15 most abundant genera (MAG) in the control (a) and ASD samples (b). The genera differentially enriched in ASD children are shown in the right bars as targets. The respective enzymatic stage and product for each genus is shown in the left bars as the source. The Sankey diagram depicts the entire pathways for differentially categorized genera. The width of the enzyme–genus association represents the abundance of the genus. Lipid X, 2,3-diacyl-GlcN-1-phosphate; Lipid IVA, lipid A disaccharide bisphosphate; KDO2, 2-keto-3-deoxy-D-mannooctanoic acid.

