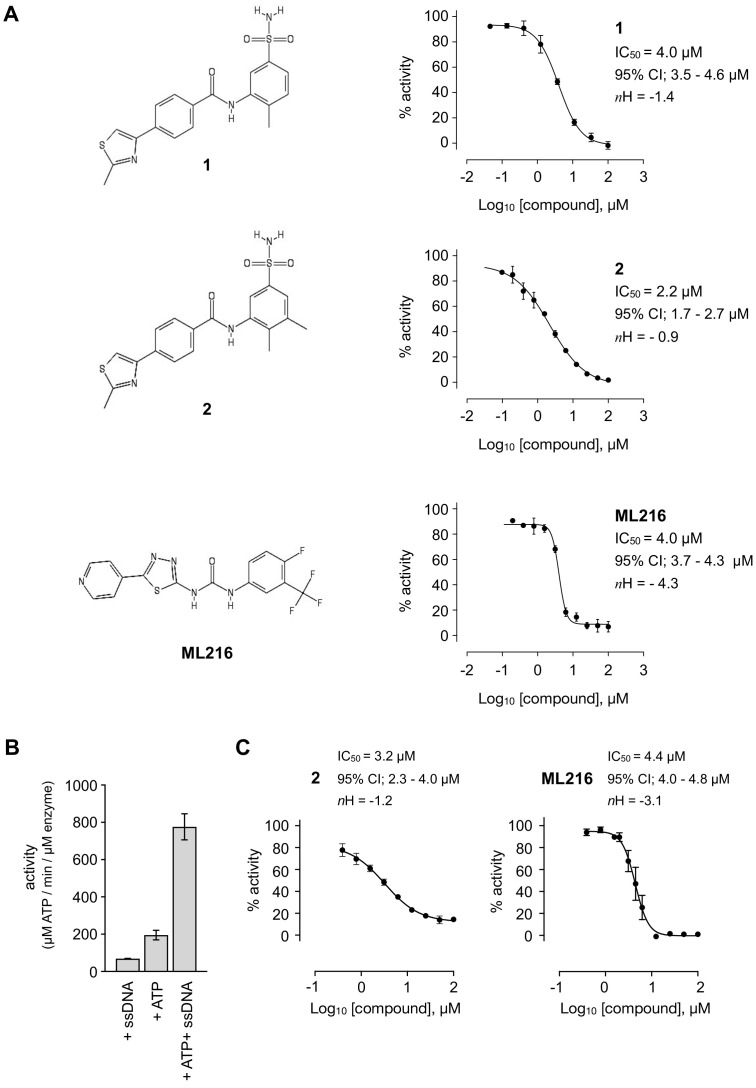
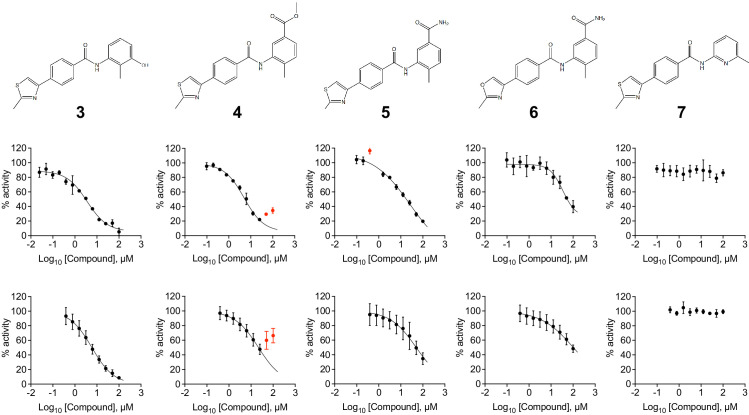
Figure 1. Inhibition of BLM helicase unwinding activity.
(A, left) Chemical drawings for compounds 1, 2, and ML216. (A, right) Dose response curves from fluorescence-based DNA unwinding assays with BLM-HD. Experimental data were fitted with a four parameter, log(inhibitor) vs. response model with variable slope. Calculated values for IC50, Hill slope (nH) and 95% confidence intervals (95% CI) are given in each case. (B) Turnover of ATP by BLM-HD, as measured by a malachite-green end-point assay, is strongly stimulated in the presence of a 20-base single-stranded oligonucleotide. (C) Dose response curves from ATP-turnover assays with BLM-HD. Data were fitted as for (A). In each case data points are the mean of three technical replicates, with error bars representing one standard deviation (1 SD).


