Table 1. Summary of inhibition data for seven exemplars from the identified compound series.
IC50 values were determined by fitting of experimental data to log (inhibitor) vs response models provided in GraphPad Prism. Data for the unwinding assay correspond to three technical replicates from a single experiment. For the ATP-turnover assay data correspond to at least two independent experiments, each containing three technical replicates.
| unwinding | turnover | ||
|---|---|---|---|
| # | Chemical drawing | IC50 [95% CI]; µM | IC50 [95% CI]; µM |
| 2 | 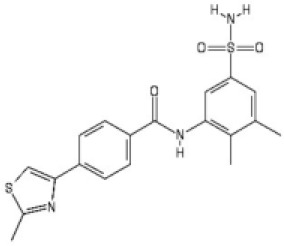 |
2.2 [1.7–2.7] |
3.2 [2.3–4.0] |
| 3 |
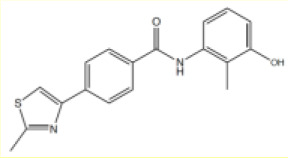
|
3.5 [2.4–5.2] |
5.3 [4.7–6.1] |
| 4 |
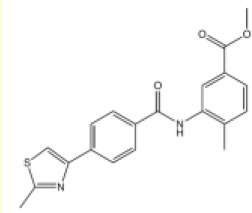
|
6.6 [3.4–12.7] |
11.2 [8.3–15.3] |
| 5 |
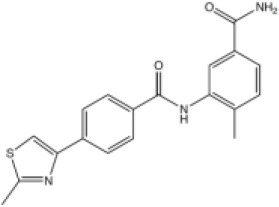
|
12.8 [4.5–36.8] |
47.86 [18.28–180.7] |
| 6 |
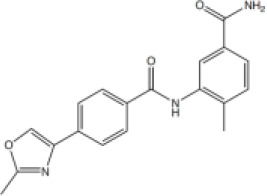
|
56.9 [25.4–171.3] |
40.94 [15.9–139.8] |
| 7 |
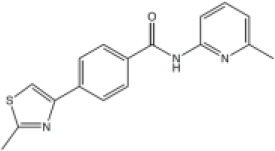
|
No inhibition | No inhibition |
| ML216 |

|
4.0 [3.7–4.3] |
4.4 [4.0–4.8] |
