. 2021 Feb 17;10:e62809. doi: 10.7554/eLife.62809

Figure 8. Electroencephalogram (EEG) data analysis of the reduced pain model.

The top three rows show (a) the main effect of stimulus intensity, (b) the main effect of negative absolute prediction errors, and (c) the main effect of expectation. Left column: time–frequency representation of the statistical F-values averaged over all channels. Significant clusters are highlighted by a solid line. The non-significant expectation cluster is highlighted by a thin dotted line. Right column: power values for all conditions included in the reduced model with a valid modality cue (expect heat receive heat) averaged over all significant time–frequency–electrode samples of the respective cluster. (d) Topographies of the averaged power over time and frequency of the whole cluster extent (i.e. over the whole time and frequency range) at each channel for stimulus intensity (left), negative absolute prediction errors (center), and expectation (right). Brighter colors indicate higher F-values.

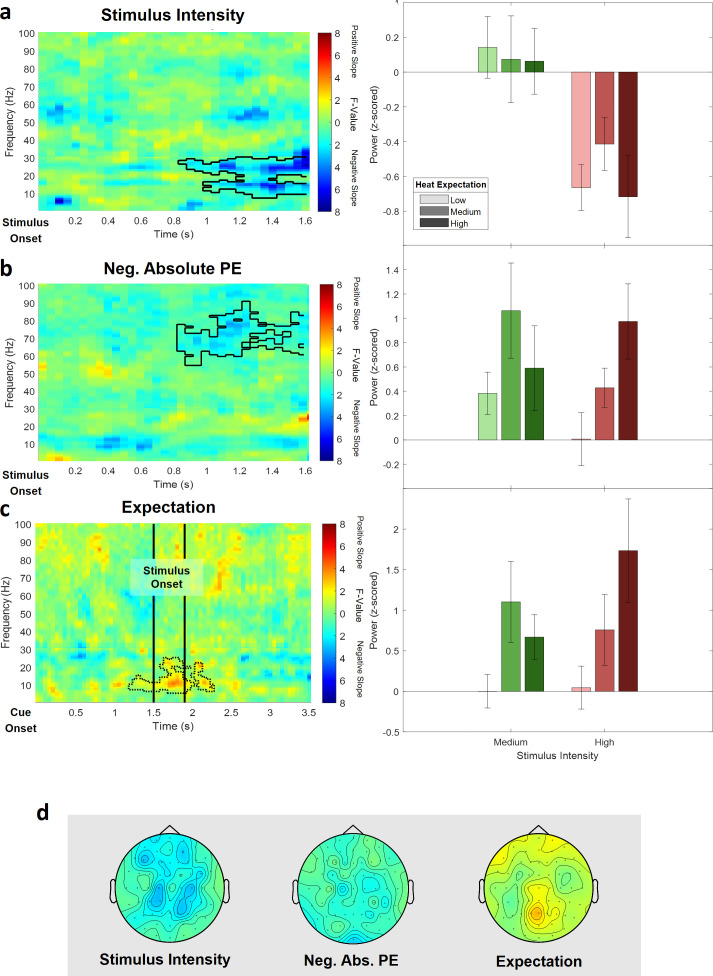
Figure 8.

Figure 8—figure supplement 1. Power values for all medium and high intensity conditions with a valid modality cue.

Figure 8—figure supplement 1.

(Expect heat receive heat) averaged over all significant time–frequency–electrode samples period for each subject (ID) of the negative stimulus intensity cluster of the analysis of the reduced model. Green colors represent medium heat conditions and red colors represent high heat conditions. Color intensities depict expectation level.
Figure 8—figure supplement 2. Power values for all medium and high intensity conditions with a valid modality cue.

Figure 8—figure supplement 2.

(Expect heat receive heat) averaged over all significant time–frequency–electrode samples period for each subject (ID) of the negative absolute prediction error cluster of the analysis of the reduced model. Green colors represent medium heat conditions and red colors represent high heat conditions. Color intensities depict expectation level.
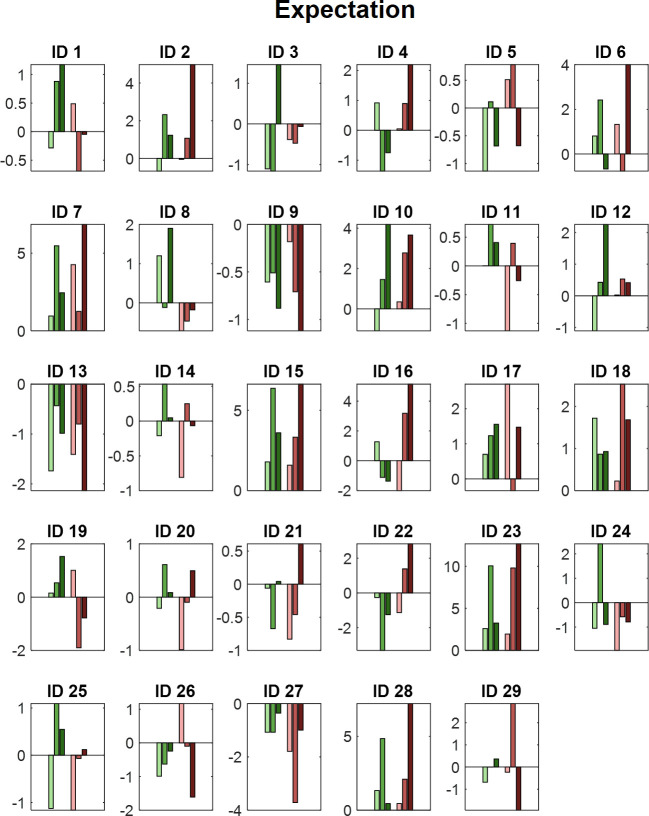
Figure 8—figure supplement 3. Power values for all medium and high intensity conditions with a valid modality cue.

Figure 8—figure supplement 3.

(Expect heat receive heat) averaged over all (non-significant) time–frequency–electrode samples of the respective cluster period for each subject (ID) of the non-significant expectation cluster of the analysis of the reduced model. Green colors represent medium heat conditions and red colors represent high heat conditions. Color intensities depict expectation level.