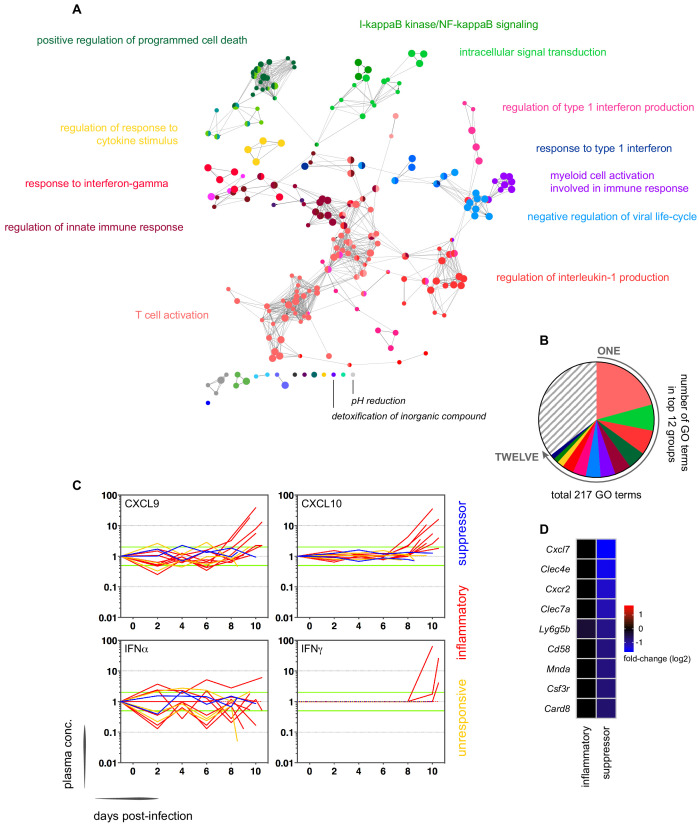
Figure 2. Interferon-stimulated inflammation is the dominant response to blood-stage infection.
(A) Gene ontology network of 2028 genes differentially expressed at diagnosis in the inflammatory group. Each node represents a significantly enriched GO term (adj p<0.05) and node size is determined by significance (bigger nodes have lower p values). Nodes are interconnected according to their relatedness (kappa score >0.4) and grouped if they are connected and share >40% genes. Each functional group is then given a unique colour and the leading GO term in the top 12 groups is highlighted. Two GO terms of interest, which are not part of any functional group, are also shown in italics. (B) The proportion of GO terms in each of the top 12 functional groups; collectively, these account for two thirds of all significantly enriched GO terms in inflammatory volunteers. (C) Plasma concentration of interferon alpha and gamma and interferon-stimulated chemokines (CXCL9 and CXCL10) during infection. One line represents one volunteer (no data for v020) and lines are colour-coded by host response. For each volunteer, all data points are normalised to their own baseline (day −1); horizontal green lines represent a twofold increase or decrease compared to baseline. (D) Log2 fold-change of nine immune genes involved in myeloid cell differentiation and activation in whole blood at diagnosis. Data are presented relative to pre-infection samples and all genes are significantly downregulated in the two suppressor volunteers (adj p<0.05).


