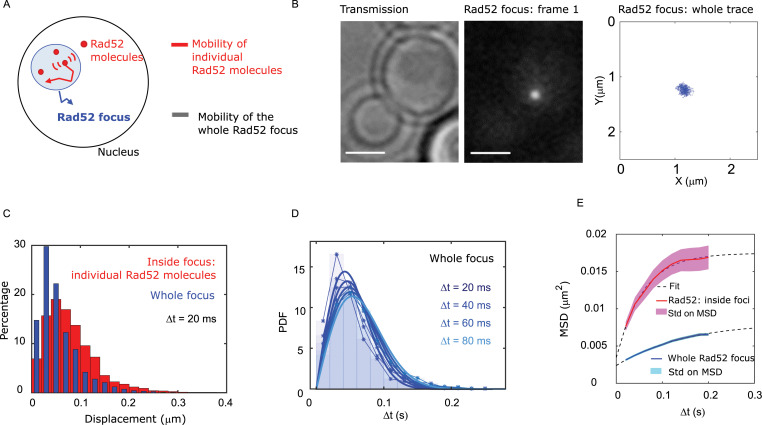
Figure 3. Individual Rad52 molecules are more mobile than the whole focus.
(A) Schematic of the experiment: to shade in light the internal dynamics of Rad52, we compare the mobility of the entire Rad52 foci, shown in light red, with the mobility of individual Rad52 molecules located inside foci, in red. The mobility of the entire Rad52 focus is measured using a strain harboring Rad52-mMaple and a single I-SceI DSB at LYS2 (see Materials and methods). We used high photo-activation illumination to simultaneously activate all Rad52-mMaple and image the entire foci as a single large spot. Rad52 foci were tracked at 20 ms time-intervals in two dimensions. (B) Typical image of a haploid cell harboring a Rad52-mMaple focus after a 2h-induction of a single DSB. Left: transmission image; Middle: typical frame of a movie in which we see the whole focus; Right trajectory of the whole focus after analysis. The bar scale represents 1 μm. (C) Displacements histogram of the entire Rad52 foci (grey), compared with individual Rad52-Halo located inside foci (red, same data shown in Figure 2F in red). Both displacements are measured after 2 hr of galactose induction at 20 ms time intervals in 2-dimensions. F14S/G2 cells harboring a Rad52 focus are analyzed, representing 131 traces (mean length 24 frames), and 3015 translocations of 20 ms time-intervals. (D) PDF of the entire Rad52 foci calculated for 20, 40 and 60 ms time intervals. Plain lines represent a 1-population fit of the PDF. (E) MSD of the entire Rad52 foci (green) versus individual Rad52 molecules located inside foci (red, same data as Figure 2G). The MSD of individual Rad52 molecules inside foci is fitted with a confined model (dotted line) while the MSD of the entire Rad52 focus is fitted using an anomalous model (see Methods).


