

SUMMARY
Neural network computations are usually assumed to emerge from patterns of fast electrical activity. Challenging this view, we show that a male fly’s decision to persist in mating hinges on a biochemical computation that enables processing over minutes to hours. Each neuron in a recurrent network contains slightly different internal molecular estimates of mating progress. Protein Kinase A (PKA) activity contrasts this internal measurement with input from the other neurons to represent accumulated evidence that the network’s goal has been achieved. When consensus is reached, PKA pushes the network toward a large-scale and synchronized burst of calcium influx that we call an eruption. Eruptions transform continuous deliberation within the network into an all-or-nothing output, after which the male will no longer sacrifice his life to continue mating. Here, biochemical activity, invisible to most large-scale recording techniques, is the key computational currency directing behavior and motivational state.
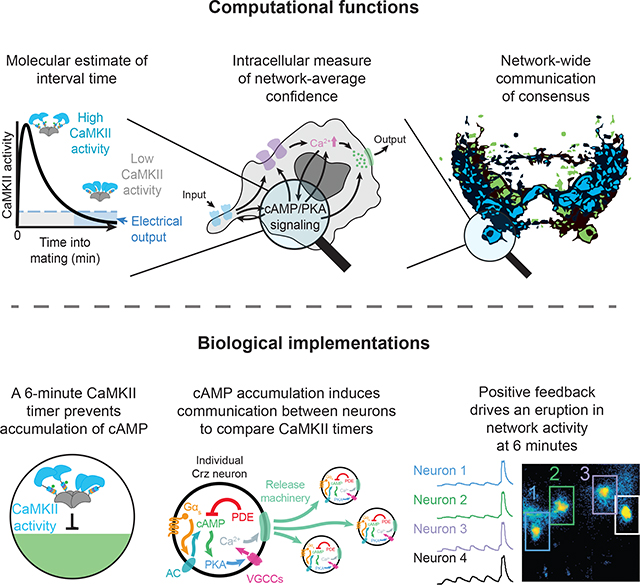
Graphical Abstract
INTRODUCTION
In 2006 L.F. Abbott asked “Where are the switches on this thing?” (Abbott, 2006) referring to the unsolved question of how all-or-none decisions are produced by the brain. To implement a network-level switch, neurons need to collect evidence, communicate, and reach consensus without triggering premature or partial responses in downstream circuitry (Elsayed et al., 2016; Kaufman et al., 2014; Yoo and Hayden, 2020). These problems are compounded when the computations are performed over long timescales, as in many decision-making paradigms (Waskom and Kiani, 2018). In single neurons, the action potential solves analogous problems by transforming accumulated positive and negative inputs into a transient, all-or-nothing output that is broadcasted to postsynaptic targets. Here we identify a similar mechanism acting at the network level and over timescales ranging from seconds to hours, which we call an eruption.
The Corazonin-expressing (Crz) neurons of the male abdominal ganglion comprise an exceptionally tractable system for investigating neuronal networks and behavioral control. These four neurons drive two simultaneous and crucial events in the lives of the male and his mating partner: i) the transfer of sperm from the male to the female (Tayler et al., 2012) and ii) a transition out of a period of insurmountably high motivation to continue mating (Thornquist et al., 2020). Both of these events occur six minutes after a mating begins and are under the control of a molecular timer encoded by the slowly-decaying autophosphorylation of the kinase CaMKII (Thornquist et al., 2020). We show that the Crz neurons use cyclic AMP (cAMP) signaling to average evidence about the passage of time across the network and generate an eruption that signals to downstream circuitry only when a consensus is reached. In addition to revealing this network phenomenon, our results explain the function of CaMKII in the only mechanism for neuronal interval timing yet to be described.
RESULTS
The Crz neurons form a recurrent network that measures the six-minute time interval
Optogenetic silencing of the Crz neurons (using the light-gated chloride channel GtACR1 (Govorunova et al., 2015; Mohammad et al., 2017)) that begins before five minutes into a mating results in copulations lasting ~1–4 hours (long matings), while silencing the neurons any time after seven minutes allows normal, ~23 minute matings (Figure 1A). Long matings result from the failure of the Crz neurons to switch the male out of the state of high motivation that would normally end after ~6 minutes of mating (Thornquist et al., 2020). This sharp transition is instructed by the kinase activity of CaMKII, which delays the electrical activity of the Crz neurons as it slowly decays over the first ~6 minutes of mating (Thornquist et al., 2020) (Figure 1A).
Figure 1: Four Crz neurons form a recurrent network that reports a 6-minute interval.

A) Far left: Schematic summary of the CaMKII timer in the Crz neurons.
Center left: Crz activity triggers a switch in behavioral state that permits termination in response to both opposing drives and the endpoint of the copulation.
Center right and far right: Optogenetic inhibition of the Crz neurons with ACR1 beginning at various times into mating. Silencing the Crz neurons before 6 minutes into mating extends copulation duration from ~23 minutes, and often for longer than 1 hour (green), whereas silencing the neurons after 6 minutes has no effect on copulation duration.
Individual mating durations are plotted as gray dots; the green curve demarcates the proportion classified as long matings at each time point (see Methods).
N values and statistical analyses are listed in Supplementary Table 2. Unless otherwise noted, error bars throughout represent 68% credible intervals, selected to approximate SEM.
B) Simultaneously measured CaMKII timers monitored with green-Camuiα (schematized on left) in two Crz neurons of the same male after optogenetic stimulation using ChR2-XXM (Scholz et al., 2017). Fluorescence lifetime is measured by pooling all pixels within an ROI and computing the empirical lifetime in each frame (see Methods).
C) Measuring any individual CaMKII timer is informative about elapsed time, but cannot match the accuracy of the male’s behavior (“ability to estimate interval” refers to the mutual information between green-Camuiα measurements and a binary variable indicating the amount of time on the x axis has elapsed, see Methods and Figure S1).
D) Pooling CaMKII activity across time (blue) and across neurons (green) permits a much more reliable estimate of elapsed time, especially if values are compared on the scale of ~10 seconds.
E) Synaptic (Synapotagmin::GFP, Syt, green) and dendritic (Denmark, red) markers are closely intermingled in the Crz neurons.
F) Optogenetic stimulation of individual Crz neurons (dark red traces) excites the other Crz neurons (light red traces).
G) Probabilistic silencing (50%, using Coin-FLP(Bosch et al., 2015)) of each Crz neuron lengthens copulation in a proportion of males that suggests the requirement of only two active Crz neurons for network function (long matings whenever 3 or 4 neurons are silenced).
H) Sustained optogenetic stimulation of even a single Crz neuron throughout mating (stochastically selected using a heat-inducible flippase (Nern et al., 2015); monitored by tdTomato fusion to Chr; red) is sufficient to recover a normal copulation duration when all Crz neurons are otherwise silenced by expression of Kir2.1 (monitored by EGFP fusion; cyan).
Simultaneous measurements of CaMKII activity within multiple Crz neurons of the same fly (using the FRET-FLIM reporter green-Camuiα (Lee et al., 2009) after optogenetic stimulation) revealed variability in the duration of sustained CaMKII activity (Figure 1B, Figure S1A,B), raising the question of how multiple, noisy timers can trigger one-time events like sperm transfer and the abrupt change in motivational state. We quantified the reliability of the CaMKII signal as a timer using an information-theoretic approach (Shannon, 1948) drawing on our previously published green-Camuiα data (Thornquist et al., 2020) (Figure S1C–E). We found that measurements of CaMKII from individual Crz neurons cannot account for the reliability seen in the actual fly (Figure 1C, Figure S1D (Thornquist et al., 2020)). Averaging across 4 neurons, however, would allow an almost perfect inference as to whether a 6-minute interval has elapsed, especially if information in the network is exchanged rapidly (Figure 1D, Figure S1E). This analysis argues that sharing information across the Crz network would, at least theoretically, allow an estimate of elapsed time that reflects the remarkable accuracy observed in the male’s behavior.
One way to share information would be reciprocal excitation, as is suggested by the densely intertwined arborization and intermingled markers for dendritic and synaptic sites of the Crz neurons (Figure 1E). We performed a mosaic experiment, expressing the red-light gated cation channel CsChrimson (Klapoetke et al., 2014) in a random subset of the Crz neurons while imaging calcium dynamics in all four Crz neurons using GCaMP6s (Chen et al., 2013) (Figure 1F). In response to red light, neurons expressing CsChrimson showed the expected calcium elevations—but elevated calcium was also always seen in the Crz neurons that did not express CsChrimson (Figure 1F). These results do not address whether the connections between the Crz neurons are direct, but they demonstrate functional recurrence and suggest that each of the neurons can receive information about the activity of the others.
If recurrent excitation is important for the network to measure the 6-minute interval, impairing a subset of the neurons should disrupt the system. We generated mosaic animals in which 0,1,2,3, or all 4 of the Crz neurons were silenced in predictable proportions using the recombinase-based tool Coin-FLP (Bosch et al., 2015), which endows each neuron with a 50% probability of producing Gal4, and therefore expressing GtACR1 for light-gated silencing. If there were a single, special, Crz neuron that triggered the change in motivation, the probability of a long mating would be 50% (the probability of the special neuron expressing GtACR1); if any of the four neurons triggers the switch when its timer expires, long matings should only be seen when all four neurons are silenced (0.5 to the 4th power, or 6.25%). Similarly, if the system requires agreement between all neurons, only those flies in which no neurons are silenced would have normal copulation durations (also 6.25%). Instead we found long matings from 31.75% of Coin-FLP-GtACR1 males: 100 long matings out of 315 (Figure 1G). This is almost exactly the number predicted if silencing either three (25%) or all four (6.25%) Crz neurons always caused long matings, while silencing two or fewer never caused long matings (Figure 1G). This result suggests that no individual Crz neuron is required to produce the event, and that no individual neuron is sufficient to conclude the interval without a partner neuron. The Crz neurons therefore appear to share information not only for the accuracy of the timer, but for its ability to function.
That any two Crz neurons can work together to form a functional timer suggests that all four neurons have the capacity to signal the output. We found support for this idea by expressing CsChrimson in only a subset of Crz neurons while constitutively silencing all four with the leak potassium channel Kir2.1 (Baines et al., 2001). As long as at least one neuron expressed CsChrimson, sustained optogenetic stimulation could overcome electrical silencing and permit the flies to mate for a normal duration (Figure 1H). Any individual Crz neuron can, with sufficiently strong artificial stimulation, change the motivational state of the male, but during mating the network likely relies on recurrent excitation to induce the change. In this model, the output of the Crz network results from the formation of a consensus between at least two of the neurons, achieved by mutual excitation.
The Crz network uses cAMP to time its output
The Crz network requires ~60 seconds of electrical activity to throw the motivational switch once the CaMKII timers have run down (Thornquist et al., 2020) (Figure 2A). This can be seen by temporarily relieving inhibition after the CaMKII timers have run to completion (10 minutes) and then re-silencing the neurons for the remainder of the mating. If less than 50 seconds of electrical activity is allowed, the motivational switch is rarely thrown (as evidenced by long copulation durations), whereas if more than 75 seconds of voltage dynamics are allowed, the switch is almost always thrown and the mating will terminate ~18 minutes later (Figure 2B, Supplementary Video 1). Surprisingly, when one minute of inhibition separated two 50-second windows, males always terminated the mating on time (Figure 2C), even though each 50-sescond window would be insufficient on its own. This demonstrates that continuous activity is not required to throw the motivational switch and suggests the accumulation and storage of a biochemical signal within the network. The accumulated signal often survived even 3 minutes of intervening inhibition, but 10 minutes of inhibition completely erased the effect of the first window (Figure 2C). We conclude that depolarization of the Crz neurons drives the accumulation of a long-lasting, likely biochemical, signal that slowly degrades in the absence of electrical activity.
Figure 2: The Crz neurons require cAMP signaling to reach a consensus.

A) A voltage-dependent signal is required at the end (consensus period) of the CaMKII timer to induce the switch in motivational state.
B) Copulation duration of flies in which the Crz neurons are inhibited with ACR1 throughout mating except for a period of relief from inhibition. Providing windows of relief from inhibition after the CaMKII timers have expired shows that the Crz neurons require ~60–75 seconds of electrical activity to cause matings to terminate with normal, ~23 min durations. If relief is not provided, matings last much longer (>50 min).
C) Proportion of matings categorized as long when inhibition of the Crz neurons was imposed throughout copulation except for two 50 second periods, spaced apart by a variable period of inhibition.
D) Proportion of matings categorized as long after inhibition with a 30-second period of relief (x axis) or 90-second period of relief (y axis) across individual genotypes. A screen through 1,388 genetic manipulations of the Crz neurons (assayed as in Figure 2B) uncovered many hits in the cAMP signaling pathway. Colored dots indicate manipulations that are predicted to promote cAMP accumulation rut: rutabaga, an adenylyl cyclase; AC3: adenylyl cyclase 3; PDE4: a phosphodiesterase; KD: RNAi knockdown. Screen data available on request. Further characterization of hits in the screen is provided in Figure S2.
E) Proportion of matings categorized as long after inhibition with variable periods of relief during manipulations of Gαs activity in the Crz neurons (OE: overexpression).
F) Proportion of matings categorized as long after inhibition with variable periods of relief during manipulations of cAMP levels in the Crz neurons.
G) bPAC, a bacterial photoactivatable adenylyl cyclase, permits light-gated induction of cAMP signaling.
H) Optogenetic induction of cAMP synthesis in the Crz neurons causes isolated male flies to ejaculate.
I) bPAC-mediated cAMP synthesis is capable of prematurely inducing the switch in motivational state, as measured by termination in response to potentially lethal heat threats 5 minutes into mating.
J) Proportion of matings categorized as long after inhibition with variable periods of relief with optogenetic synthesis of cAMP using bPAC in the Crz neurons.
We screened 1,388 molecular manipulations directed to the Crz neurons (predominantly single gene RNAi knockdowns or expression of mutant Drosophila genes, with a focus on calcium-interacting proteins and signaling pathways) for the ability to either shorten or lengthen the necessary duration of the voltage-dependent window (Figure S2A,B). Of these, ~30 showed detectable changes, with many strong hits implicated in the synthesis, stability, and readout of cyclic adenosine-3’,5’-monophosphate (cAMP) (Figure 2D). cAMP, a nearly ubiquitous intracellular second messenger in animals, is synthesized from ATP by the action of adenylyl cyclase (which is often activated by the G protein subunit α subtype s (Gαs)), and is degraded by phosphodiesterases (Willoughby and Cooper, 2007). Genetic manipulations predicted to impede cAMP synthesis or enhance its degradation lengthened the voltage-dependent time window (Figures 2D–F) while those predicted to increase cAMP synthesis or impair its degradation decreased the time requirement (Figures 2D–F). cAMP signaling is therefore central to the mechanism that times the motivational switch.
To gain more precise control of cAMP dynamics we employed the photoactivatable adenylyl cyclase bPAC (Stierl et al., 2011) (Figure 2G). Activation of bPAC in the Crz neurons caused ejaculation in isolated males (Figure 2h) and was sufficient to hasten the decrease in the male’s motivation during mating (Crickmore and Vosshall, 2013; Thornquist et al., 2020) (Figure 2I), similar to the effects of thermo- or opto-genetic stimulation (Tayler et al., 2012; Thornquist et al., 2020). bPAC activation did not have evident behavioral consequences on another population of neurons known to drive behavior when stimulated (Figure S2C), demonstrating that neuronal activation is not a general consequence of bPAC stimulation. Constant electrical inhibition of the Crz neurons blocked the consequences of bPAC stimulation (Figure 2J, 0 sec of relief), showing that cAMP acts through a voltage-dependent process in the Crz neurons, rather than by directly promoting vesicle fusion. Allowing periods of relief from constant inhibition showed that stimulation of bPAC reduced the period required for consensus (Figure 2J), suggesting that synthetic cAMP production pools with endogenously generated cAMP to drive the switch in motivation that terminates matings on time.
cAMP activates PKA to drive voltage-gated calcium currents
A canonical function of cAMP is to activate protein kinase A (PKA) (Walsh et al., 1968), a tetramer with two regulatory subunits and two catalytic subunits (Figure 3A)(Kim et al., 2007). RNAi knockdown of the catalytic subunit PKA-C1 lengthened the voltage-dependent time requirement (Figure 3B, Figure S2B). More potently blocking PKA activation with PKA-R* (Li et al., 1995) (a regulatory subunit that cannot be activated by cAMP, and so acts as a dominant negative), lengthened the voltage requirement to the extent that the overall mating duration was increased, often by hours (Figure 3C). Like membrane voltage dynamics and the ability to inactivate CaMKII, PKA activity is therefore absolutely required for the Crz neurons to induce the switch in motivation required for appropriately timed mating termination (Thornquist et al., 2020). The dramatic extension of mating duration imposed by inhibiting PKA was overcome by optogenetic stimulation of the Crz neurons (Figure S3D), indicating that the neurons remain largely functional, aside from their inability to activate PKA (Figure S3C). Inversely, expression of a constitutively active PKA catalytic subunit (PKA-mC*; Figure 3D) (Li et al., 1995), but not a wild type or kinase dead version (Figure S3), dramatically reduced the duration of the post-CaMKII voltage requirement. These results suggest that PKA reads out cAMP levels to transform the sustained voltage dynamics of the Crz neurons into a discrete output.
Figure 3: PKA translates cAMP into electrical activity and network output.

A) Schematic showing PKA activation by cAMP.
B) Proportion of matings categorized as long after inhibition with variable periods of relief during knockdown of the PKA catalytic subunit PKA-C1 in the Crz neurons.
C) Copulation duration of mating flies with and without inhibition of PKA activity using PKA-R* in the Crz neurons.
D) Proportion of matings categorized as long after inhibition with variable periods of relief with expression of a constitutively active PKA catalytic subunit (PKA-mC*) in the Crz neurons.
E) Calcium responses to cAMP synthesis in the Crz neurons measured ex vivo using GCaMP6s. Optogenetic induction of cAMP synthesis using bPAC results in a massive increase in intracellular calcium levels that requires PKA activity (each trace indicates one neuron from separate flies).
F) Transmembrane calcium influx is required for the PKA/cAMP-mediated increase in intracellular calcium, as the GCaMP6s response is abolished by extracellular application of the Ca2+-channel blocker cadmium.
G) Voltage dynamics of the Crz neurons in response to bPAC stimulation. cAMP signaling depolarizes the Crz neurons, as indicated by the voltage sensor ASAP2s.
H) PKA-induced transmembrane calcium influx requires membrane depolarization, as it is blocked by expression of the leak K+ channel Kir2.1.
I) Proportion of matings categorized as long after inhibition with variable periods of relief during knockdown of the β subunit of the voltage-gated calcium channel.
J) Model illustrating how cAMP signaling drives consensus between the Crz neurons. Gαs-signaling activates adenylyl cyclases, resulting in cAMP synthesis. cAMP increases PKA activity, which induces calcium influx through voltage-gated calcium channels (VGCCs). Intracellular calcium elevation drives the Crz neurons to signal to each other.
To examine the relationship between cAMP, PKA and neuronal activity, we imaged calcium dynamics in the Crz neurons using GCaMP6s. Sustained stimulation of cAMP synthesis in the Crz neurons using bPAC resulted in extremely large elevations of intracellular calcium that were dependent on PKA activity (Figure 3E). This effect required influx through calcium channels in the cell membrane, as the response was eliminated by bath application of the calcium pore-blocker cadmium (Figure 3F). The voltage reporter ASAP2s (Chamberland et al., 2017) showed that bPAC stimulation depolarized the Crz neurons for a comparable duration as calcium influx, indicating that the elevation in calcium is due to a sustained current, not just slow clearance (Figure 3G).
Expressing Kir2.1 to hyperpolarize the Crz neurons blocked the change in intracellular calcium evoked by bPAC stimulation (Figure 3H), but did not prevent the activation of PKA as measured by the FRET-FLiM tool FLiM-AKAR (Chen et al., 2014) that we adapted for use in the fly (Figure S3E), arguing that electrical silencing does not prevent cAMP synthesis by bPAC, nor even its effect on PKA. The joint requirement of voltage dynamics and membrane calcium channels for cAMP-induced calcium elevation pointed to voltage-gated calcium channels (VGCCs) as mediators of the response to rising cAMP levels. Consistent with this model, knockdown of the Drosophila β subunit of the voltage-gated calcium channel complex (Ca-β) lengthened the accumulative window (Figure 3I). In mammals, voltage-gated calcium and cation channels are suspected to be modulated by PKA activity to enhance currents (Bunemann et al., 1999; Sang et al., 2016), and at least one putative PKA target site on Ca-β is conserved in flies (our observation). However, given the relatively modest effects of Ca-β knockdown, we think it likely that PKA targets multiple calcium conductances to drive the dramatic influx in calcium seen in response to high levels of cAMP signaling.
Multiple non-Crz neuronal populations showed no change in calcium levels in response to bPAC stimulation (Figure S2C–F), and the neurons that did respond had much weaker changes in calcium compared to the increase observed in the Crz neurons. The ability of cAMP to excite neurons through the Gαs-cAMP-PKA-VGCC pathway (Figure 3J) is therefore limited to specific cell types, and the remarkable potency of this pathway in the Crz neurons may underlie the all-or-nothing consequences for behavior and motivational state.
cAMP and recurrent dynamics synchronize an eruption of network activity
The behavioral outputs of the Crz network are discrete events (a motivational switch and sperm transfer), while the voltage-dependent period of cAMP accumulation appears continuous. We speculated that this system might employ an accumulate-to-threshold non-linearity, analogous to the action potential in single neurons, so we tested the consequences of driving incremental cAMP accumulation using weaker bPAC stimulation. A 500 ms pulse of blue light produced substantially weaker elevations in intracellular calcium (compared to a 5 second pulse) that returned to baseline within ~60 seconds (Figure 4A). cAMP, in contrast, remained elevated for over 100 seconds (Figure 4B), as measured using the cAMP reporter cADDisGreenDown (Tewson et al., 2016) (Figure S3F–J). cAMP-induced PKA activity measured with FLIM-AKAR lasted even longer (Figures 4C,D). These analyses do not account for potential differences in the kinetics of each sensor; while the impulse response of GCaMP6s decays in a few seconds (Chen et al., 2013) and FLIM-AKAR has been shown to return to baseline less than a minute after puffs of acetylcholine in hippocampal pyramidal neurons (Chen et al., 2017), the dynamics of cADDisGreenDown are less well studied. Despite this caveat, these data support the hypothesis that cAMP signaling accumulates during the consensus period to build toward the threshold necessary for the output of the Crz neurons.
Figure 4: cAMP accumulates within the Crz neurons to drive eruptions of activity.

A-D) Ex vivo measurements of fluorescent cAMP pathway reporters following acute bPAC stimulation. Brief optogenetic induction (a 500 ms pulse) of cAMP synthesis using bPAC elevates cAMP levels (B) and PKA activity (C) without dramatically changing intracellular calcium (A) (inset: zoomed in traces from the larger panel). The resultant elevation of cAMP signaling lasts longer than intracellular calcium (D). In panel (D), each individual trace was normalized to its maximum (going from 0 at onset to 1 at its peak) and then these normalized traces were averaged together.
E) Repeated stimulation of cAMP synthesis with bPAC every 100 seconds results in accumulation of intracellular cAMP. Residual cAMP and calcium are computed as the average value during the period 0.25 to 5 seconds preceding the next stimulation (i.e. 95–99.75 seconds after the most recent stimulation for 100 second intervals between each pulse).
F-G) Accumulation of cAMP signaling eventually results in a massive increase in intracellular calcium levels that we term an eruption. An individual neuron is presented in (F), while (G) shows the dynamics of several neurons, each from a separate fly.
Consistent with accumulation to a threshold, when 500 ms pulses of bPAC stimulation were applied every 100 seconds (allowing calcium levels to return to baseline) we observed steadily increasing cAMP levels over successive pulses (Figure 4E). Our measurements were often confounded by saturation of the cAMP sensor (Figure S3F), but accumulation was evident as lingering cAMP just before the next stimulation, when cAMP returns to values within the sensor’s dynamic range (residual cAMP, Figure 4E). Calcium levels responded to this stimulation protocol dramatically differently: roughly every 3rd to 5th pulse triggered what we call an eruption, with massive ΔF/F values approaching the limit of what can be reported by GCaMP6s, and which were sustained for nearly a minute (Figures 4F,G, Supplementary Video 2). Eruptions do not result from cell death, as many could be evoked per cell, almost always after several intervening light pulses, and were always of comparable magnitude (Figure 4G, Figure S4A). Eruptions were elicited with fewer pulses if the pulses were closer together in time and became very infrequent when separated by several minutes (Figure S4B), arguing for an accumulative phenomenon with a slow leak on timescales resembling the behavioral dynamics in our voltage-window experiments. If eruptions were stochastic, on the other hand, we would expect the tendency to erupt to be the same whether pulses were very frequent or very infrequent. To directly examine the relationship between eruptions and cAMP changes, we performed two-color imaging with the red cAMP sensor cADDisRedUp and GCaMP6s. We observed ramping of post-stimulation residual cAMP leading up to the eruption (Figures S4C,D). This supports the idea that eruptions result from the accumulation of cAMP itself, likely in association with the accumulation of downstream signaling events.
Thresholds, such as those triggering nuclear reactions and action potentials, can emerge from positive feedback loops if multiple components of a system drive one another until self-sustaining criticality is achieved (Groschner et al., 2018; Izhikevich, 2007; Sepulchre et al., 2019). To look for evidence of such a phenomenon, we first checked whether electrical stimulation of the Crz neurons could increase cAMP levels. Optogenetic excitation of the Crz neurons using CsChrimson decreased fluorescence of cADDisGreenDown (Tewson et al., 2016), reflecting elevated cAMP concentration (Figure 5A). These elevations in cAMP levels lasted for tens of seconds, much longer than the calcium response to the same stimulation (Figure S5). Repeated bouts of electrical stimulation caused a gradual accumulation of intracellular caMp (Figure 5A). While we do not know exactly how electrical activity of the Crz neurons elevates cAMP, potential pathways may include rutabaga, a calcium-sensitive adenylyl cyclase (Fagan et al., 2000; Livingstone et al., 1984; Willoughby and Cooper, 2007) (Figure 2D), or intranetwork Gαs mediated activation of adenylyl cyclases. Since the Crz neurons are mutually excitatory, activity in one Crz neuron elevates cAMP in the others, driving further network activity and forming a positive feedback loop. Though eruptions were most effectively evoked by bPAC activation, eruption-like events could sometimes be driven by direct optogenetic depolarization (Figure S5), again consistent with the idea that eruptions are the result of positive feedback between electrical activity and cAMP signaling.
Figure 5: Eruptions are synchronous across the Crz neuron network.

A) Increases in intracellular cAMP in response to electrical stimulation, as indicated with caDDisGreen-Down.
B,C) Simultaneous measurement of calcium activity of all Crz neurons during optogenetic induction of cAMP synthesis. Eruptions are synchronous across all Crz neurons (for details on the estimation of mutual information, see Figure S4).
D-F) Top row: 500ms pulses of bPAC activation every 100 seconds results in an eruption approximately every fourth pulse on average (D). Knockdown of Gαs within the Crz neurons (E), or of the active zone protein Unc13 (F), prevents eruptions. Bottom row: Prolonged bPAC activation (5 s) can induce eruption-like increases in calcium even when Unc13 and Gαs are knocked-down.
G) Likelihood of an individual 500 ms pulse of blue light eliciting an eruption (top) and the size of eruptions evoked by a 5 s pulse of blue light (bottom). Knockdown of Unc13 and Gαs nearly abolish accumulation eruptions (top row), and reduce the magnitude of induced eruptions from sustained bPAC stimulation (bottom row).
H) Model for a positive feedback loop between cAMP and electrical activity that concludes with an eruption.
Positive feedback through recurrence suggests synchronization of eruptions across the Crz network, so we were not surprised to find that eruptions in one neuron were a near perfect predictor of eruptions in the other Crz neurons (Figures 5B,C, Figure S4E, Supplementary Video 3). This synchronization likely corresponds to the end of the consensus period after the CaMKII timer and drives the motivational and behavioral responses. To show that eruptions and synchrony were products of recurrent excitation and cAMP synthesis, we stimulated bPAC while depleting genes required for positive feedback from the Crz neurons. RNAi-mediated knockdown of Gαs (Figure 5E) (which would prevent recurrence-mediated cAMP synthesis) or essential active zone machinery (Unc13 (Dittman and Ryan, 2019)) (Figure 5F) blocked eruptions that would otherwise be evoked by repeated bPAC stimulation (Figure 5D). Eruption-like events could still be elicited in these configurations by sustained stimulation of bPAC (Figure 5D–G), though often with a smaller response (likely due to impaired recurrence) showing that the neurons remain intact and capable of cAMP-induced excitation. These results together suggest that the eruption is a recurrence-driven network-scale phenomenon.
The Crz neurons are peptidergic, and neuropeptides often require sustained elevations in calcium before release (Bospoort et al., 2012; Fulop et al., 2005; Shakiryanova et al., 2005). Our screen (Figure 2E, Figure S2A,B) was unable to identify any particular transmitter released by the Crz neurons to signal the eruption, but many peptidergic neurons exert their effects through multiple neurotransmitters (van den Pol, 2012), raising the possibility of redundancy. Regardless of the identity of the output signal(s), thresholded eruptions likely ensure that the Crz neurons only signal to downstream neurons when the network has reached a consensus, with an unambiguous event that coordinates behavior and motivational state (Figure 5H).
CaMKII delays cAMP-triggered eruptions
The above experiments, together with our earlier demonstration that CaMKII is active for the first several minutes of mating (Thornquist et al., 2020), suggest that CaMKII might time the motivational switch and sperm transfer by delaying cAMP-triggered eruptions. In this model, CaMKII activity serves as a neuron-specific estimation of elapsed time while cAMP signaling reflects network-averaged evidence. Neurons with fast CaMKII timers would push the system toward criticality, while neurons whose CaMKII levels remain high delay the output. The network eventually reaches a consensus when the declining CaMKII inhibition can no longer hold back an eruption.
A 90 second voltage window is always sufficient to throw the motivational switch when administered at 10 minutes into mating (or any time after the CaMKII timers have run down). However, even 120 seconds of electrical activity are never sufficient when commenced after only 1 minute of mating, when the CaMKII timers are still highly active (Figure 6A). Even the addition of bPAC stimulation had little impact on the ability of voltage windows to allow the motivational switch to be thrown early in mating (Figure 6B), suggesting a profound suppression of cAMP signaling by active CaMKII. Artificially elevating CaMKII activity by expression of a constitutively active mutant (CaMKII-T287D) dramatically weakened the behavioral effects of stimulating cAMP synthesis with bPAC, often preventing even tens of seconds of bPAC stimulation from driving the downstream effects (Figure 6C). The ability of electrical stimulation to throw the motivational switch, on the other hand, is relatively unimpaired by expression of CaMKII-T287D (Thornquist et al., 2020), further suggesting that CaMKII delays the switch by preventing the accumulation of cAMP signaling, rather than directly preventing electrical activity.
Figure 6: CaMKII delays the eruption by preventing PKA activation.

A) Proportion of matings categorized as long after inhibition with variable periods of relief either 1 minute or 10 minutes into mating.
B) Proportion of matings categorized as long after inhibition of the Crz neurons with 40 seconds of relief either 1 minute or 10 minutes into mating, supplemented by 40 seconds of stimulation of bPAC using blue light just before relief.
C) Proportion of matings categorized as long after stimulation of bPAC in the presence of CaMKII-T287D.
D) Measurement of cAMP levels with and without CaMKII-T287D in response to optogenetic stimulation of bPAC.
E) Measurement of PKA activity with and without CaMKII-T287D in response to optogenetic stimulation of bPAC.
F) Measurement of calcium levels with and without CaMKII-T287D in response to optogenetic stimulation of bPAC.
G) Schematic showing how CaMKII delays the eruption by preventing network-activity-driven cAMP accumulation.
We noticed during earlier experiments that the fluorescence lifetime of cADDisGreen-Down changes alongside fluorescence when the sensor binds cAMP (Figure S6E). Fluorescence lifetime imaging permits absolute measurements of cAMP levels, instead of the relative changes reported by measuring ΔF/F, since it measures an intrinsic property of individual molecules (Yellen and Mongeon, 2015). We switched to fluorescence lifetime imaging to compare cAMP concentration across flies. The addition of CaMKII-T287D to maintain elevated CaMKII activity dramatically increased the fluorescence lifetime of cADDis-Green-Down (Figure 6D), indicating reduced baseline cAMP levels. CaMKII-T287D did not prevent cAMP synthesis by bPAC, but even the maximal level of cAMP achieved after intense stimulation was lower than the baseline levels seen in flies not expressing CaMKII-T287D (Figure 6D). This result suggests that active CaMKII prevents cAMP from accumulating to the threshold necessary for PKA activity to generate an eruption. In a striking confirmation of this idea, CaMKII-T287D completely abolished bPAC-mediated activation of PKA (Figure 6E), providing a mechanistic explanation for the delayed progression towards an eruption while CaMKII remains active for the first several minutes of mating. At the level of calcium dynamics, we found that imposing high levels of CaMKII activity with the T287D mutation blocked eruptions, even when provoked by strong bPAC stimulation (Figure 6F). This block on eruptions was released by addition of the pharmacological CaMKII inhibitor KN93 (Figure 6F, Figure S6A). These results reveal the mechanism through which the slow decay of CaMKII serves as an interval timer: preventing the accumulation of cAMP signaling from achieving the threshold necessary to report the conclusion of the interval (Figure 6G). While we do not know the specific molecular details linking CaMKII activity to degradation of cAMP, it may act through the phosphodiesterase PDE4 (dunce), whose cleavage of cAMP has been reported to be sensitive to the activity of CaMKII (Mika et al., 2015).
The Crz neurons can accumulate evidence over a wide range of timescales
Evidence accumulation is a broad framework that can describe many systems, unified by the idea of tracking positive and negative inputs over time. Little is understood about the underlying mechanisms, especially on timescales longer than a few seconds. The fact that mating terminates ~18 minutes after an eruption allows us to use the overall duration of a mating to infer the time at which the network reached a consensus (Figure 7A, see Methods). To explore the potential usefulness of this system across modes of evidence accumulation we inhibited the Crz neurons until 10 minutes into mating and then imposed repeated cycles of optogenetic inhibition (negative input) and relief (positive input) (Figures 7B). Adjusting the durations of relief and inhibition produced a wide range of copulation lengths, from relatively normal (~24 minutes) to those lasting many hours. Each cycling inhibition/relief protocol gave a consistently timed output, with more consolidated voltage windows causing earlier eruptions and consequent termination times (Figure 7C). Most strikingly, these experiments revealed considerable linearity in the decay of information over time: four seconds of inhibition effectively erased one second of electrical activity across all conditions, even those in which it took over an hour before the network reached consensus (Figure 7D).
Figure 7: cAMP signaling can track arbitrarily-patterned evidence over a range of timescales.

A) The latency to terminate mating after an eruption was modeled as a Gaussian random variable. In this instance the Crz neurons were optogenetically inhibited for the first 10 minutes of mating, leading to a presumed eruption at 11 minutes, and a distribution of termination times centered on 29 minutes, with the posterior distributions of the fit parameters plotted in red and blue. Similar ~18 min delays were seen with various durations of inhibition.
B) Flies expressing GtACR1 were exposed to 10 minutes of inhibition followed by cycling bouts of inhibition (pulse width) and permitted activity (window length), varying both parameters.
C) Top row: Individual copulation durations of flies subjected to a fixed window length (indicated at top) and a variety of durations of pulsed inhibition. Longer inhibitory pulses widths always corresponded to a lengthened copulation duration, while increasing the relaxation window length for a fixed pulse width resulted in an earlier termination of mating. Bottom row: Inferred probability distribution for the cumulative electrical activity before an eruption in each condition by using the Gaussian model fit in Figure 7A. Longer copulation durations correspond to a later inferred eruption (see Methods).
D) Left: For each window length, the cumulative activity required to trigger an eruption increased linearly with pulse width.
Middle: Plotting the relationship between total time inhibited and total time active shows a fixed relationship across conditions, with a slope of ~¼ – one second of electrical activity negates four seconds of inhibition, regardless of the history of inhibition.
Right: The constant of proportionality (~¼) between activity and inhibition is the same regardless of inhibition paradigm.
E) Left: optogenetic inhibition was patterned by drawing sequential durations of inhibition and relieved inhibition from an exponential distribution. The mean duration of each pulse of inhibition was specified, as was the average fraction of the time the light was on, but otherwise each pulse was randomized. The randomized phases of inhibition were sustained throughout the mating.
Middle: Using only the 1:4 rule derived in Figure 7D, we estimated how long a perfect integrator would need to reach a threshold equivalent to 75 seconds of unimpeded electrical activity (red line). When the fraction of the time the neurons are silenced exceeds 80% (i.e. there is at least 4 times as much inhibition as permitted activity), the integrator struggles to reach the threshold, though the increased variance with increasing pulse width means that for long pulse durations the system can still occasionally reach threshold.
Right: Actual copulation duration data (circles) compared to the prediction of the integrator model (violin plots). The model predicts the distribution of copulation durations well, including the possibility of triggering an eruption even with the neurons silenced 85% of the time when the pulse width was long.
If the accumulation and decay of information are linear, the exact pattern of activation and inhibition should not matter, only the predictable time at which the threshold is crossed. To test this idea, we imposed patterned stimuli with programmed averages but otherwise stochastic durations of positive (lights off) and negative (lights on) inputs (Figure 7E, Figure S7). Using the 1:4 rule (1 second of activity is erased by 4 seconds of inhibition) from the preceding experiments, we could predict the distribution of copulation durations across a wide variety of pulse widths and relative amounts of positive and negative inputs (Figure 7E, Figure S7). The extreme flexibility of inputs and reliable outputs seen in these experiments suggest that the excitation-cAMP-PKA-VGCC-eruption pathway may be used to track, store, and report information relevant to a variety of behavioral, motivational, and cognitive outputs.
DISCUSSION
Time, evidence, and long-timescale computation
Decisions and behavioral control are thought to arise from long-lasting composite dynamics of neuronal networks (Inagaki et al., 2019; Mante et al., 2013; Runyan et al., 2017; Shadlen and Newsome, 2001; Waskom and Kiani, 2018), such as the seconds-long ramping of firing rates observed in premotor centers (Churchland et al., 2010; Li et al., 2015). We provide mechanisms for the accumulation and storage of network information over much longer timescales, as well as insight into a thresholding mechanism for reporting the outcome. Here the information is a spatially distributed estimate of elapsed time that emerges from interwoven biochemical and electrical processes. Cell intrinsic evidence is read out within each neuron from the immediate activity of CaMKII, and network-level information is received from the electrical activity of other Crz neurons. The common currency is cAMP signaling, which accumulates intracellularly at the level of cAMP itself, PKA activity, and/or the accumulation of phosphate groups on PKA’s targets. A stark thresholding operation transforms the graded and distributed representation of evidence into a binary decision variable: the presence or absence of a network-wide eruption.
Eruption-like mechanisms seem well suited for diverse long-timescale computations. Linearity of evidence accumulation and dissipation allows undistorted evaluation, whether the system is near or far from its threshold. The magnitude of network activation distinguishes the information-gathering phase from the decisive output, allowing evidence to accumulate without triggering the downstream consequences. The accumulated signal persists even in the total absence of electrical input, enabling activity-silent memory (Stokes, 2015) that imparts the system with a history dependence that could not be discerned from purely electrophysiological measurements.
Though we know of no previous description of anything closely resembling an eruption in the nervous system, islets of pancreatic β cells synchronize their activity to coordinate insulin release using a similar positive feedback loop between electrical activity and cAMP signaling (Rorsman and Ashcroft, 2018; Tenner et al., 2020). In the brain, much of cortex has been hypothesized to operate at near-criticality, giving rise to brief but expansive neural avalanches (Chialvo, 2010). Early in cortical development, nascent neuronal networks exhibit spontaneous, network-wide synchronous activation driven by positive feedback that is sustained for tens of seconds (Allène et al., 2008; Duan et al., 2020). Neurons in primate lateral intraparietal cortex show trial-averaged ramping responses during decision making tasks (Roitman and Shadlen, 2002; Shadlen and Newsome, 2001), but closer inspection shows that individual neurons jump to high activity rates as evidence accumulates (Latimer et al., 2015; Zylberberg and Shadlen, 2016). On much longer timescales, neurons in the mammalian suprachiasmatic nucleus (SCN) undergo 10-fold changes in activity depending on time of day (Hastings et al., 2018). In the SCN, each neuron expresses a cell-intrinsic representation of time of day (encoded by levels of circadian clock proteins), but, as in the Crz neurons, the reliability of behavior is a network output that is much greater than would be expected from its individual oscillators (Herzog et al., 2004).
Defining the eruption and searching for others
We propose to define an eruption as a thresholded jump in recurrent network activity, triggering downstream processes that had been blind to intra-network computations. The eruption can be highly localized, as in the four-cell network studied here, and so may have escaped detection by the population-level dimensionality reduction techniques employed by most modern studies of neuronal decision-making. Even in approaches that focus on individual cells, it is usually difficult or impossible to identify the network in which a given neuron functions. For example, the step changes in cortical spike rates observed during decision-making in primates (Latimer et al., 2015) might indicate participation in an erupting network or reflect the enduring consequences of an upstream eruption.
Whether in existing data sets or from new experimental designs, we believe eruptions are worth searching for. They might help explain the transformation of continuous brain activity into our discretized actions and experience and would therefore change our thinking about emergent brain properties. Here we find that profound behavioral and motivational changes emerge from the interplay of population dynamics with molecular processing in a remarkably small group of cells. We therefore argue that presuming neurons to be simple processing elements underestimates their computational power. We believe that the computational capacity of individual neurons stems as much from their rich intracellular signaling pathways as from their interconnectedness, especially for computations in the regime of cellular supremacy, where biomolecular computations are proposed to be more efficient than implementations in the classical von Neumann and Turing frameworks (Grozinger et al., 2019). We are confident that studying the molecular/electrical interface in relatively simple systems like the Crz network will provide still more guiding principles for linking the operations of neurons to our thoughts, emotions, percepts, and actions.
Limitations
A major limitation of studying the Corazonin eruption has been our inability to monitor neuronal activity during mating. Nevertheless, the close fidelity between manipulations that alter the eruption in behaving animals and in our ex vivo imaging preparation has allowed us to lay out the general structure of the Corazonin eruption. Still, many details remain unclear or are difficult to fully address with our data. Most prominent is the multifaceted role of calcium in our model. Calcium first activates the CaMKII timer, then drives the pre-eruption accumulation of cAMP, and finally a massive calcium influx essentially is the eruption. But we have some clues as to how calcium could manage these diverse functions. Sub-cellular compartmentalization may explain some of this multifunctionality: the activation of CaMKII is voltage-independent (Thornquist et al., 2020), whereas the eruption acts through voltage-gated calcium channels. Unlike the calcium-conducting ChR2-XXM, stimulation of the Crz neurons with the non-calcium conducting channel CsChrimson fails to activate CaMKII (Thornquist et al., 2020), further supporting the notion that voltage-gated calcium channels cannot activate CaMKII in this system. So what does initiate the CaMKII timer? The most promising candidate may be release of calcium from intracellular stores. The molecular screen presented here did not turn up hits in endoplasmic-reticular or mitochondrial calcium channels (Figure 2D) (or in the ~2/3 of the annotated GPCRs that were tested), but the screen will have missed manipulations that reduce CaMKII activation, as a premature eruption will not affect copulation duration (Tayler et al., 2012; Thornquist et al., 2020). Our more directed explorations of the onset of the timer have so far failed to yield any clear leads, either due limitations in our tools or in our hypotheses.
Like action potentials in individual neurons, the system described here resets after an eruption. We do not fully understand this either, though it may involve re-activation of CaMKII: elevation of intracellular calcium following strong bPAC stimulation activates CaMKII (Figure S6B), while inhibiting CaMKII results in a high frequency of successive eruptions (Figure S6C). A possible mechanism for CaMKII’s ability to both delay and reset the eruption is indicated by work in mammalian cardiomyocytes, where CaMKII phosphorylates and activates phosphodiesterase 4D (PDE4; Mika et al., 2015), which degrades cAMP. In the Crz neurons, RNAi knockdown of the PDE4 homolog dunce shortens the duration of the voltage requirement (Figure 2F), activation of CaMKII dramatically reduces baseline cAMP levels (Figure 6D), and a potential CaMKII phosphorylation site on PDE4 (Mika and Conti, 2016) seems to be conserved on dunce (our observation). However, it would not be surprising if CaMKII acts at multiple levels to inhibit cAMP signaling (though without strongly affecting baseline membrane voltage (Thornquist et al., 2020)).
When CaMKII activity is low, cAMP activates PKA to drive the eruption, but what exactly does PKA do? In mammals, PKA is known to potentiate calcium influx through multiple calcium channels (Sang et al., 2016; Skeberdis et al., 2006; Wang and Sieburth, 2013), suggesting a straightforward mechanism for driving the eruption that concludes the timer. But other hits in our screen (Figure S2A,B) do not fit neatly into this pathway, suggesting further complexity and surprises upon deeper investigation.
Finally, what is the signal that is released by an eruption and how does it impact downstream neurons? The output signal is likely different than the (also unknown) signal(s) and receptor(s) used for intra-network recurrent excitation, and could consist of one or more neuropeptides, since they often require sustained excitation for release (Bospoort et al., 2012; Matsuda et al., 2009). Our screens so far have only identified Unc13, a component of vesicle release machinery for both classical neurotransmitters and neuropeptides (Bospoort et al., 2012; Südhof, 2012). The immediate downstream targets of the Crz neurons are also unknown, but ultimately the eruption drives the transfer of sperm and seminal fluid through activation of a set of serotonergic neurons (Lee et al., 2001; Tayler et al., 2012) and adjusts the properties of drive integrating neurons that control the immediate responsiveness of the male to challenges that arise during mating (Thornquist and Crickmore, 2020).
STAR METHODS
RESOURCE AVAILABILITY
Lead Contact
Further information and requests for resources and reagents should be directed to and will be fulfilled by the Lead Contact, Michael Crickmore (michael.crickmore@childrens.harvard.edu).
Materials availability
This study generated the fly lines containing UAS-FLIM-AKAR and LexAop2-GtACR1-eYFP. These reagents are available upon request.
Data and Code Availability
Raw data for the screen in Figure 2D is available upon request. Imaging data is hosted by Mendeley Data at https://dx.doi.org/10.17632/tp7t58xjbp.1.
All code used in analyses is available at https://github.com/CrickmoreRoguljaLabs/cAMPCode, and code used for controlling the behavior hardware is available at https://github.com/CrickmoreRoguliaLabs/RaspberryPiControl.
EXPERIMENTAL MODEL AND SUBJECT DETAILS
Fly stocks
Flies were maintained on conventional cornmeal-agar-molasses medium under 12-hour light/12-hour dark cycles at 25 °C. Unless otherwise stated, males were collected 0–8 days after eclosion and group-housed away from females for at least 3 days before testing. Flies expressing CsChrimson, GtACR1 and all experimental controls for experiments involving CsChrimson or GtACR1 were housed with rehydrated potato food (Carolina Bio Supply Formula 4–24 Instant Drosophila Medium, Blue) coated with all-trans-retinal (Sigma Aldrich R2500) diluted to 50 mM in ethanol for at least 3 days, unless marked as “no retinal.” These vials were kept inside aluminum foil sheaths or 3D-printed plastic cases to prevent degradation of the retinal due to light exposure. Virgin females used as partners for copulation assays were generated by heat-shocking a UAS-CsChrimson-mVenus stock (Bloomington stock #55135) with a hs-hid transgene integrated on the Y-chromosome in a 37 °C water bath for 90 minutes. This stock was selected for mating partners because the females are highly receptive to courtship, resulting in a large number of mating pairs shortly after initiation of assays, and because it has been shown that copulation duration is robust to variations in the female’s genetic background (MacBean and Parsons, 1967). Virgins were group-housed for 3–13 days before use. Experiments with optogenetic tools were not performed at specific times relative to the light-dark cycle of the incubator because these animals were housed in constant dark conditions for at least a day prior to the assay to preserve all-trans-retinal integrity. We did not observe any dependency of time of day on any of the behaviors described here. Detailed genotypes of all strains used in the paper are listed in Supplementary Table 2.
METHOD DETAILS
Evaluation of mating
A pair of flies was scored as “mating” when they adopted a stereotyped mating posture for at least 30 seconds. This posture consists of the male mounting the female and propping himself up on her abdomen using his forelegs, while curling his own abdomen and keeping the genitalia in contact. The posture is starkly different from anything exhibited during other naturalistic behaviors and is rarely, if ever, sustained for 30 seconds during unsuccessful attempts to initiate a mating. If the flies are physically pulled apart without disengaging the genitalia (such as if the female falls or if they collide with an obstacle), the male is able to climb back into place. This posture is also maintained in the presence of threats, unless the male elects to terminate the mating, differentiating it from a “stuck” phenotype. When stuck, the male dismounts the female, orients himself away from her, and attempts to walk away, but cannot decouple their genitalia. In the rare cases when we see a male become stuck in response to a threat, we record the copulation as having terminated. Occasionally in extremely long (>1hr) mating males, the male will become stuck, possibly because the seminal fluids harden and adhere the flies together. In this case too, the onset of the stuck posture is scored as the end of mating.
Optogenetic stimulation during behavior
Non-screen experiments:
For CsChrimson experiments: One male and one virgin female fly were placed in each of .86” diameter 1/8” thick acrylic wells sitting 4” above 655 nm LEDs (Luxeon Rebel, Deep Red, LXM3-PD01–0350) driven using 700 mA constant current drivers (LuxDrive BuckPuck, 03021-D-E-700) and passed through frosted collimating optics (Carclo #10124). This spot of light was scattered using a thin diffuser film (Inventables, 23114–01) under the wells to ensure a uniform light intensity of ~0.1 mW/mm2. The LEDs were controlled using an Arduino Mega2560 (Adafruit) running a custom script, which itself was controlled by a Raspberry Pi (either 2 or 3, running Raspbian, a Debian variant). Flies were observed by recording from above using the Raspberry Pi with a Raspberry Pi NoIR camera (Adafruit) and infrared illumination from below using IR LED arrays (Crazy Cart 48-LED CCTV Ir Infrared Night Vision Illuminator reflected off the bottom of the box) while streaming the video to a computer for observation.
For ACR experiments: The set-up was as above except using the green Luxeon Rebel, LXML-PM01–0100, and a pulse-width modulated signal to set the time-average intensity of the light to ~5 μW/mm2 (approximately six times brighter than the ambient light) unless otherwise noted.
For bPAC experiments: The set-up was as above, but additionally included a blue (470 nm) Luxeon Rebel (LXML-PB01–0040) with an average intensity within the well of ~0.25 mW/mm2. The LEDs were arranged in a “3-UP” configuration (LEDSupply) and light was passed through a frosted collimating lens (Carclo 10511).
During the screen:
Individual pairs of males and females were placed in single wells of 32 well arenas (see Thornquist et al. (Thornquist et al., 2020)) recorded from a height of ~9” using a Canon camera (VIXIA HF R600). Arenas were illuminated from below using a diffuse white light source (Artograph LightPad 930 LX) with a nominal illuminance of ~5000 lux. The light pads were controlled with an Arduino ATMEGA2560 running custom Arduino code available at https://www.github.com/CrickmoreRoguljaLabs/.
Heat threat experiments
Heat threat experiments were performed as in (Thornquist et al., 2020):
A similar device to the one described above was constructed, with the addition of a ¼” thick water bath underneath each well. Room temperature water was continually passed through this bath, except when heat threat manipulations occurred, when water of the temperature described in each experiment was used (controlled by a separate stopcock for each well). The LEDs above were driven with 1A BuckPucks controlled by a pulse-width modulated signal selected to ensure the average intensity of illumination is the same as in the other behavioral experiments (~0.1 mW/mm2 for red light, ~ 5 μW/mm2 for green, 0.25 mW/mm2 for blue) despite having to pass through the water
Imaging and FLIM
Images were acquired using a modified Thorlabs Bergamo II. Samples were excited using a Coherent Chameleon Vision II Ti:Sapphire laser emitting a 920 (GCaMP6s, green-Camuiα, and FLIM-AKAR) or 1000 (cADDisRed-Up, cADDisGreen-Down, and experiments performing multi-color imaging) nm beam and emission was detected using cooled Hamamatsu H7422P-40 GaAsP photomultiplier tubes, with light collected through a 16x water immersion objective (Olympus). The PMT signal was amplified using Becker-Hickl fast PMT amplifiers (HFAC-26) and passed to a PicoQuant TimeHarp 260 photon counting board, which was synchronized to the laser emission by a photodiode (Thorlabs DET110A2) inverted using a fast inverter (Becker-Hickl A-PPI-D). The TimeHarp signal was acquired by custom software (FLIMage, Florida Lifetime Imaging) which was also used to control the microscope. For intensity imaging, all detected photons within a pixel were summed together, regardless of arrival time relative to the excitation pulse. Optogenetic stimulation was performed by excitation with a blue LED (Thorlabs M470L4) through a liquid light guide (Thorlabs LLG5–8H) for an incident intensity at the sample of ~XXX. 128×128 pixel images were acquired at a rate of ~4 Hz.
Dissections:
Flies used in imaging experiments were dissected in chilled saline (103 mM NaCl, 3 mM KCl, 5 mM TES, 8 mM trehalose, 10 mM glucose, 26 mM NaHCO3, 1 mM NaH2PO4, 3 mM MgCl2, 1.5 mM CaCl2, pH ~7.25, 270–275 mOsm), as in our previous work (Thornquist et al., 2020). The same saline solution was used during imaging experiments.
Antibodies and immunohistochemistry
All samples were fixed in PBS with Triton X-100 and 4% paraformaldehyde for 20 minutes, then washed three times with PBS/Triton X-100 for 20 minutes each before application of antibodies. All samples were incubated with the primary antibody for two days, washed three times with PBS/ITriton X-100 for 20 minutes each, incubated with the secondary antibody for two days, then washed three times as before and mounted on coverslips using VectaShield (Vector Labs). Antibodies used are in the Key Resources Table.
KEY RESOURCES TABLE.
| REAGENT or RESOURCE | SOURCE | IDENTIFIER |
|---|---|---|
| Antibodies | ||
| Rabbit anti-GFP | Invitrogen | A-11122 |
| Chicken anti-GFP | Aves Labs | GFP-1010 |
| Mouse anti-GFP | Invitrogen | A11120 |
| Rabbit anti-DsRed | Clontech | 632496 |
| Mouse anti-nc82 | Developmental Studies Hybridoma Bank | Nc82 |
| Donkey anti-chicken 488 | Jackson ImmunoResearch | 703–545-155 |
| Donkey anti-rabbit 488 | Invitrogen | A11008 |
| Donkey anti-mouse 488 | Invitrogen | A21202 |
| Donkey anti-rabbit 555 | Invitrogen | A-31572 |
| Donkey anti-mouse Cy3 | Jackson ImmunoResearch | 715–166-150 |
| Donkey anti-rabbit 647 | Jackson ImmunoResearch | 711–605-152 |
| Donkey anti-mouse 647 | Jackson ImmunoResearch | 711–605-151 |
| Deposited Data | ||
| All imaging data | This paper | http://dx.doi.org/10.17632/tp7t58xjbp.1 |
| Experimental Models: Organisms/Strains | ||
| Crz-Gal4 | Bloomington Stock Center | BDSC 51976 |
| UAS-GtACR1-eYFP | Adam Claridge-Chang lab | N/A |
| UAS-green-Camuiα | Michael Crickmore lab | N/A |
| UAS-ChR2-XXM | Robert Kittel lab | N/A |
| UAS-Syt-eGFP | Bloomington Stock Center | BDSC 6926 |
| UAS-DenMark | Bloomington Stock Center | BDSC 33061 |
| Repo-Gal80 | Tzumin Lee lab | N/A |
| Hs-FLP | BDSC 62118 | Hs-FLP |
| UAS-FRT-STOP-FRT-CsChrimson-tdTomato | David Anderson lab | N/A |
| GCaMP6s | David Anderson lab | N/A |
| Coin-FLP | Bloomington Stock Center | BDSC 58750 |
| LexAop-FLP | Bloomington Stock Center | BDSC 55819 |
| Crz-LexA | Michael Crickmore lab | N/A |
| LexAop2-GtACR1-eYFP | Michael Crickmore lab | N/A |
| UAS-Kir2.1-eGFP | Bloomington Stock Center | BDSC 6595 |
| UAS-Dicer2 | Bloomington Stock Center | BDSC 24646 |
| RNAi and overexpression in Figure 2D | BDSC and VDRC (stock numbers available upon request) | N/A |
| UAS-Gαs-RNAi | Bloomington Stock Center | BDSC 50704 |
| UAS-Gαs-OE | Bloomington Stock Center | BDSC 6489 |
| UAS-PDE4-RNAi | Bloomington Stock Center | BDSC 27250 |
| UAS-AC3-OE | Bloomington Stock Center | BDSC 68221 |
| UAS-bPAC | Robert Kittel lab | N/A |
| UAS-PKA-C1-RNAi | Bloomington Stock Center | BDSC 31277 |
| UAS-PKA-R* | Bloomington Stock Center | BDSC 35550 |
| UAS-PKA-mC* | Daniel Kalderon lab | N/A |
| UAS-ASAP2s | Bloomington Stock Center | BDSC 76247 |
| UAS-Ca-β-RNAi | Vienna Drosophila Resource Center | VDRC 105748 |
| UAS-FLIM-AKAR | Michael Crickmore lab | N/A |
| UAS-cADDis-Green-Down | Vanessa Ruta lab | N/A |
| UAS-cADDis-Red-Up | Vanessa Ruta lab | N/A |
| Software and Algorithms | ||
| Custom Python 2.7 and MATLAB code | This paper | https://github.com/CrickmoreRoguljaLabs/cAMPCode |
| Other | ||
| Potato food | Carolina Bio Supply | 173200 |
| Phosphate buffered saline (10x) | MediaTech | 46–013-CM |
| Raspberry Pi 3 Model B+ | Raspberry Pi Foundation | N/A |
| Arduino ATMEGA2560 | Arduino | MEGA2560 REV 3 |
| LEDs | Luxeon Rebels | LXM3-PD01–0350, LXML-PM01–0100, LXML-PD01–040 |
| Light Pads | Artograph | LightPad 930 LX |
Confocal microscopy
Confocal images were collected using a Zeiss LSM 710 through a 20x air objective (Olympus PLAN-APOCHROMAT) controlled by Zen software, and analyzed using ImageJ.
Generation of transgenic flies
UAS-FLIM-AKAR flies were generated by amplifying the gene out of the AAV-FLIM-AKAR construct Addgene #63058 using the primers GCGGCCGCGGCTCGAGatggtgagcaagggcgaggagct and ACAAAGATCCTCTAGAttactcgatgttgtgcctgattttgaagttgac. This was then cloned into a linearized 20xUAS-IVS-mCD8::GFP (Addgene #26220) (digested with XhoI and XbaI) using InFusion and injected into attP2 and attP40 by BestGene, Inc.
LexAop2-GtACR1-eYFP was generated by amplifying GtACR1-eYFP (a gift from Adam Claridge-Chang and Farhan Mohammed) and cloning into a linearized 13x-LexAop2-IVS-myr::GFP construct (Addgene #26224) digested with XhoI and XbaI using InFusion and injected into attP2 and attP40 by BestGene, Inc.
QUANTIFICATION AND STATISTICAL ANALYSIS
General framework:
Throughout this manuscript, we take a Bayesian approach to parameter estimation because it more closely corresponds to the inference procedures we are performing, and as such all reported windows and intervals correspond to the mass of the posterior distribution for the inferred model parameter. This is because the Bayesian approach corresponds to inference about the values of descriptors of our model (e.g. in our data, the probability of terminating the mating in response to some stimulus), rather than consistency of a data set with a particular value that the model might take. With this approach, we can make statistical claims about our belief in the magnitude of effects, rather than simply reporting their deviation from that produced by a null hypothesis. We do, however, recognize that the frequentist approach is more commonplace, and so present our data in a manner that is as consistent as possible with typical frequentist reporting and hypothesis testing. We use noninformative priors (Jaynes, 1968), so this trivially corresponds to the usual Central Limit Theorem statistics in the case of estimating the variability of means, but a slightly different estimator on proportions. Our results and their interpretation do not hinge, in any case, on precise statistical methodology, as our effects tend to be very large, and so this decision is more philosophical than effectual.
Credible intervals for proportions:
All proportions are modeled as Bernoulli random processes with probability p and presented as the sample estimate for the proportion p ( with x the number of observed successes and n the total number of observations, the maximum likelihood estimate, rather than the maximum posterior estimate, for consistency with standard data presentation). This point is surrounded by a 68% credible interval (selected to be similar to the broadly familiar SEM metric, which is itself a 68% credible interval on the mean under a uniform prior), generated by sampling from the posterior distribution using Markov Chain Monte Carlo (MCMC, Metropolis-Hastings algorithm) with the noninformative Jeffreys prior and selecting the 16–84% window of this empirical estimate of the posterior. The Jeffreys prior was selected because it gives a posterior that is in a sense invariant under reparameterizations (Jeffreys, 1945), and thus gives a consistent result between our posterior distributions even when we invert or transform the inference problem. The window generated by this method is also a numerical approximation of a 68% confidence interval with the corresponding frequentist properties.
Determination of long mating or normal mating:
As in Thornquist et al.(Thornquist et al., 2020), we estimated the probability of a given experimental condition producing a long mating duration using a hierarchical Bayesian model:
For a given time t, we estimated the posterior distribution of the parameter p of a Bernoulli process, which was used to select the posterior distributions used to sample the mean and variance of the Gaussian from which an individual fly’s copulation duration was drawn. Explicitly:
with and the mean and variance of the “no light” condition, and and the mean and variance of the “light at start” condition, and likewise Nk the corresponding size of those samples. The prior on pt was a Beta distribution with α = β = 0.5, the Jeffrey’s prior, and we used MCMC to estimate the posterior distribution of pt.We then plotted the maximum a posteriori value for pt along with 68% credible intervals.
A similar model was used for the “relief from inhibition” experiments in which inhibition was relieved after 10 minutes of mating. These flies would mate for ~18 minutes longer (in contrast to those flies in which inhibition was not relieved, that would typically mate for at least another hour). The flies in which inhibition was removed at 10 minutes were used instead of the “no light” condition for generating the priors on and , as in Figure 7A.
Computing normalized mutual information of eruption timing:
For each cell, we found the peak response to each pulse of light and used these to populate an m × n dimensional matrix F, with m cells for each of the n pulses. Each row of the matrix was fit to a Gaussian mixture model with two components, and then each pulse response was classified as having most likely been produced by one of the two Gaussians. Those in the cluster with the highest mean were labeled “eruptions” and those in the other cluster were labeled “non-eruptions.” We then measured the mutual information using the n columns x ∈ {0,1}m to estimate the mutual information M(xi; xj) with xi the ith row of each x. The mutual information was normalized to create the matrix
and the upper triangle (excluding the diagonal) of this matrix (i.e. the normalized mutual information between each pair of cells) was plotted in Figure 5C. This was compared to all permutations of the above in which each row of F was circularly permutated (that is, F was replaced by F′ where with a different ki for each row) to generate a shuffled sequence that had the same overall patterning as F but in which the relationship between peak responses across cells is scrambled.
All code for these analyses (and corresponding hypothesis testing) was written using the freely available Python packages numpy and pymc and is available on Github at https://github.com/CrickmoreRoguljaLabs.
Hypothesis testing on proportions:
To test the hypothesis that two sample proportions were drawn from the same Bernoulli process, we used Fisher’s exact test.
Credible intervals on means:
We use the standard SEM estimator for variability of sample means with the unbiased estimator of sample variance and N the sample size, which corresponds to the 68% credible interval for the sample mean using the “improper” uniform prior.
Hypothesis testing on distributions:
We use the nonparametric Mann-Whitney U test on rank sums for differences in distributions of copulation duration. We then correct for multiple comparisons by using the Holm-Bonferroni correction on our criteria for statistical significance (with the number of hypotheses being the number of unique pairs of comparisons, n(n − 1)/2).
Modeling
Analysis of mutual information between elapsed time and CaMKII activity:
We use the standard definition for the entropy of a random variable s with domain S and measure ds:
with log(x) referring to the logarithm base 2 (giving units of bits). We consider a variable I(t) that takes the value I(t) = 0 if t ≤ τ and I(t) = 1 if t ≤ τ with t~ Uni(0,10) uniformly distributed from 0 to 10. Then the entropy .
We can then define the conditional entropy
for a random variable u defined on domain U with measure du to compute the mutual information between s and u, i.e. the extent to which knowledge of u reduces the entropy of s:
Then if the random variable s is determined by t as well, we can compute the mutual information MI(I; s) from H(I\s):
We then note that to rewrite this as:
or, evaluating the integral over t:
since p(I = 0 | t > τ) = p(I = 1 | t ≤ τ) = 0. For green-Camuiα, we approximated the integral by creating bins {si} of size 0.02 nanoseconds, computed p(si|t ≤ τ) and p(si|t ≤ τ) and p(si) by counting the number of image frames in which the value for green-Camuiα was within si and dividing that by the total frames being considered (e.g. all the frames such that t ≤ τ when computing p(si|t ≤ τ)).
Analysis of mutual information between elapsed time and behavior:
We use the same expression as for the analysis of green-Camuiα data, except now s ∈ {Long mating, normal mating}. The value of p(s|t > τ) was computed using the mean from the Bayesian analysis described above when τ ∈ {0,1,5,6,7,8,10} (in minutes), the values for which we performed experiments and a linear interpolation between those values was used for τ otherwise.
Evidence accumulation:
We model the accumulation within cycle t as
where ζt is the positive evidence accumulated (when the light is off), ηt is the negative evidence accumulated (when the light is on), and α is a scale factor. Both ζt and ηt are exponentially distributed, with the mean of ζt being μ and the mean of ηt being μf/(1 — f), with f the duty cycle (the proportion of a cycle, on average, that the light is on). Exponential distributions were chosen because they are the maximum entropy distribution when the mean is specified, and so in a sense are maximally disordered. More explicitly:
Then the evidence accumulated in a trial, xt, has the distribution
where Θ(x) is the Heaviside theta function, Θ(x) = 0 if x < 0 and Θ(x) = 1 otherwise. The above can be written as
or
If z < 0, then the Θ is just 1 and we have that
but if z ≥ 0 we change the bounds of the integral to find
so that
We define so that the above expression simplifies to
Evidence accumulation follows the model
with XT the accumulated evidence at time T and xt i.i.d. random variables distributed as above. We then set a threshold θ and numerically approximated the distribution of the random variable taccum = inf{t | Xt ≥ θ} by generating 1,000 values of xt for each simulated fly according to the probability distribution above and measuring taccum for each fly. The simulated copulation duration was estimated with:
where a normal random variable estimated from the data in Figure 7A, 18 corresponds to the mean latency between the eruption and the termination of mating, 9 = 32 the mean σ from Figure 7A, and 6 corresponds to the time for CaMKII to decay to baseline. This approximation was performed for 1000 flies for each parameter pairing μ,φ with α = 4 to generate the predicted distributions in Figure 7E. If Xt < θ for all t, d was drawn from the Gaussian in Figure 1A, with mean 176 minutes and standard deviation 40 minutes.
Imaging
Calcium and cAMP imaging quantification:
Most images were processed by simply taking the sum of all photon counts across the image, and then subtracting the background (estimated as the median pixel value, which was almost always 0 photon counts). Because our driver does not label any other neurons in the abdominal ganglion, we did not need to use ROIs or image segmentation to restrict our analysis to specific pixels. ΔF/F was computed as where with t = 0 corresponding to the first frame of optogenetic excitation. Analysis was performed using custom Python3 code.
When analyzing multiple neurons simultaneously, rectangular ROIs were drawn around identified cells or processes and the same analysis as above was performed.
Experiments using only GCaMP6s used a 920 nm excitation wavelength, while those performed in conjunction with cADDisRed-Up used a 1000 nm excitation beam. Experiments using cADDisGreen-Down also used a 1000 nm excitation wavelength.
FLIM quantification:
FLIM data was collected for each pixel in 64 time bins of width 200 picoseconds. All pixels across the series of images were pooled to fit the parameters of a multiple-time constant model Exp(t) convolved with the instrument response function IRF(t) (assumed to be a Gaussian) by finding the maximum likelihood estimate of the parameter values. The probability that a photon will be detected at time t is then described by the relation:
where fn refers to the proportion of excited fluorophores in state n with time constant τn. The two convolved distributions are
corresponding to the probability of a given instrumentation induced shift in the detected arrival time and
with Θ(t) the Heaviside theta function Θ(t) = 1 if t ≥ 0 and 0 otherwise. This corresponds to the probability of an excited fluorophore in state n emitting a photon at time t. The convolution of these two distributions is
We can evaluate this integral by completing the square inside the exponential:
with the complementary error function. We then fit the parameters {τn}, {fn}, τg, t0 by minimizing the log-likelihood function (with ni the number of counts in photon detector time bin i)
with ti corresponding to the time of detector time bin i, subject to the constraints , 0 ≤ fn ≤ 1, 0 < τg, t0, τn.
We used the obtained estimate for t0 to compute the “empirical lifetime” τ, the mean arrival time of a photon (Lee et al., 2009). τ is defined as
The typical value for t0 was approximately 2.9+/−0.1 nanoseconds. τg values ranged from 0.1 to 0.2 nanoseconds. Other parameters were used to be sure fluorophores weren’t forming aggregates, in which their fit parameters would deviate from those typically observed. Usual values for τ1 and τ2 for various fluorophores were as follows: green-Camuiα: 0.6, 2.2 nanoseconds; FLIM-AKAR: 0.7, 2.1 nanoseconds; cADDisGreen-Down: 1.2, 2.8 nanoseconds, GCaMP6s: 2.8 nanoseconds (usually monoexponential).
Supplementary Material
Supplementary Table 2: Genotypes and number of flies per experiment (Related to STAR Methods)
Supplementary Table 3: Statistical analyses and p-values (Related to STAR Methods)
Supplementary Video 1 | The Crz neurons require over 60 seconds of electrical activity to permit a normal copulation duration (Related to Figure 1)
Flies expressing GtACR1 in the Crz neurons are exposed to green light until 10 minutes into mating, when inhibition is relieved for either 30 seconds (top row) or 90 seconds (bottom row). All flies exposed to 90 seconds of relief terminate mating around 18 minutes later, while those exposed to 30 seconds of relief all persist in mating for much longer.
Supplementary Video 2 | Calcium levels return to baseline within 100 seconds after bPAC-mediated cAMP synthesis (Related to Figure 4)
Flies expressing bPAC in the Crz neurons exposed to 500 ms pulses of blue light (yellow flashes) show modest increases in intracellular calcium in response to induction of cAMP synthesis before an eruption, a massive increase in calcium levels. Left: pixelwise fluorescence, right: ΔF/F across the entire image. (Sped up ~16x)
Supplementary Video 3 | Eruptions are a network phenomenon and synchronous across all Crz neurons (Related to Figure 5)
Flies expressing bPAC in the Crz neurons exposed to 500 ms pulses of blue light (yellow flashes). All neurons erupt synchronously. Left: Pixelwise fluorescence. Right: ΔF/F in each soma plotted in a separate color. (Sped up ~60x).
CaMKII measures time by delaying the Corazonin eruption
Network-level evidence about time accumulates to threshold as Camp/PKA signaling
A synchronized eruption reports suprathreshold evidence to downstream circuitry
Erupting networks can accumulate and evaluate information over seconds to hours
Thornquist, Pitsch et al. describe the eruption: a neural network mechanism that transforms continuous and distributed inputs into discrete, consensus output. The eruption is a network-wide influx of calcium triggered by suprathreshold accumulation of cAMP/PKA signaling. The Corazonin eruption triggers motivational and behavioral changes once an evidence threshold is reached.
Acknowledgements
We thank Andrew Siliciano and Vanessa Ruta for contribution of the unpublished cADDis reagents. We thank Yao Chen and Bernardo Sabatini for assistance with early microscopy experiments. We thank Mark Andermann and the members of the Crickmore and Rogulja labs for comments on the manuscript. We thank Eliza Smith, Jingwen Ren, and Isaac Lee for their assistance with the screen Figure 2D. The microscope used in these studies was constructed with the assistance of Ryohei Yasuda and Long Yan at Florida Lifetime Imaging. Funding: NIH R01GM134222 and an NSF graduate research fellowship to SCT.
Footnotes
Declaration of Interests
S.C.T is currently in the Laboratory of Integrative Brain Function at Rockefeller University. M.J.P and C.S.A are currently affiliated with the University of Würzburg. The authors declare no competing interests.
Publisher's Disclaimer: This is a PDF file of an unedited manuscript that has been accepted for publication. As a service to our customers we are providing this early version of the manuscript. The manuscript will undergo copyediting, typesetting, and review of the resulting proof before it is published in its final form. Please note that during the production process errors may be discovered which could affect the content, and all legal disclaimers that apply to the journal pertain.
REFERENCES
- Abbott LF (2006). Where Are the Switches on This Thing? In 23 Problems in Systems Neuroscience, pp. 423–431. [Google Scholar]
- Allène C, Cattani A, Ackman JB, Bonifazi P, Aniksztejn L, Ben-ari Y, and Cossart R (2008). Sequential Generation of Two Distinct Synapse-Driven Network Patterns in Developing Neocortex. J. Neurosci 28, 12851–12863. [DOI] [PMC free article] [PubMed] [Google Scholar]
- Baines RA, Uhler JP, Thompson A, Sweeney ST, and Bate M (2001). Altered electrical properties in Drosophila neurons developing without synaptic transmission. J. Neurosci 21, 1523–1531. [DOI] [PMC free article] [PubMed] [Google Scholar]
- Bosch JA, Tran NH, and Hariharan IK (2015). CoinFLP: A system for efficient mosaic screening and for visualizing clonal boundaries in drosophila. Development 142, 597–606. [DOI] [PMC free article] [PubMed] [Google Scholar]
- Bospoort R Van De, Farina M, Schmitz SK, De Jong, A., De Wit, H., Verhage M, and Toonen RF (2012). Munc13 controls the location and efficiency of dense-core vesicle release in neurons. J. Cell Biol 199, 883–891. [DOI] [PMC free article] [PubMed] [Google Scholar]
- Bunemann M, Gerhardstein BL, Gao T, and Hosey MM (1999). Functional Regulation of L-type Calcium Channels via Protein Kinase A-mediated Phosphorylation of the B2 Subunit. J Biol Chem 274, 33851–33855. [DOI] [PubMed] [Google Scholar]
- Chamberland S, Yang HH, Pan MM, Evans SW, Guan S, Chavarha M, Yang Y, Salesse C, Wu H, Wu JC, et al. (2017). Fast two-photon imaging of subcellular voltage dynamics in neuronal tissue with genetically encoded indicators. Elife. [DOI] [PMC free article] [PubMed] [Google Scholar]
- Chen T-W, Wardill TJ, Sun Y, Pulver SR, Renninger SL, Baohan A, Schreiter ER, Kerr R. a, Orger MB, Jayaraman V, et al. (2013). Ultrasensitive fluorescent proteins for imaging neuronal activity. Nature 499, 295–300. [DOI] [PMC free article] [PubMed] [Google Scholar]
- Chen Y, Saulnier JL, Yellen G, and Sabatini BL (2014). A PKA activity sensor for quantitative analysis of endogenous GPCR signaling via 2-photon FRET-FLlM imaging. Front. Pharmacol 5. [DOI] [PMC free article] [PubMed] [Google Scholar]
- Chen Y, Granger AJ, Tran T, Saulnier JL, Kirkwood A, and Sabatini BL (2017). Endogenous G a q-Coupled Neuromodulator Receptors Activate Protein Kinase A. Neuron 1–14. [DOI] [PMC free article] [PubMed] [Google Scholar]
- Chialvo DR (2010). Emergent complex neural dynamics. Nat. Phys 6, 744–750. [Google Scholar]
- Churchland MM, Cunningham JP, Kaufman MT, Ryu SI, and Shenoy KV (2010). Cortical Preparatory Activity: Representation of Movement or First Cog in a Dynamical Machine? Neuron 68, 387–400. [DOI] [PMC free article] [PubMed] [Google Scholar]
- Crickmore MA, and Vosshall LB (2013). Opposing dopaminergic and GABAergic neurons control the duration and persistence of copulation in Drosophila. Cell 155, 881–893. [DOI] [PMC free article] [PubMed] [Google Scholar]
- Dittman JS, and Ryan TA (2019). The control of release probability at nerve terminals. Nat. Rev. Neurosci. [DOI] [PubMed] [Google Scholar]
- Duan ZRS, Che A, Chu P, Modol L, Bollmann Y, Babij R, Fetcho RN, Otsuka T, Fuccillo MV, Liston C, et al. (2020). GABAergic Restriction of Network Dynamics Regulates Interneuron Survival in the Developing Cortex Article GABAergic Restriction of Network Dynamics Regulates Interneuron Survival in the Developing Cortex. Neuron. [DOI] [PMC free article] [PubMed] [Google Scholar]
- Elsayed GF, Lara AH, Kaufman MT, Churchland MM, and Cunningham JP (2016). Reorganization between preparatory and movement population responses in motor cortex. Nat. Commun 7, 13239. [DOI] [PMC free article] [PubMed] [Google Scholar]
- Fagan KA, Graf RA, Tolman S, Schaack J, Cooper DMF, and Chem DMFJB (2000). Regulation of a Ca2+-sensitive Adenylyl Cyclase in an Excitable Cell. J Biol Chem 275, 40187–40194. [DOI] [PubMed] [Google Scholar]
- Fulop T, Radabaugh S, and Smith C (2005). Activity-Dependent Differential Transmitter Release in Mouse Adrenal Chromaffin Cells. J. Neurosci 25, 7324–7332. [DOI] [PMC free article] [PubMed] [Google Scholar]
- Govorunova EG, Sineshchekov OA, Janz R, Liu X, and Spudich JL (2015). Natural light-gated anion channels: A family of microbial rhodopsins for advanced optogenetics. Science (80-. ). 349, 647–650. [DOI] [PMC free article] [PubMed] [Google Scholar]
- Groschner LN, Chan Wah Hak L, Bogacz R, DasGupta S, and Miesenböck G (2018). Dendritic Integration of Sensory Evidence in Perceptual Decision-Making. Cell 173, 894–905.e13. [DOI] [PMC free article] [PubMed] [Google Scholar]
- Grozinger L, Amos M, Gorochowski TE, Carbonell P, Oyarzún DA, Stoof R, Fellermann H, Zuliani P, Tas H, and Goni-moreno A (2019). Pathways to cellular supremacy in biocomputing. Nat. Commun 1–11. [DOI] [PMC free article] [PubMed] [Google Scholar]
- Hastings MH, Maywood ES, and Brancaccio M (2018). Generation of circadian rhythms in the suprachiasmatic nucleus. Nat. Rev. Neurosci [DOI] [PubMed] [Google Scholar]
- Herzog ED, Aton SJ, Numano R, Sakaki Y, and Tei H (2004). Temporal Precision in the Mammalian Circadian System: A Reliable Clock from Less Reliable Neurons. J. Biol. Rhythms 19, 35–46. [DOI] [PubMed] [Google Scholar]
- Hopfield JJ (1982). Neural networks and physical systems with emergent collective computational abilities. Proc. Natl. Acad. Sci 79, 2554–2558. [DOI] [PMC free article] [PubMed] [Google Scholar]
- Inagaki HK, Fontolan L, Romani S, and Svoboda K (2019). Discrete attractor dynamics underlies persistent activity in the frontal cortex. Nature. [DOI] [PubMed] [Google Scholar]
- Izhikevich EM (2007). Dynamical Systems in Neuroscience.
- Jaynes ET (1968). Prior Probabilities. IEEE Trans. Syst. Sci. Cybern 4, 227–241. [Google Scholar]
- Jeffreys H (1945). An invariant form for the prior probability in estimation problems. Proc. R. Soc. Lond. A. Math. Phys. Sci 453–461. [DOI] [PubMed] [Google Scholar]
- Kaufman MT, Churchland MM, Ryu SI, and Shenoy KV (2014). Cortical activity in the null space: permitting preparation without movement. Nat. Neurosci 17, 440–448. [DOI] [PMC free article] [PubMed] [Google Scholar]
- Kim C, Cheng CY, Saldanha SA, and Taylor SS (2007). PKA-I Holoenzyme Structure Reveals a Mechanism for cAMP-Dependent Activation. Cell 130, 1032–1043. [DOI] [PubMed] [Google Scholar]
- Klapoetke NC, Murata Y, Kim SS, Pulver SR, Birdsey-Benson A, Cho YK, Morimoto TK, Chuong AS, Carpenter EJ, Tian Z, et al. (2014). Independent optical excitation of distinct neural populations. Nat. Methods 11, 338–346. [DOI] [PMC free article] [PubMed] [Google Scholar]
- Latimer K, Yates J, Meister M, Huk A, and Pillow JW (2015). Single-trial spike trains in parietal cortex reveal discrete steps during decision-making. Science (80-. ). [DOI] [PMC free article] [PubMed] [Google Scholar]
- Lee G, Villella A, Taylor B, and Hall JC (2001). New reproductive anomalies in fruitless-mutant Drosophila males: Extreme lengthening of mating durations and infertility correlated with defective serotonergic innervation of reproductive organs. J. Neurobiol 47, 121–149. [DOI] [PubMed] [Google Scholar]
- Lee S-JR, Escobedo-Lozoya Y, Szatmari EM, and Yasuda R (2009). Activation of CaMKII in single dendritic spines during long-term potentiation. Nature 458, 299–304. [DOI] [PMC free article] [PubMed] [Google Scholar]
- Li N, Chen T, Guo ZV, Gerfen CR, and Svoboda K (2015). A motor cortex circuit for motor planning and movement. Nature 519, 51–56. [DOI] [PubMed] [Google Scholar]
- Li W, Ohlmeyer JT, Lane ME, and Kalderon D (1995). Function of protein kinase A in hedgehog signal transduction and Drosophila imaginal disc development. Cell 80, 553–562. [DOI] [PubMed] [Google Scholar]
- Livingstone MS, Sziber PP, and Quinn WG (1984). Loss of calcium/calmodulin responsiveness in adenylate cyclase of rutabaga, a Drosophila learning mutant. Cell 37, 205–215. [DOI] [PubMed] [Google Scholar]
- MacBean IT, and Parsons PA (1967). Directional selection for duration of copulation in Drosophila melanogaster. Genetics 56, 233–239. [DOI] [PMC free article] [PubMed] [Google Scholar]
- Mante V, Sussillo D, Shenoy KV, and Newsome WT (2013). Context-dependent computation by recurrent dynamics in prefrontal cortex. Nature 503, 78–84. [DOI] [PMC free article] [PubMed] [Google Scholar]
- Matsuda N, Lu H, Fukata Y, Noritake J, Gao H, Mukherjee S, Nemoto T, Fukata M, and Poo M (2009). Differential Activity-Dependent Secretion of Brain-Derived Neurotrophic Factor from Axon and Dendrite. J. Neurosci 29, 14185–14198. [DOI] [PMC free article] [PubMed] [Google Scholar]
- Mika D, and Conti M (2016). PDE4D phosphorylation: A coincidence detector integrating multiple signaling pathways. Cell. Signal 28, 719–724. [DOI] [PubMed] [Google Scholar]
- Mika D, Richter W, and Conti M (2015). A CaMKII / PDE4D negative feedback regulates cAMP signaling. PNAS 112, 2023–2028. [DOI] [PMC free article] [PubMed] [Google Scholar]
- Mohammad F, Stewart JC, Ott S, Chlebikova K, Chua JY, Koh T, Ho J, and Claridge-chang A (2017). Optogenetic inhibition of behavior with anion channelrhodopsins. Nat. Methods. [DOI] [PubMed] [Google Scholar]
- Nern A, Pfeiffer BD, and Rubin GM (2015). Optimized tools for multicolor stochastic labeling reveal diverse stereotyped cell arrangements in the fly visual system. Proc. Natl. Acad. Sci. U. S. A 112, E2967–E2976. [DOI] [PMC free article] [PubMed] [Google Scholar]
- van den Pol AN (2012). Neuropeptide Transmission in Brain Circuits. Neuron 76, 98–115. [DOI] [PMC free article] [PubMed] [Google Scholar]
- Roitman JD, and Shadlen MN (2002). Response of neurons in the lateral intraparietal area during a combined visual discrimination reaction time task. J. Neurosci 22, 9475–9489. [DOI] [PMC free article] [PubMed] [Google Scholar]
- Rorsman P, and Ashcroft FM (2018). Pancreatic β-cell electrical activity and insulin secretion: Of mice and men. Physiol. Rev 98, 117–214. [DOI] [PMC free article] [PubMed] [Google Scholar]
- Runyan CA, Piasini E, Panzeri S, and Harvey CD (2017). Distinct timescales of population coding across cortex. Nat. Publ. Gr. [DOI] [PMC free article] [PubMed] [Google Scholar]
- Sang L, Dick IE, and Yue DT (2016). Protein Kinase A Modulation of Cav1.4 Calcium Channels. Nat. Commun 7. [DOI] [PMC free article] [PubMed] [Google Scholar]
- Scholz N, Guan C, Nieberler M, Grotemeyer A, Maiellaro I, Gao S, Beck S, Pawlak M, Sauer M, Asan E, et al. (2017). Mechano-dependent signaling by Latrophilin / CIRL quenches cAMP in proprioceptive neurons. Elife 1–21. [DOI] [PMC free article] [PubMed] [Google Scholar]
- Sepulchre R, Drion G, and Franci A (2019). Control Across Scales by Positive and Negative Feedback. Annu. Rev. Control. Robot. Auton. Syst 2, 89–113. [Google Scholar]
- Shadlen MN, and Newsome WT (2001). Neural basis of a perceptual decision in the parietal cortex (area LIP) of the rhesus monkey. J. Neurophysiol 86, 1916–1936. [DOI] [PubMed] [Google Scholar]
- Shakiryanova D, Tully A, Hewes RS, Deitcher DL, and Levitan ES (2005). Activity-dependent liberation of synaptic neuropeptide vesicles. 8, 173–178. [DOI] [PubMed] [Google Scholar]
- Shannon C (1948). A Mathematical Theory of Communication. Bell Syst. Tech. J 27, 379–423, 623–656. [Google Scholar]
- Skeberdis VA, Chevaleyre V, Lau CG, Goldberg JH, Pettit DL, Suadicani SO, Lin Y, Bennett MVL, Yuste R, Castillo PE, et al. (2006). Protein kinase A regulates calcium permeability of NMDA receptors. Nat. Neurosci 9, 501–510. [DOI] [PubMed] [Google Scholar]
- Stierl M, Stumpf P, Udwari D, Gueta R, Hagedorn R, Losi A, Ga W, Petereit L, Efetova M, Schwarzel M, et al. (2011). Light Modulation of Cellular cAMP by a Small Bacterial Photoactivated Adenylyl Cyclase, bPAC, of the Soil Bacterium Beggiatoa. J. Biol. Chem 286, 1181–1188. [DOI] [PMC free article] [PubMed] [Google Scholar]
- Stokes MG (2015). “Activity-silent” working memory in prefrontal cortex: A dynamic coding framework. Trends Cogn. Sci 19, 394–405. [DOI] [PMC free article] [PubMed] [Google Scholar]
- Südhof TC (2012). The presynaptic active zone. Neuron 75, 11–25. [DOI] [PMC free article] [PubMed] [Google Scholar]
- Tayler TD, Pacheco DA, Hergarden AC, Murthy M, and Anderson DJ (2012). A neuropeptide circuit that coordinates sperm transfer and copulation duration in Drosophila. Proc. Natl. Acad. Sci. U. S. A 109, 20697–20702. [DOI] [PMC free article] [PubMed] [Google Scholar]
- Tenner B, Getz M, Ross B, Ohadi D, Bohrer CH, Greenwald E, Mehta S, Xiao J, Rangamani P, and Zhang J (2020). Spatially compartmentalized phase regulation of a Ca2+-cAMP-PKA oscillatory circuit. Elife 1–34. [DOI] [PMC free article] [PubMed] [Google Scholar]
- Tewson PH, Martinka S, Shaner NC, Hughes TE, and Quinn AM (2016). New DAG and cAMP Sensors Optimized for Live-Cell Assays in Automated Laboratories. J. Biomol. Screen 21, 298–305. [DOI] [PMC free article] [PubMed] [Google Scholar]
- Thornquist SC, and Crickmore MA (2020). Behavioural choice emerges from nonlinear all-to-all interactions between drives. BioRxiv 2020.03.12.989574. [Google Scholar]
- Thornquist SC, Langer K, Zhang SX, Rogulja D, and Crickmore MA (2020). CaMKII measures the passage of time to coordinate behavior and motivational state. Neuron. [DOI] [PMC free article] [PubMed] [Google Scholar]
- Walsh D, Perkins JP, and Krebs E (1968). An Adenosine 3’,5’-Monophosphate-dependant Protein Kinase from Rabbit Skeletal Muscle. J Biol Chem 243, 3763–3766. [PubMed] [Google Scholar]
- Wang H, and Sieburth D (2013). PKA Controls Calcium Influx into Motor Neurons during a Rhythmic Behavior. PLoS Genet 9. [DOI] [PMC free article] [PubMed] [Google Scholar]
- Waskom ML, and Kiani R (2018). Decision-making through integration of sensory evidence at prolonged timescales. Curr. Biol 1–7. [DOI] [PMC free article] [PubMed] [Google Scholar]
- Willoughby D, and Cooper DMF (2007). Organization and Ca 2+ Regulation of Adenylyl Cyclases in caMp Microdomains. Physiol Rev. 87, 965–1010. [DOI] [PubMed] [Google Scholar]
- Yellen G, and Mongeon R (2015). Quantitative two-photon imaging of fluorescent biosensors. Curr. Opin. Chem. Biol 27, 24–30. [DOI] [PMC free article] [PubMed] [Google Scholar]
- Yoo SBM, and Hayden BY (2020). The Transition from Evaluation to Selection Involves Neural Subspace Reorganization in Core Reward Regions. Neuron 1–13. [DOI] [PMC free article] [PubMed] [Google Scholar]
- Zylberberg A, and Shadlen MN (2016). Cause for pause before leaping to conclusions about stepping. BioRxiv 1–15. [Google Scholar]
Associated Data
This section collects any data citations, data availability statements, or supplementary materials included in this article.
Supplementary Materials
Supplementary Table 2: Genotypes and number of flies per experiment (Related to STAR Methods)
Supplementary Table 3: Statistical analyses and p-values (Related to STAR Methods)
Supplementary Video 1 | The Crz neurons require over 60 seconds of electrical activity to permit a normal copulation duration (Related to Figure 1)
Flies expressing GtACR1 in the Crz neurons are exposed to green light until 10 minutes into mating, when inhibition is relieved for either 30 seconds (top row) or 90 seconds (bottom row). All flies exposed to 90 seconds of relief terminate mating around 18 minutes later, while those exposed to 30 seconds of relief all persist in mating for much longer.
Supplementary Video 2 | Calcium levels return to baseline within 100 seconds after bPAC-mediated cAMP synthesis (Related to Figure 4)
Flies expressing bPAC in the Crz neurons exposed to 500 ms pulses of blue light (yellow flashes) show modest increases in intracellular calcium in response to induction of cAMP synthesis before an eruption, a massive increase in calcium levels. Left: pixelwise fluorescence, right: ΔF/F across the entire image. (Sped up ~16x)
Supplementary Video 3 | Eruptions are a network phenomenon and synchronous across all Crz neurons (Related to Figure 5)
Flies expressing bPAC in the Crz neurons exposed to 500 ms pulses of blue light (yellow flashes). All neurons erupt synchronously. Left: Pixelwise fluorescence. Right: ΔF/F in each soma plotted in a separate color. (Sped up ~60x).
Data Availability Statement
Raw data for the screen in Figure 2D is available upon request. Imaging data is hosted by Mendeley Data at https://dx.doi.org/10.17632/tp7t58xjbp.1.
All code used in analyses is available at https://github.com/CrickmoreRoguljaLabs/cAMPCode, and code used for controlling the behavior hardware is available at https://github.com/CrickmoreRoguliaLabs/RaspberryPiControl.