

Abstract
Cortical neurons display diverse firing patterns and synchronization properties. How anesthesia alters the firing response of different neuron groups relevant for sensory information processing is unclear. Here we investigated the graded effect of anesthesia on spontaneous and visual flash-induced spike activity of different neuron groups classified based on their spike waveform, firing rate, and population coupling (the extent neurons conform to population spikes). Single-unit activity was measured from multichannel extracellular recordings in deep layers of primary visual cortex of freely moving rats in wakefulness and at three concentrations of desflurane. Anesthesia generally decreased firing rate and increased population coupling and burstiness of neurons. Population coupling and firing rate became more correlated and the pairwise correlation between neurons became more predictable by their population coupling in anesthesia. During wakefulness, visual stimulation increased firing rate; this effect was the largest and the most prolonged in neurons that exhibited high population coupling and high firing rate. During anesthesia, the early increase in firing rate (20–150ms post-stimulus) of these neurons was suppressed, their spike timing was delayed and split into two peaks. The late response (200–400ms post-stimulus) of all neurons was also suppressed. We conclude that anesthesia alters the visual response of primarily high-firing highly coupled neurons, which may interfere with visual sensory processing. The increased association of population coupling and firing rate during anesthesia suggests a decrease in sensory information content.
Introduction
Most general anesthetics reduce spontaneous neuronal spike activity (Hudetz et al., 2009; Lewis et al., 2012; Vizuete et al., 2014; Aasebø et al., 2017; Kajiwara et al., 2020) and promote synchronization of spike activity among neuronal populations (Erchova et al., 2002; Lewis et al., 2012; Vizuete et al., 2014). Considering that the neuron spike is a fundamental unit of information processing in the cortex, the anesthetic-induced changes of spike activity and synchrony may be directly responsible for an impairment of information processing leading to a change in state of consciousness. The synchronous firing of a neuronal population during anesthesia can be detected at the macroscopic level, using the electroencephalogram (EEG) or local field potentials (LFP), which show the emergence of high amplitude, coherent, low-frequency (< 12 Hz) oscillations (Hudetz, 2002; Sellers et al., 2013; Akeju et al., 2014b) that correlate with loss of consciousness (Purdon et al., 2013; Lee et al., 2017).
Neuronal synchronization can be characterized at the individual neuronal level by an examination of population coupling, which describes the extent individual neurons conform to population spike activity. Population coupling is nearly invariant at short timescales (minutes) (Okun et al., 2015) and between resting and stimulation conditions (Bachatene et al., 2015; Okun et al., 2015), although it can vary at long timescales (days, weeks) (Gulati et al., 2014). Population coupling is an important property of cortical neurons because it is closely related to information processing by neurons (Bachatene et al., 2015; Hung et al., 2015). For example, the spiking of strongly coupled neurons (so-called choristers) reflects the overall behavioral state of the animal (Okun et al., 2015), whereas weakly coupled neurons (so-called soloists) respond selectively and precisely to sensory stimuli (Bachatene et al., 2015; Clawson et al., 2018). In primary visual cortex, the latter neurons show precise tuning curves to grating patches.
Although there have been many investigations of large-scale brain activity under anesthesia, few studies have examined the effect of anesthetic on the spike synchronization properties of individual neurons in vivo (Vizuete et al., 2014; Aasebø et al., 2017; Kajiwara et al., 2020). How anesthesia alters the spontaneous and stimulus-related spike patterns of individual neurons with different baseline firing properties has not been systematically determined. Specifically, we ask: do all neurons in a local cortical area become synchronous during anesthesia? Do the anesthetic-induced changes in spontaneous and visual stimulation-induced spike activity depend on baseline firing pattern? How is neuron-to-neuron coupling affected by the anesthetic-induced change in synchrony? How does the change in synchrony of specific neuron groups affect sensory information processing?
To address these questions, we recorded single-unit activities (SUAs) from deep layers of primary visual cortex of rats in wakefulness and at various levels of anesthesia produced with the common, clinically used anesthetic desflurane. Firing rate, population coupling, and spike waveform (trough-to-peak time) of the neurons were determined during spontaneous activity and used to classify neuron populations into distinct groups. The spike response of these neuron groups to visual stimulation was then investigated at multiple levels of anesthesia corresponding to conscious and unconscious states. Considering the importance of firing rate and population coupling in information processing in the brain, we argued that this investigation should help better understand how conscious sensory information processing is affected by anesthesia.
Experimental procedures
The study was approved by the Institutional Animal Care and Use Committee and was performed in accordance with the Guide for the Care and Use of Laboratory Animals of the Governing Board of the National Research Council (National Academy Press, Washington, D.C., 2011). The methods were previously published, and part of the data were analyzed and published in a different context (Lee et al., 2020).
Electrode implantation
Briefly, adult male Long-Evans rats (n = 8; 300–350 g weight) were chronically implanted with sixty-four contact multi-electrode array (silicon probes; shank length 2 mm, width 28–60 μm, probe thickness 15 μm, shank spacing 200 μm, row separation 100 μm, contact size 413 μm2; custom design a8×8_edge_2mm100_200_413, Neuronexus Technologies, Ann Arbor, MI) in the right primary visual cortex. The electrode array was inserted using a micromanipulator with its tip at the final position of 1.6 mm below the pial surface. Electromyogram was recorded using a pair of insulated wires (PlasticsOne, Inc., Roanoke, VA) positioned bilaterally into the nuchal muscles.
Experimental design
Extracellular recording was performed in a closed, ventilated anesthesia chamber 1–8 days after surgery. Desflurane was administrated with a stepwise decreasing concentration, 6%, 4%, 2%, and 0% and continuously monitored (POET IQ2 monitor; Criticare Systems, Inc., Waukesha, WI). Core body temperature was maintained at 37°C by subfloor heating. A 15-minute equilibration period was allowed between the successive anesthetic levels before the electrophysiological recording was started. At each anesthetic concentration, spontaneous activity was recorded for 20 minutes followed by recording during visual stimulation for 5 minutes. Discrete light flashes of 10ms duration were delivered to the retina at random insterstimulus intervals (2–4 seconds; 100 trials per concentration level) by transcranial illumination (Szabó-Salfay et al., 2001). As before (Hudetz et al., 2015; Todorov et al., 2016), light was emitted by a red LED affixed to the cranium behind the left eye. Flashes of 1ms duration were also delivered in six out of eight experiments due to slightly different experimental protocol; these recordings were not analyzed here.
Our former study with the same data discovered that during desflurane anesthesia, spontaneous spike activity was occasionally desynchronous while showing low firing rate(Lee et al., 2020). This unexpected, paradoxical desynchronized activity has not been reported before and contends the generally presumed dose-dependent anesthetic effect on the brain. Because this novel phenomenon is beyond the purpose of the study, we excluded the desynchronization periods from the analysis. On average, 0.3%, 10.3%, 6.5%, and 40.0% of data were excluded in 0%, 2%, 4%, and 6% desflurane, respectively.
Electrophysiological recording and identification of single units
Extracellular potentials were recorded at 30 kHz sampling rate (SmartBox; Neuronexus Technologies, Ann Arbor, MI). For spike detection, the signals were high-pass filtered at 300Hz and median-referenced. Data with absolute value greater than 10 standard deviations (SD) were removed as artifacts. Noticeable noise episodes were visually inspected and manually excluded from the analysis. One experiment was excluded from the analysis due to severe noise contamination (n = 7).
SUA was identified using a template-based spike sorting software, Spiking Circus (Yger et al., 2018). On average, 36 ± 14 (mean ± SD) single units (neurons) were obtained. All spontaneous activity properties were calculated for non-overlapping 10 second epochs. In order to test if the effect of anesthesia on individual neurons depends on their firing patterns and spike waveforms, we divided neurons into groups based on their firing rate and population coupling at the wakeful baseline condition (0% desflurane) and the trough-to-peak time of their spike waveform that can separate putative putative excitatory and inhibitory neurons (Barthó et al., 2004; Sirota et al., 2008). We then followed the behavior of the same neuron groups over different levels of anesthesia. The firing rate, population coupling, and trough-to-peak time were first linearly rescaled to a given range (0–1), and then K-means clustering algorithm was applied to classify the neurons into four groups using python package Scikit-Learn (www.scikit-learn.org). Silhouettes analysis was used to find the optimal number of clusters from the K-mean clustering method.
Population coupling analysis
Population coupling was defined as the Pearson correlation coefficient between each SUA and the multi-unit activity (MUA), i.e., the summation of SUAs from all recording sites. Before calculating the correlation, both SUA and MUA were convolved with a Gaussian kernel (SD = 25 ms) (Vyazovskiy et al., 2011). To mitigate the effect of SUA on population coupling, the SUA spikes were removed from the MUA; that is, for neuron j, MUA was replaced by MUAj, where MUAj is defined as, MUAj = MUA - SUAj.
To test if the firing rate and population coupling can predict the pairwise correlation between SUAs, we followed a method proposed by (Okun et al., 2015) to create a random spike train with population coupling and firing rate equivalent to that of the original spike train. Briefly the random spike train was built according to the raster marginal models, which shifted the spike in the random spike train until three conditions were met; (i) the total firing by neurons, (ii) the distribution of instantaneous population rate, and (iii) the inner product of each neuron’s spike train to the sum of all neuron spike trains. We applied the raster marginal model to 10-second segments, using similar parameters as did Okun et al., 2015 with 20ms time bins and errors less than the total number of neurons. The error was the difference in the modeled and actual raster for any of the three conditions.
Statistical analysis
Statistical analyses were conducted using StatsModels library (www.statsmodels.org) in Python 3.7. All variables measured at 2%, 4%, and 6% desflurane levels were compared with those at 0% desflurane (awake state). No further differentiation of brain states was made within each anesthetic condition. We used linear mixed models (LMM) based on restricted maximum likelihood estimation. For all LMMs, the desflurane concentration (categorical independent variable) was used as a fixed effect. The two random effects included the animals and the neurons. Post-hoc pairwise comparisons were made among the four anesthetic levels (including 0%) or among the three neuronal groups using a Bonferroni adjusted p-value (in all figures, *: p < 0.05, **: p < 0.01, and ***: p < 0.001; number of hypothesis = m) unless stated otherwise.
Results
Spike and LFP patterns
Figure 1A illustrates spike activity and LFP from a representative animal. As seen there, spikes became sparse with deepening anesthesia and the amplitude of LFP increased. In addition, the spikes of different neurons became synchronized. At 6% desflurane, LFP showed burst-suppression pattern. The changes in LFP power spectrum (Fig. 1B) were consistent with previous findings (Sellers et al., 2013); low-frequency power (< 4 Hz) increased while high-frequency (> 8 Hz) power progressively decreased from 0% to 4% desflurane.
Fig. 1.
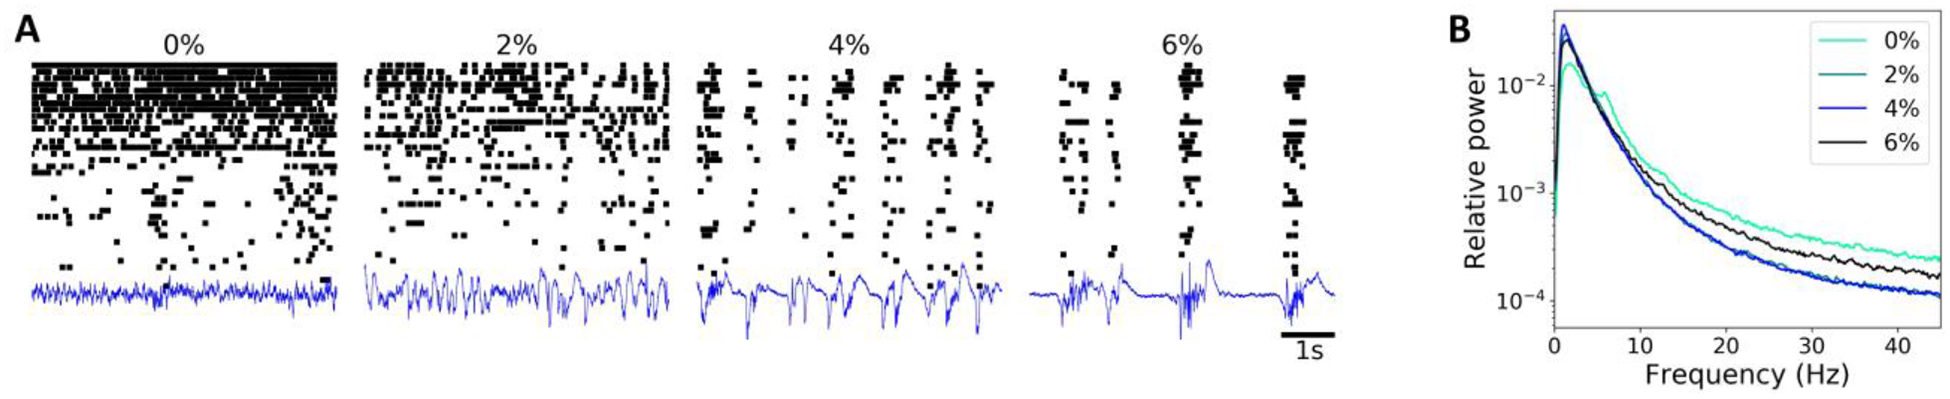
Effect of anesthesia on spike train and LFP signal during spontaneous activity. (A) Raster plot and LFP trace from a representative animal. The vertical axis corresponds to neuron index sorted by the firing rate and the relative size of the amplitude for LFP trace, respectively. (B) Average LFP power spectrum from all animals (n = 7) in waking and anesthetized conditions. Percent values indicate desflurane concentration.
Rank correlation of firing rate and population coupling are preserved
The effect of anesthesia on firing rate and population coupling during spontaneous activity was investigated in individual neurons. First, we tested for the invariance of firing rate and population coupling over time. Both firing rate and population coupling were highly correlated between the first half and the second half of data at each desflurane concentration (diagonal panels in Fig. 2A–B) suggesting that firing rate and population coupling were invariant at a time scale of minutes. Rank (Spearman) correlation values of firing rate were 0.976, 0.973, 0.985, and 0.956, for 0%, 2%, 4%, and 6%, respectively. Rank correlation values of population coupling were 0.817, 0.928, 0.968, and 0.943, for 0%, 2%, 4%, and 6%, respectively. All correlation values were statistically significant (Bonferroni corrected p < 0.05; m = 10).
Fig. 2.
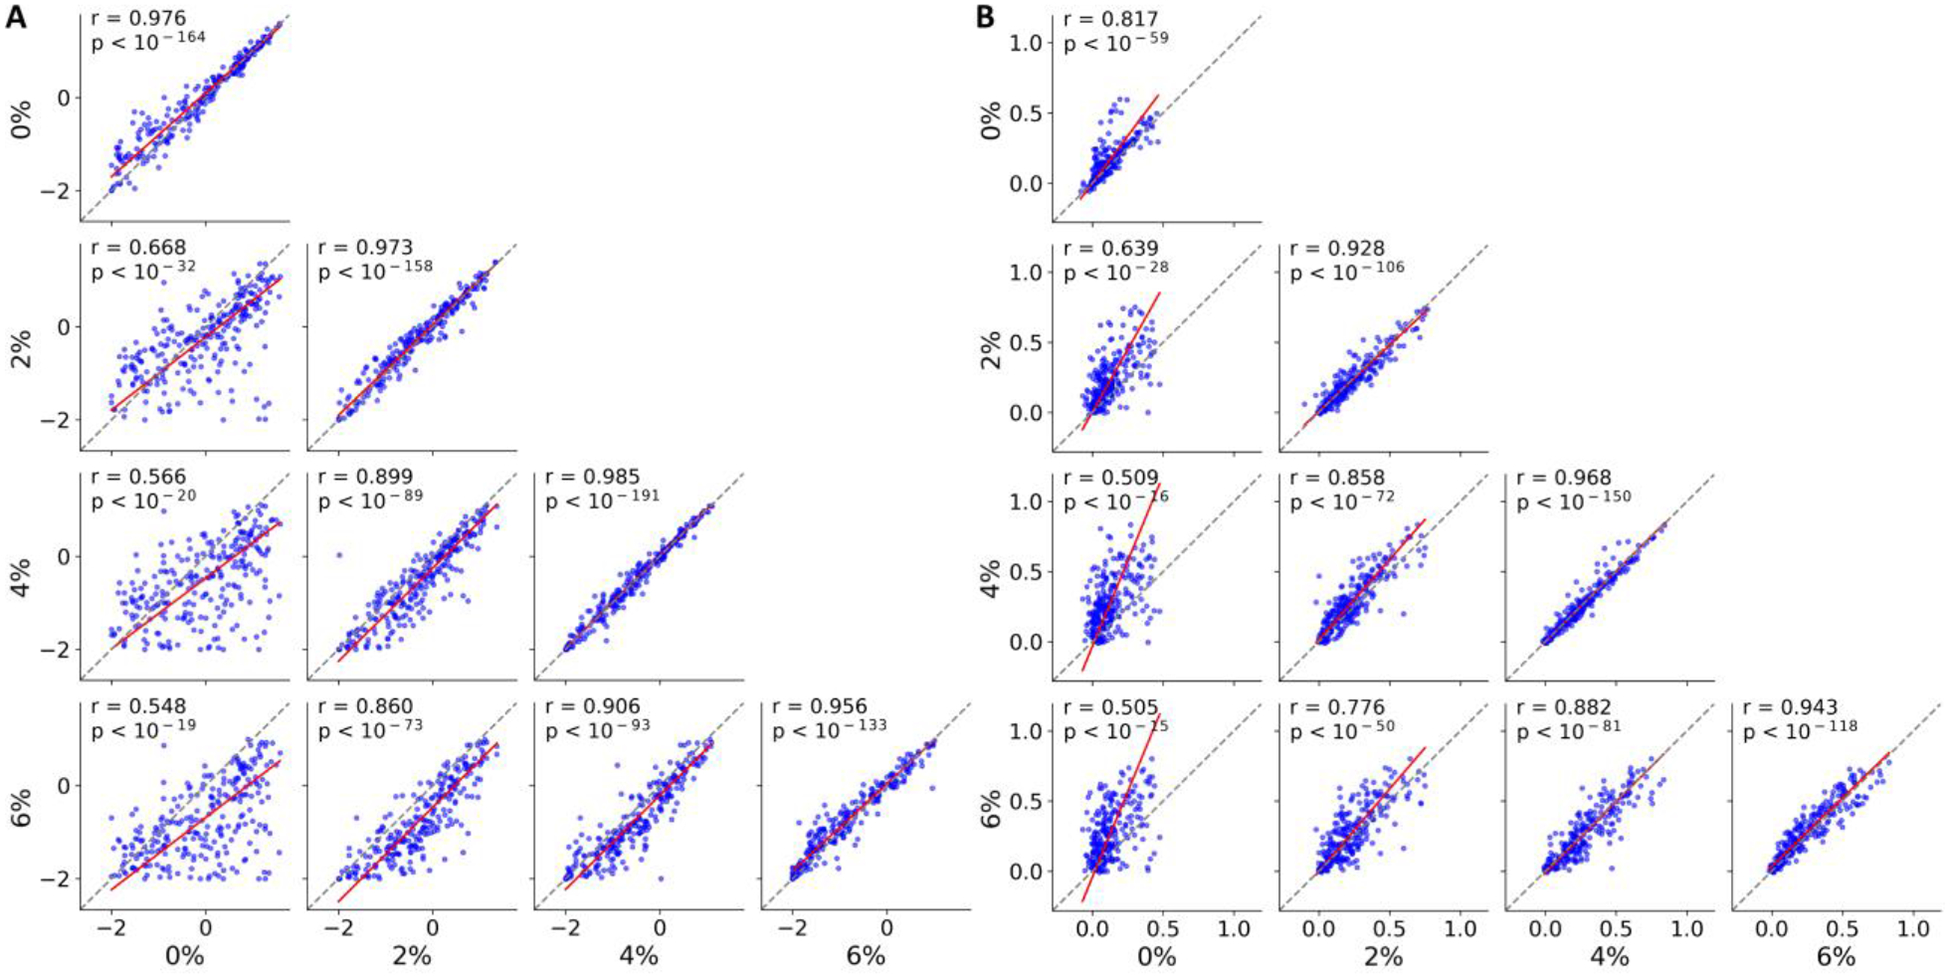
Rank correlation of firing rate and population coupling are preserved within and between different anesthetic levels. (A) Scatter plot of firing rate, (B) population coupling. Each blue dot corresponds to a different neuron (n = 251). The red line is obtained from orthogonal linear regression. Spearman correlation, r and p-values are indicated in each panel. For the within-concentration comparisons (diagonal panels), data were split into two such that the first half of the data was compared with the second half. In all panels, 0%, 2%, 4% and 6% indicate the concentration of desflurane.
Next, we compared firing rate (population coupling) at one concentration with firing rate (population coupling) at another concentration (e.g., 0% vs. 2%; off-diagonal panels in Fig. 2A–B). Rank correlation of firing rate was, 0.668, 0.566, 0.548, 0.899, 0.860, and 0.906, for 0 vs.2%, 0 vs. 4%, 0 vs. 6%, 2 vs. 4%, 2 vs. 6%, and 4 vs. 6%, respectively. Rank correlation of population coupling was, 0.639, 0.509, 0.505, 0.858, 0.776, and 0.882, for 0 vs.2%, 0 vs. 4%, 0 vs. 6%, 2 vs. 4%, 2 vs. 6%, and 4 vs. 6%, respectively. All correlation values were statistically significant (Bonferroni corrected p < 0.05; m = 10), suggesting that neurons have a tendency to preserve their firing rate and population coupling rank across different brain states under anesthesia. Although the rank correlation was largely preserved within each condition, anesthesia appeared to reduce firing rate and enhance population coupling; these effects are quantified in the following section.
Neurons are classified into four groups
In order to determine how desflurane affects neurons with different firing and synchronization properties, individual neurons were classified based on their population coupling and firing rate at 0% desflurane (i.e., wakefulness) as well as the trough-to-peak time of their spike waveform using K-means clustering (Fig. 3A). Silhouette analysis suggested that the optimal number of clusters was K = 4 (Fig. 3B). As seen in Fig. 3C, one of the four groups had narrow spiking waveform while the other three displayed wide spiking waveforms. Narrow spiking and wide spiking neurons generally correspond to putative inhibitory and excitatory neurons, respectively (Csicsvari et al., 1998; Barthó et al., 2004). Based on the scatter plot of the three features (Fig. 3D), the four groups were identified as narrow spiking high-population coupling high firing rate (nHPHF; n = 43), wide spiking high-population coupling high firing rate (wHPHF; n = 30), wide spiking low-population coupling high-firing rate (wLPHF; n = 91), and wide spiking low-population coupling low firing rate (wLPLF; n = 87). Consistent with previous study (Okun et al., 2015), narrow spiking neurons, the putative inhibitory interneurons, tended to have high population coupling.
Fig.3.
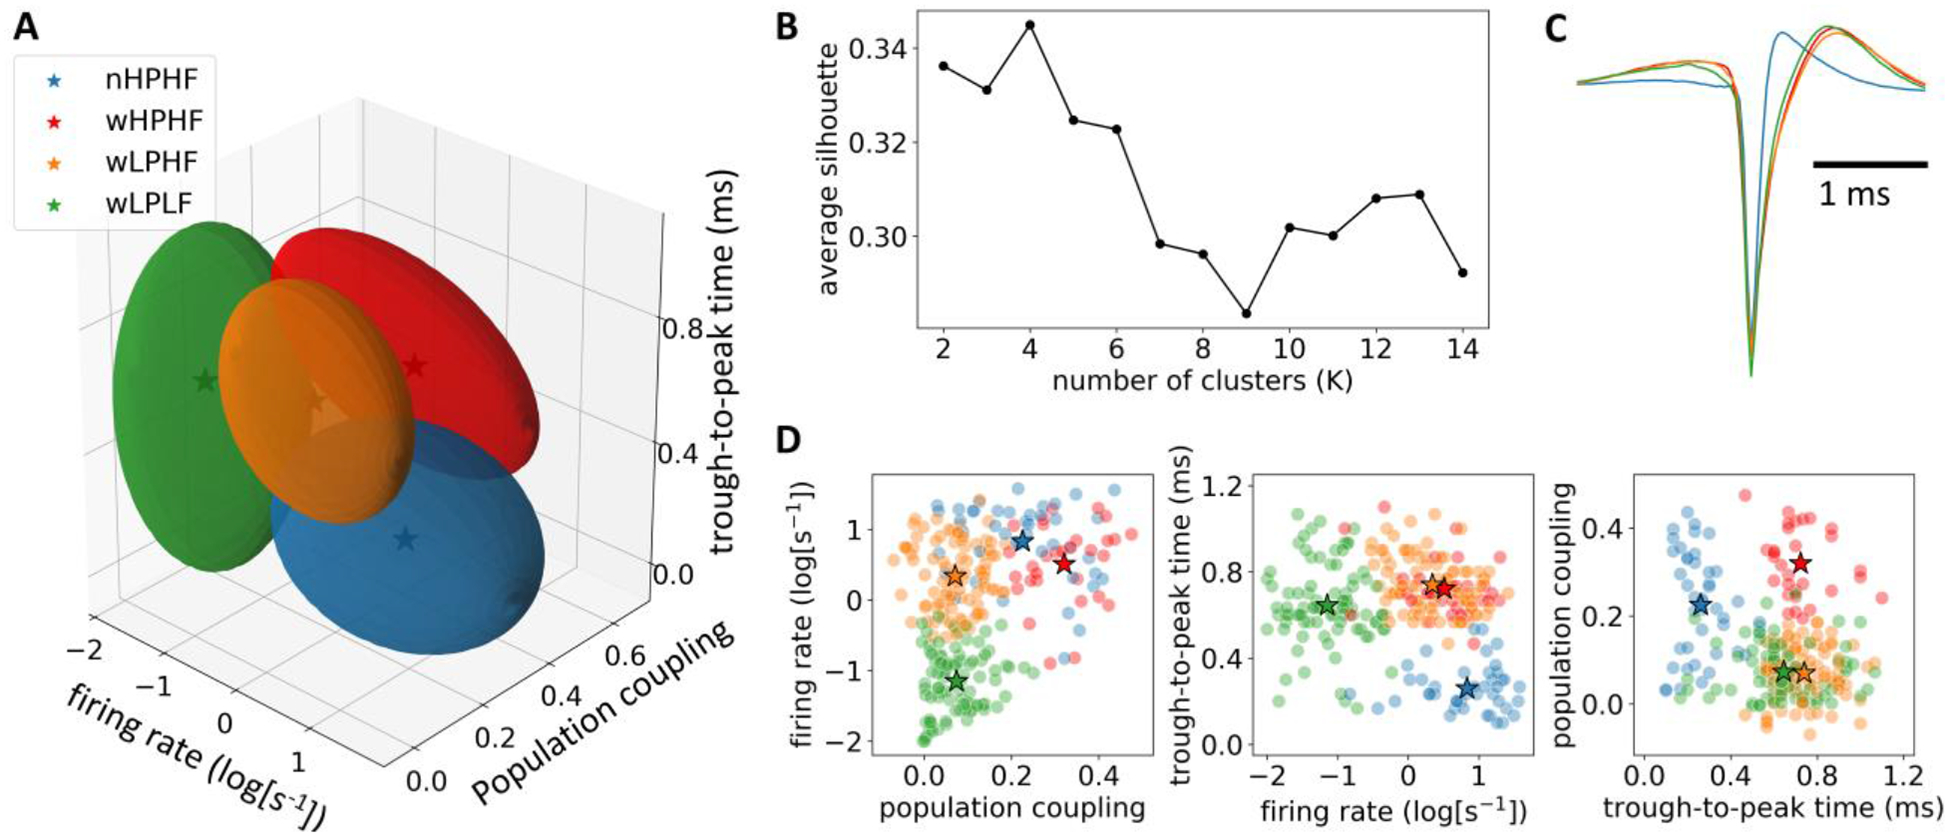
Classification of neuron groups at 0% desflurane. (A) Neuron groups in the feature space. Three features, population coupling, firing rate, and trough-to-peak time were used. The four ellipsoids correspond to the four clusters. The marker,☆represents the centroid of each cluster. (B) Average silhouette value as a function of the number of clusters (K). (C) Spike waveform of the four neuron groups. (D) Scatter plot of the three features in 2-dimensional space. Each dot represents data from a single neuron.
Population coupling and firing rate are increasingly associated in anesthesia
Next, we focused on how neurons with different population coupling, firing rate, and trough-to-peak time were influenced by anesthesia. Fig. 4A depicts the effect of desflurane on population coupling and firing rate of each neuron group. With an increase of anesthetic concentration, the clusters began to slightly overlap but still remained discernible even at 6% desflurane (Fig. 4A, left column).
Fig. 4.
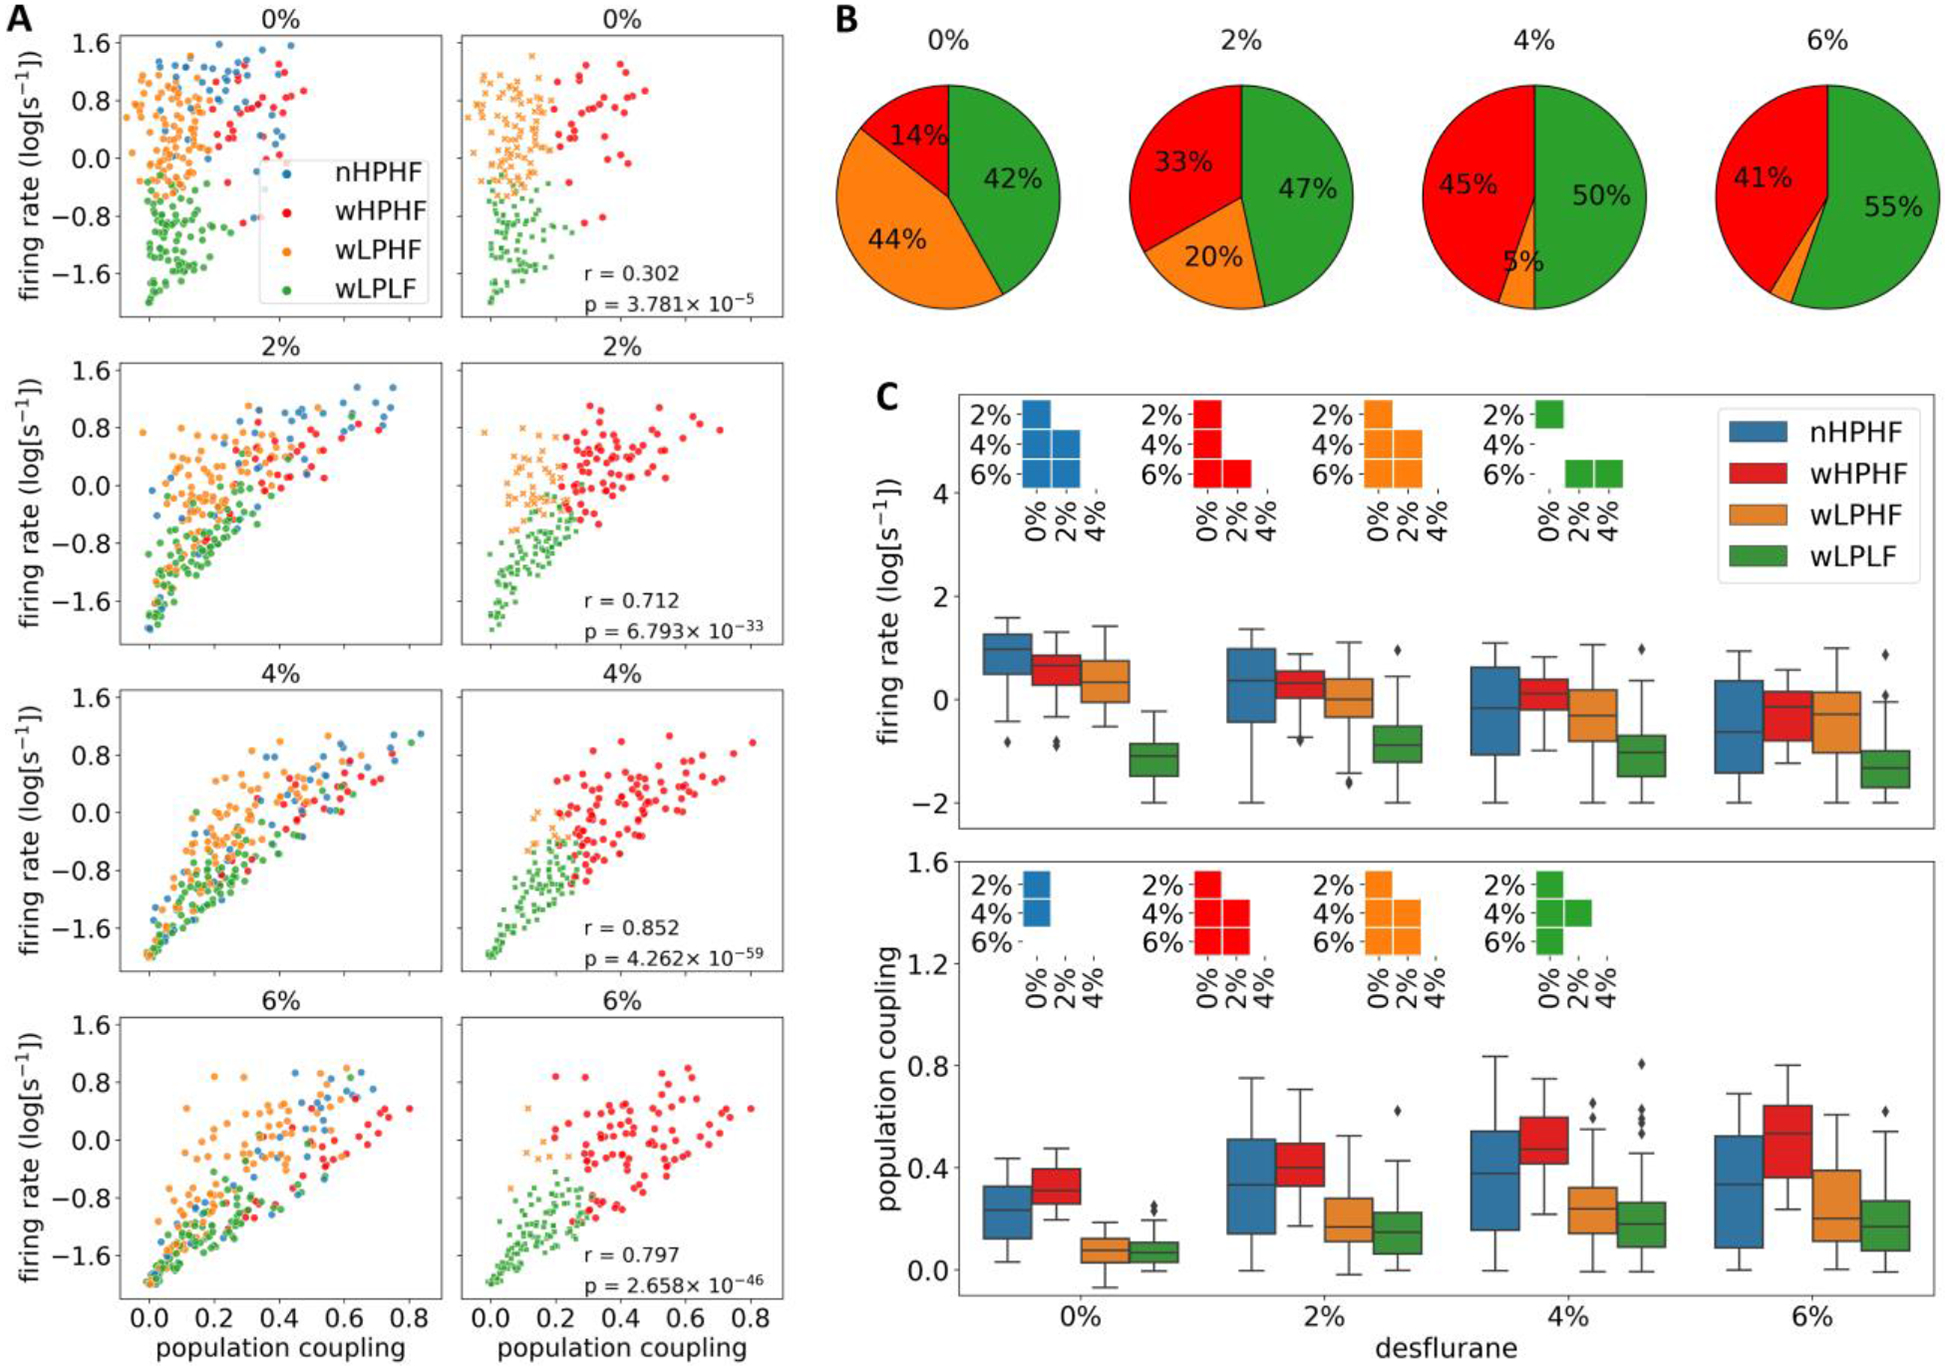
Effect of anesthesia on spontaneous firing rate and population coupling in four neuron groups. (A) Cluster plot of four neuron groups with firing rate and population coupling as features. Percent values on top indicate desflurane concentration. In the left column, the same group identity was used based on classification at 0%. In the right column, group identity was determined by separately in each condition using the same K-means model at 0% desflurane. Narrow spiking neuron groups were excluded. Note that population coupling and firing rate became more positively correlated in anesthesia; see r (Pearson correlation) and corresponding p-value in each panel. (B) Relative frequency of each neuron group at each anesthetic concentration. The data in the pie plots correspond to those in (A) (0% and 2%, 4%, 6% from the right column). (C) Summary of mean firing rate (above) and population coupling (below) in four conditions. The group identity at 0% was applied to all the three anesthetic concentrations as in the left column of (A). Insets indicate pairwise statistically significant difference among conditions (Bonferroni-corrected p < 0.05 with m = 24).
A positive correlation between population coupling and firing rate was evident in all four conditions, but it was consistently higher under anesthesia. The cluster of wLPHF neurons in particular began to spread in anesthesia, enhancing the correlation of population coupling and firing rate. The explained variance ratio by the first principal component was 0.701, 0.896, 0.947, and 0.932, for 0%, 2%, 4%, and 6% desflurane, respectively.
Clustering the data at 0%, 2%, 4%, and 6% independently revealed a profound difference in neuron group identity (right column of Fig. 4A). In this analysis, spike waveform-based membership (narrow vs. wide) was fixed; narrow (wide) spiking neurons correspond to putative inhibitory (excitatory) neurons, and the membership is not expected to change across different desflurane concentrations. Because there is only one narrow spiking neuron group, only the three wide spiking neuron groups were re-classified based on their feature values at 2%, 4%, and 6% desflurane and the K-means model defined at 0% desflurane. Under anesthesia, most neurons were classified as either wHPHF or wLPLF; there were hardly any wLPHF neurons at 4% and 6% desflurane. The number of wHPHF, wLPHF and wLPLF neurons were 30, 91, and 87 at 0%, 69, 42, and 97 at 2%, 93, 11, and 104 at 4%, and 86, 7, and 115 at 6% desflurane, respectively (see also Fig. 4B). Because we were primarily interested in how neurons with distinct baseline firing characteristics were influenced by anesthesia, in the subsequent analyses we used fixed neuron group identities as defined at 0% desflurane.
Group-dependent changes of firing rate and population coupling under anesthesia
Next, we examined the state-dependent changes of firing rate and population coupling in each neuron group as they were defined in wakefulness. The results are shown in Fig. 4C. As seen there, firing rate of nHPHF, wHPHF and wLPHF neurons gradually decreased as the anesthesia deepened. wLPLF neurons showed a similar trend but dropped their firing rate upon waking. population coupling showed the opposite trend to firing rate, it increased in all the four groups, but this increase was more pronounced in wide spiking neurons. Notice that the substantial increase in population coupling of wHPHF neurons, despite their high PC values at baseline 0% desflurane. For the nHPHF neurons, the increases from 0% to the two desflurane levels, 2% and 4% were only significant.
Increased burst firing under anesthesia
We also examined how desflurane affected the temporal pattern of neuron firing using the spike autocorrelogram. As anesthesia deepened, all neuron groups showed an increase of the autocorrelogram value near 10ms time lag (Fig. 5A). This was especially evident in wide spiking neurons. We quantitively compared these changes using burstiness, defined as the ratio between the peak (maximum autocorrelogram at < 50ms) and baseline (mean autocorrelogram at [50, 100] ms). The burstiness of all neuron groups increased in anesthesia (Fig. 5B).
Fig. 5.
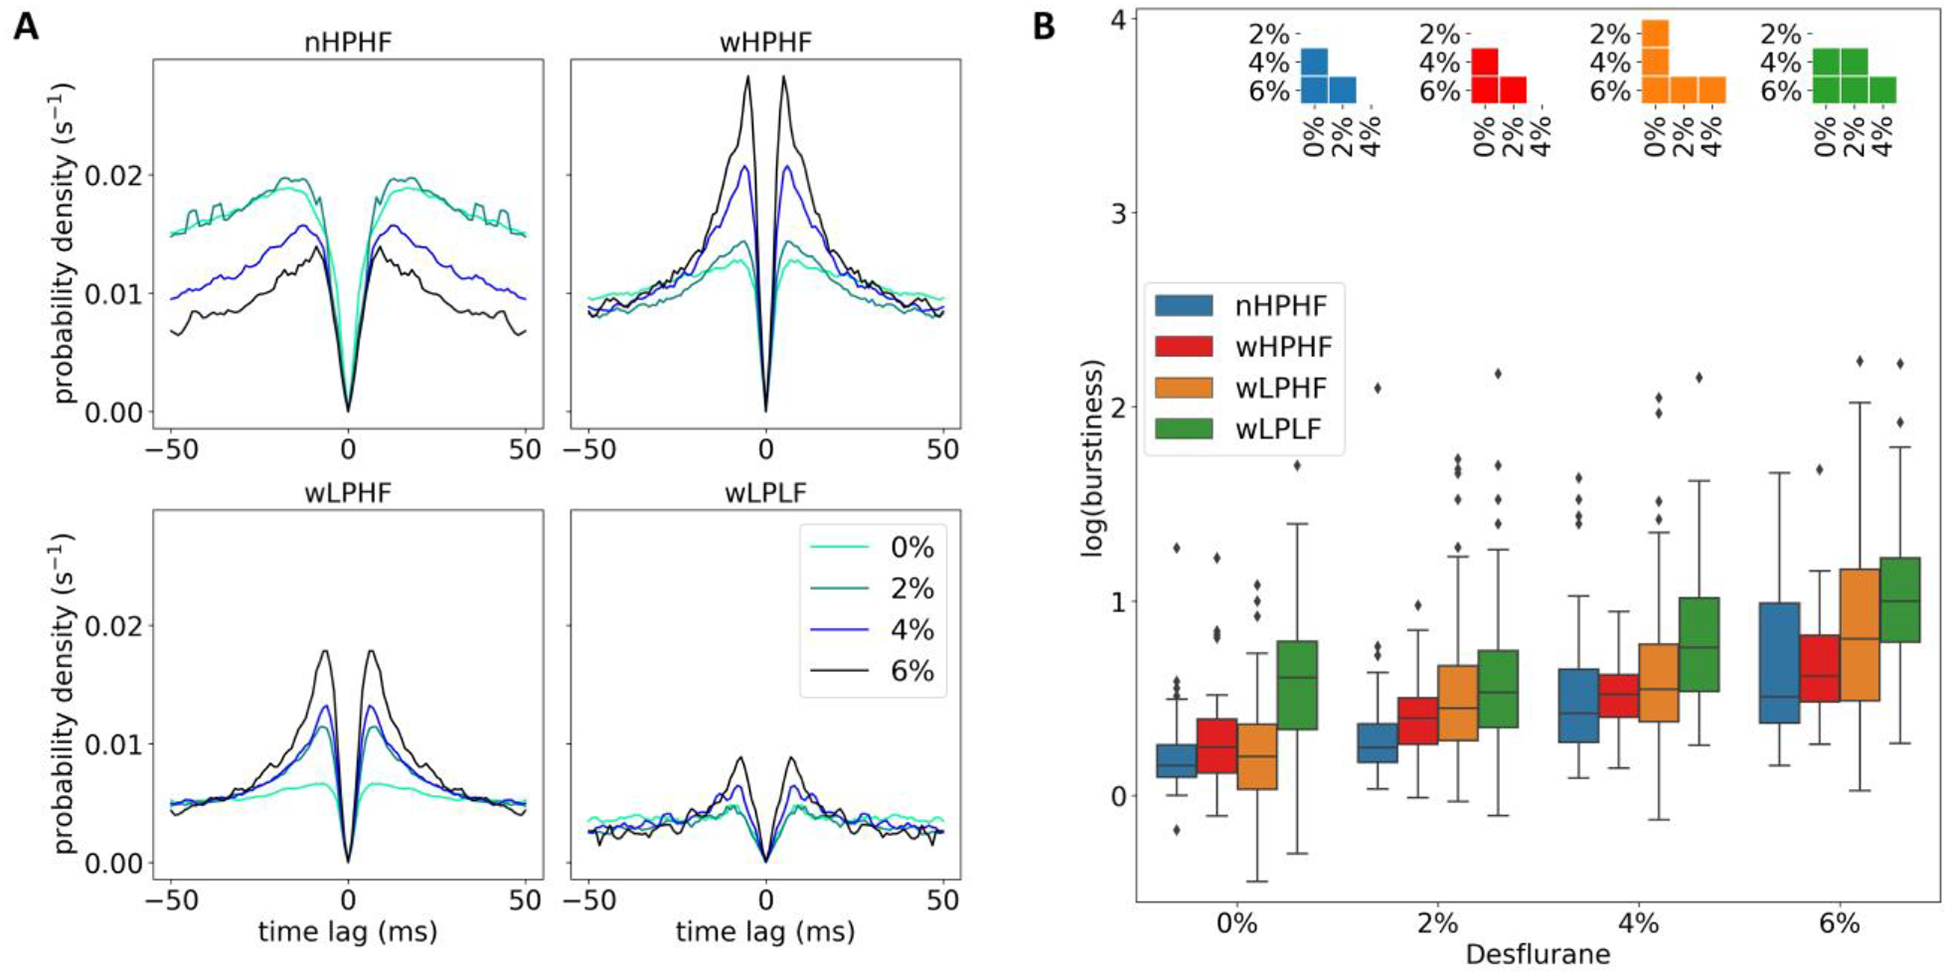
Effect of anesthesia on autocorrelogram and burstiness of neuron firings. (A) Autocorrelogram of four neuron groups under different desflurane concentrations. (B) All neuron groups show an increasing tendency of burstiness.
Population coupling predicts pairwise correlation
Pairwise correlation of neurons reflects an important aspect of functional organization of the underlying network. The overall strength of pairwise correlation increased in anesthesia (Fig 6A, first row). In wakefulness, the correlation among nHPHF and wHPHF neurons was stronger than that of the other two groups but such a cluster-like formation diminished as the anesthesia deepened. We hypothesized that anesthesia may suppress neuron-to-neuron communication in spite of the increase in synchrony, such that pairwise correlation becomes less complex. If so, firing rate and population coupling alone would be able to predict the observed pairwise correlation. To test the hypothesis, we used a spike raster model to predict the pairwise correlation matrix from population coupling and firing rate of each neuron and the distribution of the population rate as described in Methods. The predicted correlation matrix visually resembled the observed correlation matrix (Fig. 6A, second row). In order to estimate the agreement between predicted and observed correlation, the normalized difference was calculated as |1 - Cpredicted/Cobserved|, where C stands for pairwise correlation. The matrix representation of the normalized difference (Fig. 6A, third row) indicates that the model-based prediction was significantly more accurate in anesthesia than in wakefulness (Fig. 6B, left). Likewise, all pairwise Spearman correlation between observed and predicted correlation increased from 0% desflurane to 2, 4, and 6% desflurane (Fig. 6B, right) confirming that the model predicts correlation better in anesthesia than in wakefulness.
Fig. 6.
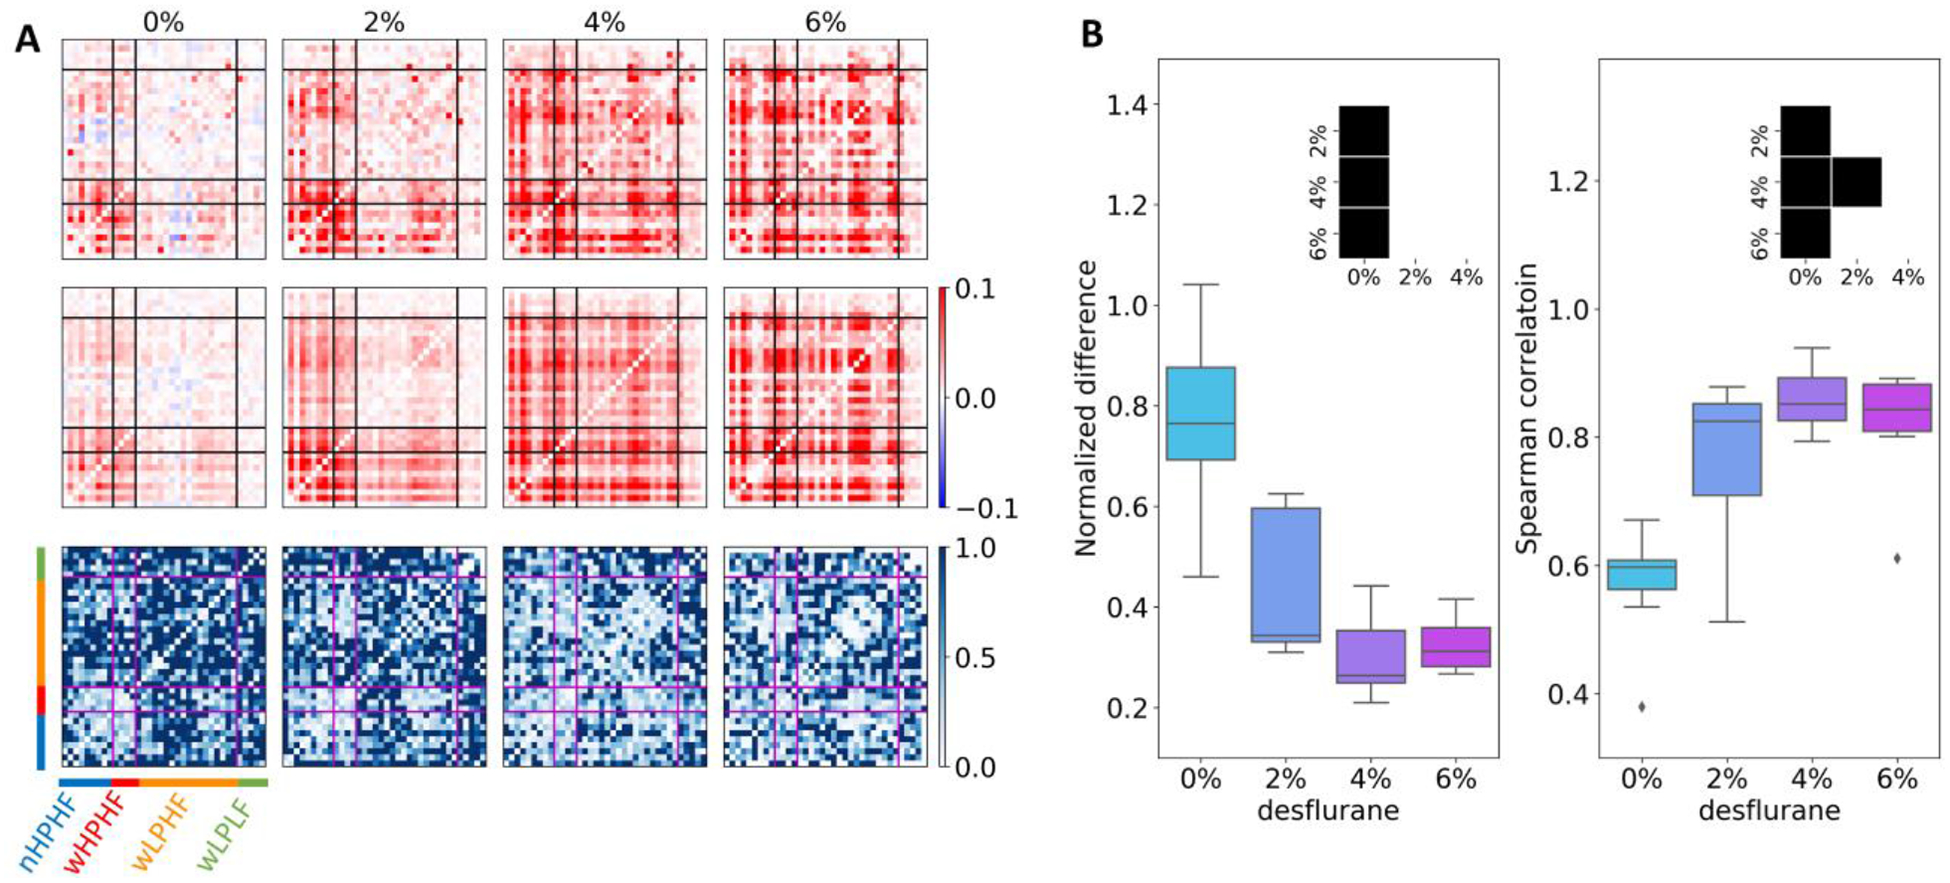
Model prediction of the pairwise correlation of spontaneous activity. (A) First row: pairwise correlation estimated from experimental data of a representative animal. Percent values on top indicate desflurane concentration. Second row: pairwise correlation predicted from a spike raster model that matches the measured values of population coupling, firing rate, and population firing rate distribution in the same animal. Third row: normalized difference between observed and predicted correlation. Horizontal and vertical lines divide neurons into four groups (blue: nHPHF, red: wHPHF, orange: wLPHF, green: wLPLF). Color bar indicates the correlation value (same for the first and second rows) and normalized difference (third row). (B) Mean normalized difference (left) and mean Spearman correlation (right) show better model prediction of pairwise correlation in anesthesia than in wakefulness. The insets indicate pairwise statistically significant difference among conditions at Bonferroni-corrected p < 0.05 with m = 6.
Altered magnitude and timing of visual response
As the main goal of the study, we examined the effect of anesthesia on the firing rate response to visual flash stimulation in the four neuron groups. Consistent with the results from spontaneous activity, average flash-induced firing rate was the highest in nHPHF and the lowest in wLPLF neurons at 0% desflurane (Fig. 7A, first column). In nHPHF, wHPHF and wLPHF neurons, the early increase in firing rate (20–200ms) was followed by a distinct suppression (dip right after the early response) and a late response (> 200ms). nHPHF neurons showed a particularly prominent peak in the early response near 100ms. The late response persisted the longest in nLPLF neurons; the time points where statistical significant response persisted were 450, 190, 280, and 130ms, for nHPHF, wHPHF, wLPHF, and wLPLF neurons, respectively. In addition, an oscillatory pattern was clearly seen in nHPHF and wLPHF neurons (p < 0.001 without Bonferroni correction).
Fig. 7.
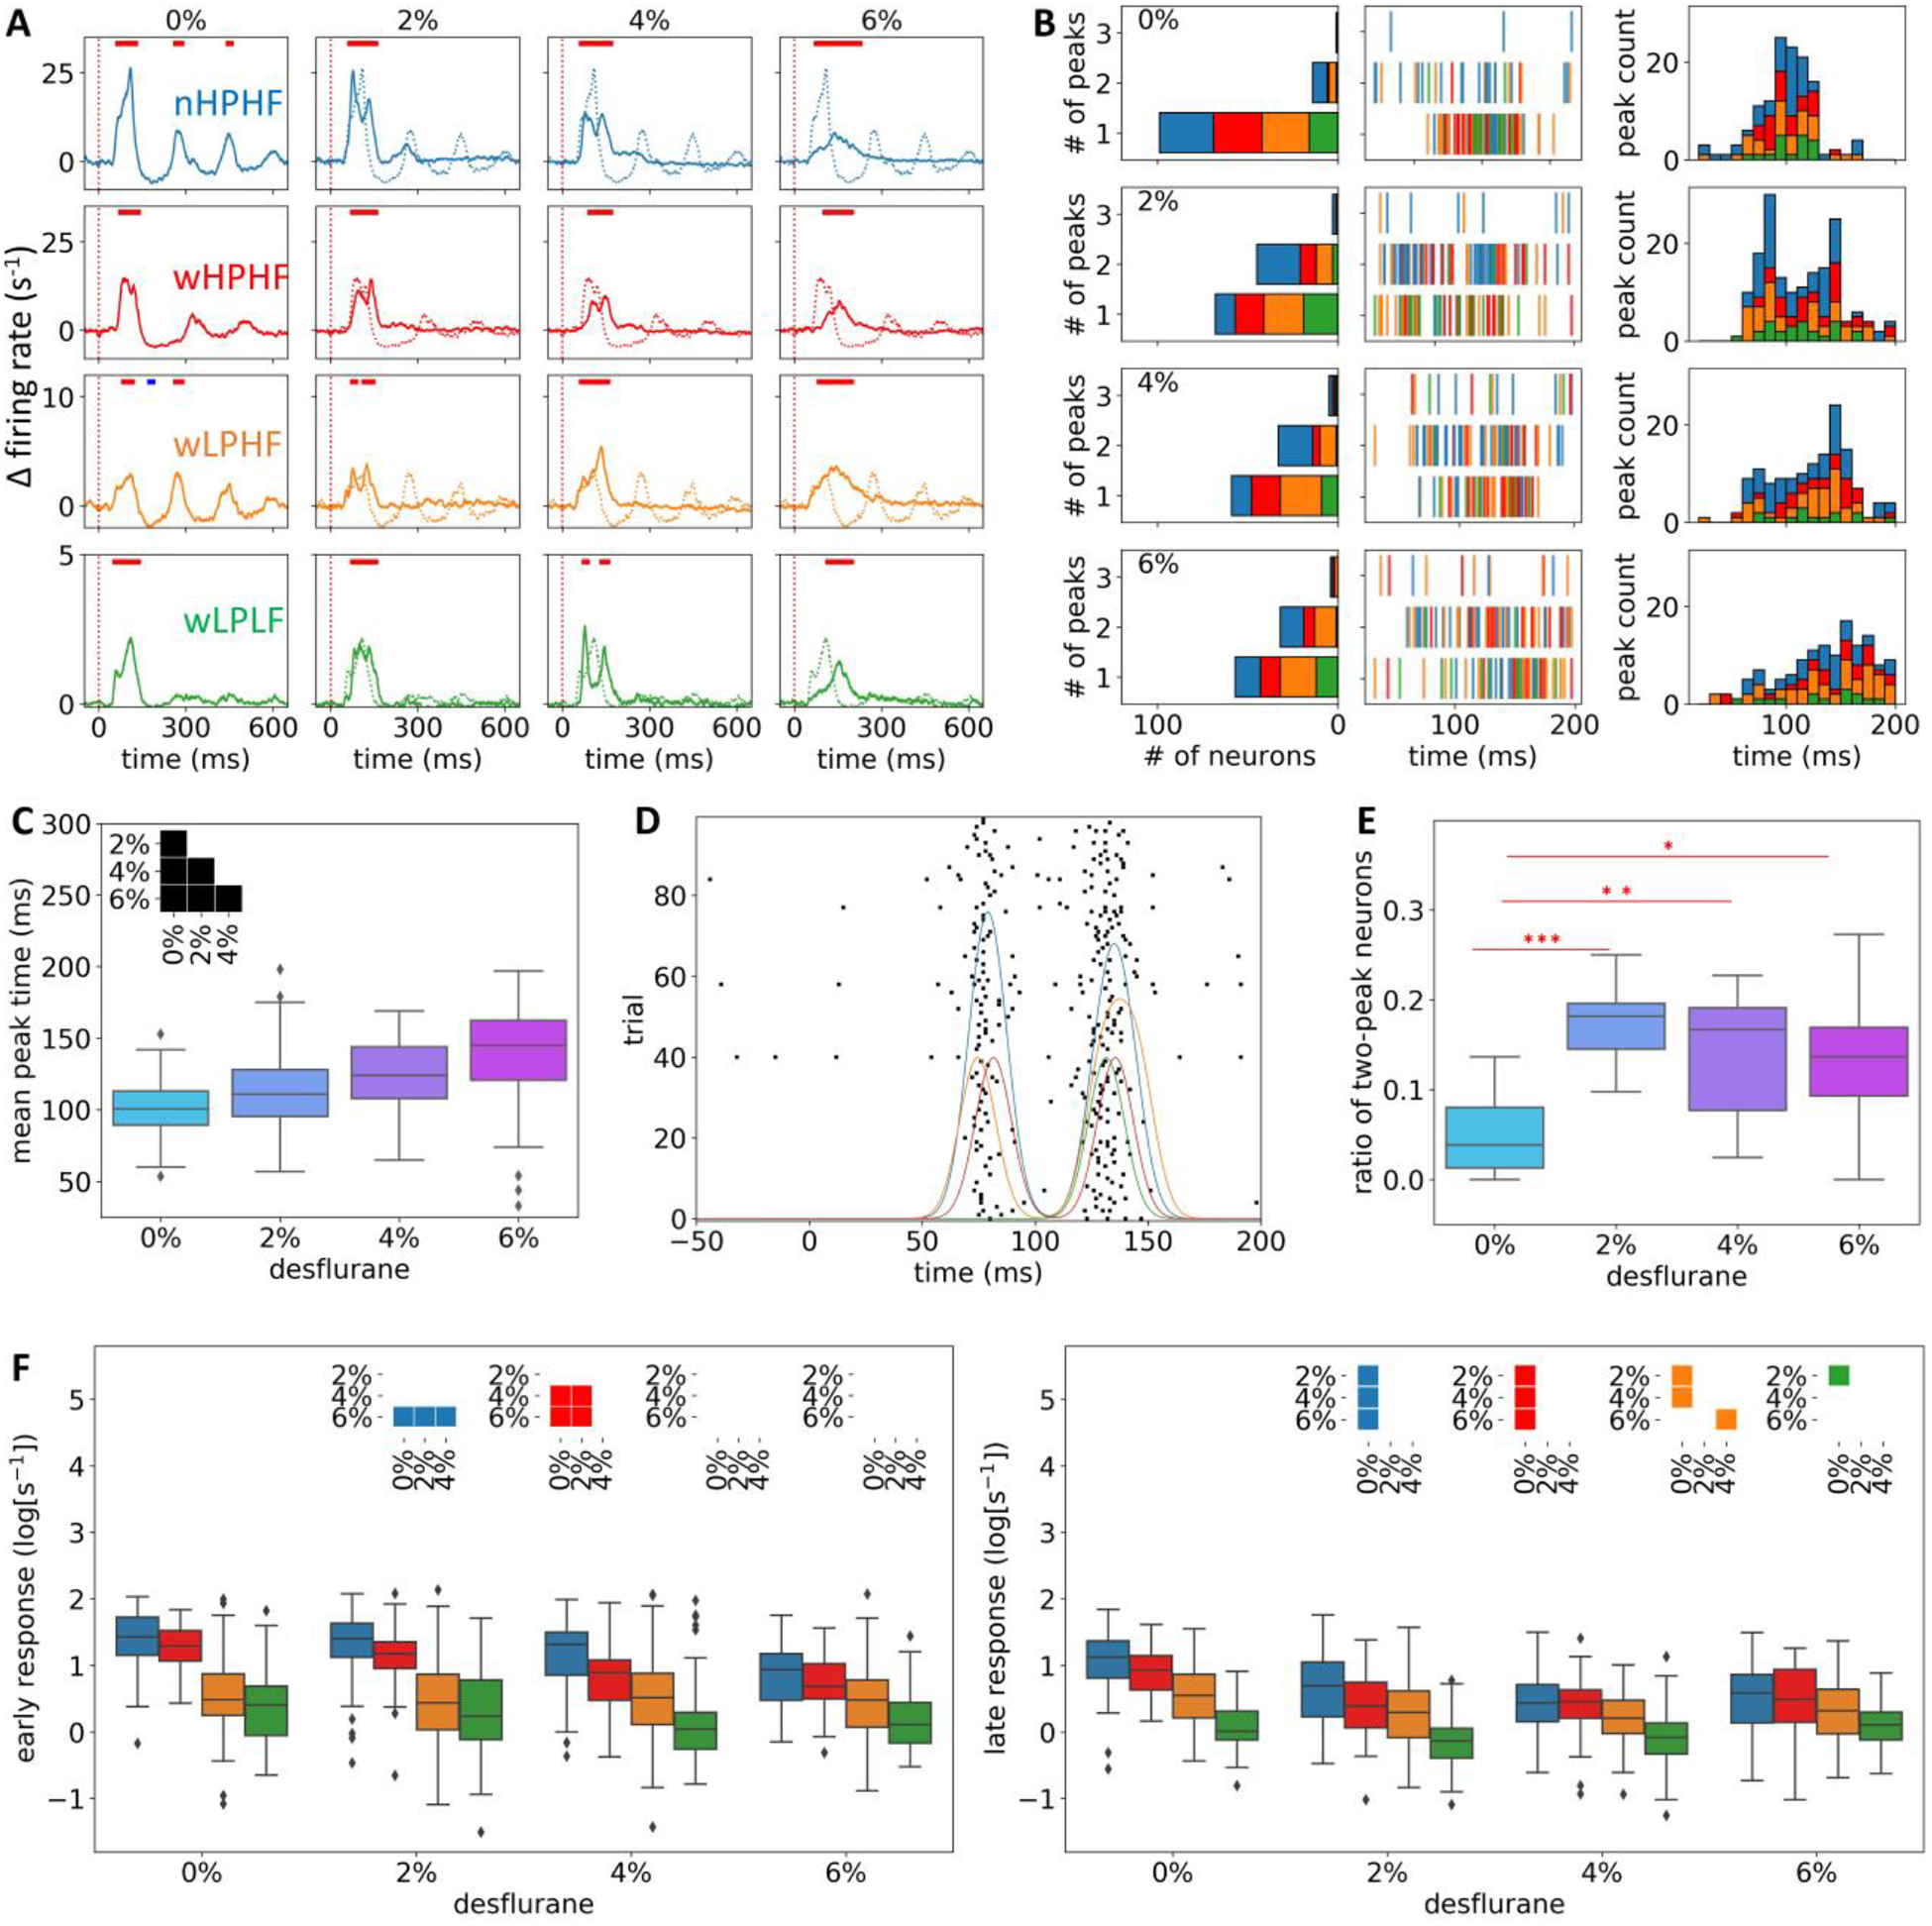
Effect of anesthesia on the neuronal response to visual flash stimulation. (A) Trace of spiking activity averaged across neurons: First row: nHPHF (blue), second row: wHPHF (red), third row: wLPHF (orange), and fourth row: wLPLF (green). Flash is delivered at 0ms (vertical red dotted line). Plotted values represent the change in spike rate compared to prestimulus baseline in −1000 to 0ms. The horizontal color bars in each panel indicate significant change (p < 0.001; no Bonferroni correction) of the firing rate at each time point compared to the prestimulus baseline (red: increase, blue: decrease). The statistical test was performed for data in 10ms time bins. (B) Change of spike timing under anesthesia. The number of spike rate peaks within 20–200ms were counted for each neuron and pooled in the stacked bar graphs for each neuron group (first column). The color code for neuronal groups is the same as in (A). The time of peak of individual neurons is displayed (second column). Stacked histogram of the peak times indicates a significant change of spike timing by the anesthetic (third column). (C) Mean peak time of all neurons (n = 251) across desflurane concentrations. The inset indicates statistically significant difference between pairs of anesthesia levels (Bonferroni corrected p < 0.05 with m = 6). (D) Raster plot of a representative nHPHF neuron across 100 trials. The four traces with different colors represent convolved spike train (Gaussian kernel, SD = 8ms) from the four representative trials of the same neuron; this visualizes that the two-peak pattern could occur in a single trial. (E) Ratio of two-peaked neurons across desflurane concentrations. The ratio was obtained in each animal (n = 7). Statistical comparisons were performed between 0% vs. 2%, 4%, and 6% desflurane. P-values were Bonferroni corrected with m = 3. (F) Relative firing activity at the peak of the early (20–150ms, left) and late (200–400ms, right) response. The insets indicate statistically significant difference between pairs of anesthesia levels (Bonferroni corrected p < 0.05 with m = 24).
In anesthesia, both the suppression and late response were diminished (Fig. 7A, columns two to four) consistent with our former study (Hudetz et al., 2009). However, the spike timing within the early response (20–200ms) was altered. First, the peak time of the early spike response was delayed; on average, 99.820 ± 19.480, 111.832 ± 25.934, 124.421 ± 23.75, and 139.068 ± 31.981ms (mean ± SD) for 0%, 2%, 4%, and 6% desflurane, respectively. For all changes from lower to higher concentration, the peak spike time significantly increased (p < 10−5, p < 10−18, p < 10−45, p < 10−4, p < 10−21, and p < 10−6 for 0 vs.2%, 0 vs. 4%, 0 vs. 6%, 2 vs. 4%, 2 vs. 6%, and 4 vs. 6%, respectively; Fig. 7B–C). Second, the single firing rate peak in wakefulness was split into two peaks at 2% desflurane. This is further illustrated after smoothing each spike train with 20ms moving average (Fig. 7B). Furthermore, the two-peak pattern often showed in individual trials (Fig. 7D). We calculated the ratio of two-peak neurons in each animal (Fig. 7E); there were significant increases in the ratio from 0% to 2%, 4%, and 6% desflurane (p < 10−4, p = 0.017, and p = 0.025 for 0% vs. 2%, 0% vs. 4%, and 0% vs. 6%, respectively). The two-peak pattern at 2% desflurane was most frequently seen in the nHPHF group (53.3% of two-peaks were in nHPHF neurons; Fig. 7B), which is large considering the small number of these neurons (43 out of 251). From 2% to 6%, the two-peaks pattern diminished (Fig. 7B, rows three and four) and spike timing was delayed (Fig 7C).
We also quantified the magnitude (firing rate at peak response) of the early and late response (20–150ms and 200–400ms, respectively) and examined their changes across different levels of anesthesia (Fig. 7F). The peak firing activity was normalized by division of the mean baseline (−1000 to −1ms to stimulus onset) firing rate in each concentration, and log-transformed. Only nHPHF and wHPHF neurons showed a statistically significant decrease in early response from wakefulness to anesthesia (left panel in Fig. 7F). The late response was clearly attenuated in nHPHF, wHPHF, and wLPHF neurons. For the case of wLPLF neurons, there was a significant decrease in the late response from 0% to 2% only.
In summary, the latter findings confirm that desflurane anesthesia generally suppresses the late response of neurons more than their early response. However, the nHPHF and wHPHF neurons displayed a reduction of early response as well. The spike timing of early response was split at 2% desflurane and delayed as deepening of anesthesia.
Discussion
The goal of this study was to determine how the firing patterns of individual neurons during spontaneous activity and visual stimulation are altered at graded levels of anesthesia. We classified neurons into four groups based on the neurons’ spontaneous firing rate and population coupling in wakefulness and their waveform feature (trough-to-peak time), and followed the behavior of the same neuron groups in the anesthetized states. We found that in wakefulness, many of the wide spiking, high-firing rate neurons had low population coupling (soloists). Under anesthetized conditions these neurons became either highly coupled (choristers) or inactive. Firing rate and population coupling predicted the pairwise correlation between neurons more accurately in anesthesia than in wakefulness. The late spike response of high-firing neurons to visual stimulation was reduced in anesthesia; while the spike timing of the early response of highly coupled high-firing neurons was split and delayed suggesting a neuron type-specific impediment of sensory processing in anesthesia.
Absence of high-firing soloist neurons in anesthesia
As anesthesia deepened, the population coupling and firing rate of each neuron became increasingly correlated, meaning that most high-firing neurons acted as choristers and low-firing neurons acted as soloists. The number of wLPHF neurons, the actively firing soloists, was profoundly decreased. Moreover, the population coupling of virtually all neurons significantly increased in anesthesia. As the spikes of individual neurons were constrained to population activity, firing synchrony was enhanced. The potentiation of postsynaptic γ-aminobutyric acid (GABAA) receptors is the most pronounced effect of inhalational anesthetic agents (Franks and Lieb, 1994; Alkire et al., 2008); thus anesthetics are presumed to suppresses reverberatory excitation which is required for neural network synchrony and burst firings (Compte et al., 2003). Therefore, the mechanism by which anesthetics promote synchronous population activity, such as slow oscillation and burst-suppression has not been fully elucidated. Multiple mechanisms, for example, extrasynaptic GABAA-induced tonic induction (Hashemi et al., 2014), suppression of metabolic rate (Cunningham et al., 2006; Ching et al., 2012), thalamocortical interaction (Destexhe, 2000), and the slow dynamic modulation of synaptic resources (Liley and Walsh, 2013) have been proposed. A plausible consequence of increasingly synchronous firing is a decrease in capacity for information processing; individual neurons only fire when the population fires, reducing the chance for processing a diverse content of sensory information (Izhikevich, 2006).
The presence of a large number of wLPHF neurons rules out a possibility of slow synchronous population activity. Conversely, the decrease in wLPHF neuron population implies synchronous population activity. Considering the fact that soloists respond to sensory stimuli in a selective and precise manner (Bachatene et al., 2015; Clawson et al., 2018), one could surmise that the absence of the actively firing soloists in anesthesia could be strongly associated with the disruption of conscious sensory information processing. This proposition is consistent with anesthetic-related changes in large-scale brain activity such as electroencephalogram, which exhibits slow oscillation, low-frequency synchronization (0.1–5 Hz), or suppressed signal complexity as typical signatures of anesthetic-induced unconsciousness (Lewis et al., 2012; Akeju et al., 2014a; Hudetz et al., 2016; Wang et al., 2017).
Increased pairwise correlation, decreased diverse communication
The prediction of pairwise correlation of neurons’ firing by their population coupling and firing rate distribution was more accurate in anesthesia than in wakefulness. This means that during anesthesia there was little information in the neuron-to-neuron correlation in excess of that of which the population had. That is, the enhanced pairwise correlation between neurons under anesthesia (Goltstein et al., 2015; Aasebø et al., 2017) can be attributed to a simple, collective dynamic behavior of cortical neurons rather than to a diverse, informationally-rich communication. In the wakeful state, on the other hand, the prediction of pairwise correlation was less precise and the rank correlation between observed and predicted pairwise correlations was low suggesting a greater diversity of neural communication independent of population activity. Similar results were also found at larger-scale cortical network; electroencephalogram studies of human and rodent revealed that anesthetics enhanced synchronization whereas the diversity of functional connectivity pattern was profoundly suppressed (Hudetz, 2002; Lee et al., 2017, 2019).
Population coupling rank is preserved across different anesthetic conditions
We found the rank of population coupling was conserved across the anesthetic conditions including wakefulness both in resting and stimulation-induced activities. Previously, chorister neurons were reported as responsive (Okun et al., 2015) but non-selective to the sensory stimuli (Bachatene et al., 2015; Clawson et al., 2018). In our study, choristers, the nHPHF and wHPHF neurons, showed the strongest response to visual stimulation among the four neuron groups. This may be related to the choristers’ stronger functional interconnection, as we indeed found. Although a high value of population coupling does not necessarily indicate a strong synaptic connectivity, Okun et al., observed that choristers tend to receive more synaptic inputs from their neighbors, suggesting that chorister-soloist characteristics could be attributed to anatomical connectivity structure and therefore, were invariant at short timescale (< days)(Okun et al., 2015). Thus, our observations extend the generality of Okun et al.’s finding suggesting population coupling is largely preserved with respect to different anesthetic conditions and determined by structural connectivity.
Late response to visual stimuli is suppressed by anesthesia
We found that the late spike response (200–400ms) of high-firing neurons was significantly lower in the anesthetized than in the wakeful state. In wakefulness, narrow spiking high-firing chorister neurons exhibited sustained spike activity (~450ms) than other groups and uniquely exhibited a distinct, slow oscillatory pattern. Also, both narrow- and wide spiking high-firing chorister neurons showed a large early response and early attenuation of their late response. Prior studies using stimulation-evoked potentials reported that primary sensory cortex remains responsive to sensory stimuli even under moderate level of anesthesia (Imas et al., 2005; Hudetz et al., 2009; Raz et al., 2014). It has been postulated that conscious experience is more correlated with late responses (>270 ms) of high-order cortical areas, which integrate neural activity beyond the primary sensory regions (Del Cul et al., 2007; Garrido et al., 2007). The late component of evoked potentials and neuron firings have been thought to reflect reentrant processing, which appear to be preferentially suppressed in association with anesthetic-induced unconsciousness (Imas et al., 2005; Hudetz et al., 2009, 2020). Based on our present finding we now suggest that the depression of the late spike response extend the previous findings by measuring spike response of individual neurons grouped by firing rate, population coupling and spike waveform.
Spike pattern of early response of choristers is altered in anesthesia
At variance with previous findings (Howard et al., 2000; Imas et al., 2005; Hudetz et al., 2009), the early flash-induced spike response was not always preserved, as the spike response magnitude progressively decreased in deeper anesthesia (4–6%). Notice that only the nHPHF and wHPHF neurons, which comprise 29.1% of total population, showed a reduction of both early and late spike responses. This may explain the discrepancy with the previous studies, which investigated evoked LFP potentials (Howard et al., 2000; Imas et al., 2005; Raz et al., 2014) or population spike rates (Hudetz et al., 2009), so that the changes in spike activity of individual neurons might not be detected. In addition to the reduced magnitude of spike rate, the early response of nHPHF neurons split into two peaks at the lowest anesthesia level (2%). Considering the fact that neurons may communicate using spike-timing codes (Thorpe et al., 2001; Izhikevich, 2006) in addition to spike-rate codes (Adrian and Zotterman, 1926), an altered spike timing accuracy may cause a disruption of information processing. This, together with the reduced early response of chorister neurons, may also cause the suppression of the late response. In agreement with our findings, a recent study of single-unit recordings in rat primary visual cortex under anesthesia found that the latency to visual stimulation was delayed along with an altered temporal sequence of neuronal firings (Aasebø et al., 2017). Thus, our findings show that classifying neurons into functional groups can reveal additional details of the state-dependent alterations in the neurons’ sensory response that are not discernible when pooling neurons into a single population.
Firing rate and population coupling are positively correlated
We found a significant positive relationship between firing rate and population coupling at all levels of anesthesia and in the wakeful state, suggesting that the neurons with high population coupling value (choristers) are likely high-firing neurons (Bachatene et al., 2015; Clawson et al., 2018). The robust positive correlation between firing rate and population coupling across different conditions is understandable given that spikes themselves, in part, are a result of synaptic interactions. On the other hand, Okun et al., found a negative relationship between firing rate and population coupling (Okun et al., 2015). We suggest that this discrepancy may be explained by a difference in the method of calculation of population coupling. In Okun et al., population coupling was defined as a normalized spike-triggered population rate, which only takes into account the degree of instantaneous population rate when a single neuron emits spikes and does not consider whether the single neuron fires given a high instantaneous population rate. Therefore, according to their method, if a sparse-firing neuron fired a few times synchronously with population activity, it was considered as a chorister, although the neuron often missed spikes when population rate was high. We calculated population coupling based on correlation between convolved SUA and MUA (population rate), which provides a stricter criterion for identification of choristers. In order for a neuron to be a strong chorister, it should conform to the population over the entire time period. The discrepancy between the results from the two methods of calculation is negligible for high-firing neurons but it is pronounced for low-firing neurons; this leads to the opposite firing rate-population coupling relationship.
Limitations
This study has several limitations. First, we used only a single anesthetic, desflurane. Anesthetics of different pharmacological classes exert a variety of effects on synaptic transmission and may influence the activity of various types of neurons differently (Hemmings et al., 2019). Nevertheless, desflurane can be considered a prototypical agent with its GABAA-potentiating effect shared by most inhalational anesthetics. Comparison with other types of anesthetics (e.g., intravenous agents such as propofol or ketamine that have substantially distinct molecular effects) would be of interest in the future to separate the common and drug-specific effects on sensory processing. Second, we used a simple flash stimulus instead of more complex moving grating or checkerboard stimuli. A flash of light is considered a modality-specific arousal stimulus that provides a stimulus time reference that aids to correlate neuron activities on a short time scale. Moreover, the transcranial illumination technique that we used (Hudetz et al., 2015; Todorov et al., 2016) has the advantage that it provides even illuminations of the retina, activating the maximum number of neurons with constant intensity across different trials and across different levels of anesthesia free from confounding factors such as a change in pupil diameter. Future studies may employ complex stimuli in head-fixed animals or direct neuronal stimulation using optogenetics to provide more detailed insight into the local circuit mechanism of anesthesia and consciousness. Lastly, it is not clear whether our findings reflect an effect of anesthesia on synapses in the cortex or secondary to metabolic activity. Multi-modal measurements and computational modeling studies could illuminate the deeper relationship between molecular actions of anesthesia, neurophysiological features, and behavioral states, providing an integrative understanding of anesthetic-induced altered states of consciousness.
Conclusions
Desflurane anesthesia produced a strong association between firing rate and population coupling, suppressing population-independent spike activity. Classification of neurons into functional groups helped reveal additional details of the effect of anesthesia, particularly on the behavior of high-firing highly coupled neurons, which may interfere visual information processing.
Highlights.
Neurons in V1 were classified based on firing rate, population coupling and spike width. The classified groups showed distinct spike patterns in response to flash stimuli. Anesthesia promoted the association between population coupling and firing rate, suppressed the flash response, delayed and split the spike timing of high-firing highly coupled neurons.
Acknowledgements:
Research reported in this publication was supported by the National Institute of General Medical Sciences of the National Institutes of Health under award number R01-GM056398 and the Center for Consciousness Science, Department of Anesthesiology, University of Michigan Medical School, Ann Arbor, Michigan, USA. The content is solely the responsibility of the authors and does not necessarily represent the official views of the National Institutes of Health. The authors thank members of the Center for Consciousness Science, University of Michigan Medical School, for valuable comments and Kathy Zelenock, MS for her assistance in laboratory operations and manuscript editing.
Footnotes
Publisher's Disclaimer: This is a PDF file of an unedited manuscript that has been accepted for publication. As a service to our customers we are providing this early version of the manuscript. The manuscript will undergo copyediting, typesetting, and review of the resulting proof before it is published in its final form. Please note that during the production process errors may be discovered which could affect the content, and all legal disclaimers that apply to the journal pertain.
Conflicts of Interest: None
A preliminary version of this paper was posted at BioRxiv https://doi.org/10.1101/2020.06.13.150284 on June 14, 2020.
References
- Aasebø IEJ, Lepperød ME, Stavrinou M, Nøkkevangen S, Einevoll G, Hafting T, Fyhn M (2017) Temporal processing in the visual cortex of the awake and anesthetized rat. eNeuro 4:e0059. [DOI] [PMC free article] [PubMed] [Google Scholar]
- Adrian ED, Zotterman Y (1926) The impulses produced by sensory nerve‐endings: Part II. The response of a Single End‐Organ. J Physiol 61:151–171. [DOI] [PMC free article] [PubMed] [Google Scholar]
- Akeju O, Loggia ML, Catana C, Pavone KJ, Vazquez R, Rhee J, Ramirez VC, Chonde DB, Izquierdo-Garcia D, Arabasz G, Hsu S, Habeeb K, Hooker JM, Napadow V, Brown EN, Purdon PL (2014a) Disruption of thalamic functional connectivity is a neural correlate of dexmedetomidine-induced unconsciousness. Elife 3:1–23. [DOI] [PMC free article] [PubMed] [Google Scholar]
- Akeju O, Westover MB, Pavone KJ, Sampson AL, Hartnack KE, Brown EN, Purdon PL (2014b) Effects of sevoflurane and propofol on frontal electroencephalogram power and coherence. Anesthesiology. [DOI] [PMC free article] [PubMed] [Google Scholar]
- Alkire MT, Hudetz AG, Tononi G (2008) Consciousness and Anesthesia. 322:876–880. [DOI] [PMC free article] [PubMed] [Google Scholar]
- Bachatene L, Bharmauria V, Cattan S, Chanauria N, Rouat J, Molotchnikoff S (2015) Electrophysiological and firing properties of neurons: Categorizing soloists and choristers in primary visual cortex. Neurosci Lett 604:103–108. [DOI] [PubMed] [Google Scholar]
- Barthó P, Hirase H, Monconduit L, Zugaro M, Harris KD, Buzsáki G (2004) Characterization of neocortical principal cells and interneurons by network interactions and extracellular features. J Neurophysiol 92:600–608. [DOI] [PubMed] [Google Scholar]
- Ching SN, Purdon PL, Vijayan S, Kopell NJ, Brown EN (2012) A neurophysiological-metabolic model for burst suppression. Proc Natl Acad Sci U S A 109:3095–3100. [DOI] [PMC free article] [PubMed] [Google Scholar]
- Clawson BC, Durkin J, Suresh AK, Pickup EJ, Broussard CG, Aton SJ (2018) Sleep promotes, and sleep loss inhibits, selective changes in firing rate, response properties and functional connectivity of primary visual cortex neurons. Front Syst Neurosci 12:1–16. [DOI] [PMC free article] [PubMed] [Google Scholar]
- Compte A et al. (2003) Cellular and network mechanisms of slow oscillatory activity (<1 Hz) and wave propagations in a cortical network model. J Neurophysiol 89:2707–2725. [DOI] [PubMed] [Google Scholar]
- Csicsvari J, Hirase H, Czurko A, Buzsáki G (1998) Reliability and state dependence of pyramidal cell-interneuron synapses in the hippocampus: An ensemble approach in the behaving rat. Neuron 21:179–189. [DOI] [PubMed] [Google Scholar]
- Cunningham MO, Pervouchine DD, Racca C, Kopell NJ, Davies CH, Jones RSG, Traub RD, Whittington MA (2006) Neuronal metabolism governs cortical network response state. Proc Natl Acad Sci U S A 103:5597–5601. [DOI] [PMC free article] [PubMed] [Google Scholar]
- Del Cul A, Baillet S, Dehaene S (2007) Brain dynamics underlying the nonlinear threshold for access to consciousness. PLoS Biol 5:e260. [DOI] [PMC free article] [PubMed] [Google Scholar]
- Destexhe A (2000) Modelling corticothalamic feedback and the gating of the thalamus by the cerebral cortex. J Physiol Paris 94:391–410. [DOI] [PubMed] [Google Scholar]
- Erchova IA, Lebedev MA, Diamond ME (2002) Somatosensory cortical neuronal population activity across states of anaesthesia. Eur J Neurosci 15:744–752. [DOI] [PubMed] [Google Scholar]
- Franks NP, Lieb WR (1994) Molecular and cellular mechanisms of general anaesthesia. Nature 367:607–614. [DOI] [PubMed] [Google Scholar]
- Garrido MI, Kilner JM, Kiebel SJ, Friston KJ (2007) Evoked brain responses are generated by feedback loops. Proc Natl Acad Sci U S A 104:20961–20966. [DOI] [PMC free article] [PubMed] [Google Scholar]
- Goltstein PM, Montijn JS, Pennartz CMA (2015) Effects of isoflurane anesthesia on ensemble patterns of Ca2+ activity in mouse V1: Reduced direction selectivity independent of increased correlations in cellular activity. PLoS One 10:e0118277. [DOI] [PMC free article] [PubMed] [Google Scholar]
- Gulati T, Ramanathan DS, Wong CC, Ganguly K (2014) Reactivation of emergent task-related ensembles during slow-wave sleep after neuroprosthetic learning. Nat Neurosci 17:1107–1113. [DOI] [PMC free article] [PubMed] [Google Scholar]
- Hashemi M, Hutt A, Sleigh J (2014) Anesthetic action on extra-synaptic receptors: Effects in neural population models of EEG activity. Front Syst Neurosci 8:1–11. [DOI] [PMC free article] [PubMed] [Google Scholar]
- Hemmings HC, Riegelhaupt PM, Kelz MB, Solt K, Eckenhoff RG, Orser BA, Goldstein PA (2019) Towards a comprehensive understanding of anesthetic mechanisms of action: a decade of discovery. Trends Pharmacol Sci 40:464–481. [DOI] [PMC free article] [PubMed] [Google Scholar]
- Howard MA, Volkov IO, Mirsky R, Garell PC, Noh MD, Granner M, Damasio H, Steinschneider M, Reale RA, Hind JE, Brugge JF (2000) Auditory cortex on the human posterior superior temporal gyrus. J Comp Neurol 416:79–92. [DOI] [PubMed] [Google Scholar]
- Hudetz AG (2002) Effect of volatile anesthetics on interhemispheric EEG cross-approximate entropy in the rat. Brain Res 954:123–131. [DOI] [PubMed] [Google Scholar]
- Hudetz AG, Liu X, Pillay S, Boly M, Tononi G (2016) Propofol anesthesia reduces Lempel-Ziv complexity of spontaneous brain activity in rats. Neurosci Lett 628:132–135. [DOI] [PMC free article] [PubMed] [Google Scholar]
- Hudetz AG, Pillay S, Wang S, Lee H (2020) Desflurane anesthesia alters cortical layer-specific hierarchical interactions in rat cerebral cortex. Anesthesiology 132:1080–1090. [DOI] [PMC free article] [PubMed] [Google Scholar]
- Hudetz AG, Vizuete JA, Imas OA (2009) Desflurane selectively suppresses long-latency cortical neuronal response to flash in the rat. Anesthesiology 111:231–239. [DOI] [PMC free article] [PubMed] [Google Scholar]
- Hudetz AG, Vizuete JA, Pillay S, Ropella KM (2015) Critical changes in cortical neuronal interactions in anesthetized and awake rats. Anesthesiology 123:171–180. [DOI] [PMC free article] [PubMed] [Google Scholar]
- Hung CP, Cui D, Chen YP, Lin CP, Levine MR (2015) Correlated activity supports efficient cortical processing. Front Comput Neurosci 8:171. [DOI] [PMC free article] [PubMed] [Google Scholar]
- Imas OA, Ropella KM, Ward BD, Wood JD, Hudetz AG (2005) Volatile anesthetics enhance flash-induced γ oscillations in rat visual cortex. Anesthesiology 102:937–947. [DOI] [PubMed] [Google Scholar]
- Izhikevich EM (2006) Polychronization: computation with spikes. Neural Comput 18:245–282. [DOI] [PubMed] [Google Scholar]
- Kajiwara M, Kato R, Oi Y, Kobayashi M (2020) Propofol decreases spike firing frequency with an increase in spike synchronization in the cerebral cortex. J Pharmacol Sci 142:83–92. [DOI] [PubMed] [Google Scholar]
- Lee H, Golkowski D, Jordan D, Berger S, Ilg R, Lee J, Mashour GA, Lee U (2019) Relationship of critical dynamics, functional connectivity, and states of consciousness in large-scale human brain networks. Neuroimage 188:228–238. [DOI] [PubMed] [Google Scholar]
- Lee H, Noh G, Joo P, Choi B, Silverstein BH, Kim M, Wang J, Jung W, Kim S (2017) Diversity of functional connectivity patterns is reduced in propofol-induced unconsciousness. 38:4980–4995. [DOI] [PMC free article] [PubMed] [Google Scholar]
- Lee H, Wang S, Hudetz AG (2020) State-Dependent Cortical Unit Activity Reflects Dynamic Brain State Transitions in Anesthesia. J Neurosci. [DOI] [PMC free article] [PubMed] [Google Scholar]
- Lewis LD, Weiner VS, Mukamel EA, Donoghue JA, Eskandar EN, Madsen JR, Anderson WS, Hochberg LR, Cash SS, Brown EN, Purdon PL (2012) Rapid fragmentation of neuronal networks at the onset of propofol-induced unconsciousness. Proc Natl Acad Sci U S A 109:E3377–E3386. [DOI] [PMC free article] [PubMed] [Google Scholar]
- Liley DTJ, Walsh M (2013) The mesoscopic modeling of burst suppression during anesthesia. 7:1–12. [DOI] [PMC free article] [PubMed] [Google Scholar]
- Okun M, Steinmetz NA, Cossell L, Iacaruso MF, Ko H, Barthó P, Moore T, Hofer SB, Mrsic-Flogel TD, Carandini M, Harris KD (2015) Diverse coupling of neurons to populations in sensory cortex. Nature 521:511–515. [DOI] [PMC free article] [PubMed] [Google Scholar]
- Purdon PL et al. (2013) Electroencephalogram signatures of loss and recovery of consciousness from propofol. Proc Natl Acad Sci 110:E1142–E1151. [DOI] [PMC free article] [PubMed] [Google Scholar]
- Raz A, Grady SM, Krause BM, Uhlrich DJ, Manning KA, Banks MI (2014) Preferential effect of isoflurane on top-down vs. bottom-up pathways in sensory cortex. Front Syst Neurosci 8:1–22. [DOI] [PMC free article] [PubMed] [Google Scholar]
- Sellers KK, Bennett DV., Hutt A, Fröhlich F (2013) Anesthesia differentially modulates spontaneous network dynamics by cortical area and layer. J Neurophysiol 110:2739–2751. [DOI] [PubMed] [Google Scholar]
- Sirota A, Montgomery S, Fujisawa S, Isomura Y, Zugaro M, Buzsáki G (2008) Entrainment of neocortical neurons and gamma oscillations by the hippocampal theta rhythm. Neuron 60:683–697. [DOI] [PMC free article] [PubMed] [Google Scholar]
- Szabó-Salfay O, Pálhalmi J, Szatmári E, Barabás P, Szilágyi N, Juhász G (2001) The electroretinogram and visual evoked potential of freely moving rats. Brain Res Bull 56:7–14. [DOI] [PubMed] [Google Scholar]
- Thorpe S, Delorme A, Van Rullen R (2001) Spike-based strategies for rapid processing. Neural Networks 14:715–725. [DOI] [PubMed] [Google Scholar]
- Todorov MI, Kekesi KA, Borhegyi Z, Galambos R, Hudetz AG (2016) Retino-cortical stimulus frequency-dependent gamma coupling : evidence and functional implications of oscillatory potentials. Physiol Rep 4:e12986. [DOI] [PMC free article] [PubMed] [Google Scholar]
- Vizuete JA, Pillay S, Ropella KM, Hudetz AG (2014) Graded defragmentation of cortical neuronal firing during recovery of consciousness in rats. Neuroscience 275:340–351. [DOI] [PMC free article] [PubMed] [Google Scholar]
- Vyazovskiy VV, Olcese U, Hanlon EC, Nir Y, Cirelli C, Tononi G (2011) Local sleep in awake rats. Nature 472:443–447. [DOI] [PMC free article] [PubMed] [Google Scholar]
- Wang J, Noh GJ, Choi BM, Ku SW, Joo P, Jung WS, Kim S, Lee H (2017) Suppressed neural complexity during ketamine- and propofol-induced unconsciousness. Neurosci Lett 653:320–325. [DOI] [PubMed] [Google Scholar]
- Yger P, Spampinato GLB, Esposito E, Lefebvre B, Deny S, Gardella C, Stimberg M, Jetter F, Zeck G, Picaud S, Duebel J, Marre O (2018) A spike sorting toolbox for up to thousands of electrodes validated with ground truth recordings in vitro and in vivo. Elife 7:1–23. [DOI] [PMC free article] [PubMed] [Google Scholar]