Abstract
Cytochrome P450 1A2 (CYP1A2) is one of the main hepatic CYPs involved in metabolism of carcinogens and clinically used drugs. Nonsynonymous single nucleotide polymorphisms (nsSNPs) of this enzyme could affect cancer susceptibility and drug efficiency. Hence, identification of human CYP1A2 pathogenic nsSNPs could be of great importance in personalized medicine and pharmacogenetics. Here, 176 nsSNPs of human CYP1A2 were evaluated using a variety of computational tools, of which 18 nsSNPs were found to be associated with pathogenicity. Further analysis suggested possible association of 9 nsSNPs (G73R, G73W, R108Q, R108W, E168K, E346K, R431W, F432S and R456H) with the risk of hepatocellular carcinoma. Molecular dynamics simulations revealed higher overall flexibility, decreased intramolecular hydrogen bonds and lower content of regular secondary structures for both cancer driver variants G73W and F432S when compared to the wild-type structure. In case of F432S, loss of the conserved hydrogen bond between Arg137 and heme propionate oxygen may affect heme stability and the observed significant rise in fluctuation of the CD loop could modify CYP1A2 interactions with its redox partners. Together, these findings propose CYP1A2 as a possible candidate for hepatocellular carcinoma and provide structural insights into how cancer driver nsSNPs could affect protein structure, heme stability and interaction network.
Subject terms: Computational biology and bioinformatics, Cancer, Cancer, Molecular biology, Structural biology, Genetics
Introduction
The genome of two individuals, except for identical twins, shares 99.9% identity and only differs by 0.1%. Although, this value seems very low, it is responsible for about 3 million differences among 3.2 billion base pairs1. The most abundant genetic variations in the human genome are single nucleotide polymorphisms (SNPs) which play a significant role in the phenotypic diversity, interindividual differences in susceptibility to complex diseases and drug reactions1,2. However, a small number of the SNPs is associated with pathogenicity that must be distinguished from a pool of neutral variants. Although experimental techniques provide the most accurate and reliable approaches for assessing the consequences of a substitution, analysis of all SNPs in human genome or even in a single gene is a major challenge for researchers due to the complex, time-consuming and costly experimental procedures3. Therefore, in silico computational approaches have attracted considerable interest of biologists, as they make it possible to screen a large number of SNPs in a relatively short time and low cost, and to prioritize them for further experimental and clinical tests. Moreover, the structure–function relationship studies by molecular dynamics (MD) simulations could elucidate the molecular mechanisms of diseases and may provide valuable insights into the diagnosis as well as treatment4–7.
The human cytochrome P450 (CYP) superfamily enzymes are the most important enzymes of the phase I xenobiotic metabolism and known as one of the highly polymorphic proteins8,9. Single nucleotide polymorphisms in the enzymes of this superfamily play an important role in differences between individuals in response to drugs and other xenobiotics as well as the susceptibility to develop various diseases10. Among 18 cytochrome P450 families encoded by the human genome, members of CYP1 family are particularly important due to their major contribution to the metabolism of carcinogenic compounds such as polycyclic aromatic hydrocarbons (PAHs)11–13. This family of CYPs has three members CYP1A1, CYP1A2 and CYP1B1 grouped into A and B subfamilies11,13.
The human CYP1A2 gene is located on the long arm of chromosome 15 (15q24.1) that spans seven exons. The CYP1A2 protein is exclusively expressed in liver and plays an important role in metabolism of heterocyclic and aromatic amines, caffeine and melatonin14–18. This enzyme is also responsible for hepatic metabolism of many clinically used drugs such as tacrine, zolpidem, clozapine, theophylline and so on19–23, while the other two enzymes of this family do not have significant role in drug metabolism.
The human CYP1A2 gene encodes a heme-binding protein composed of 516 residues. The three-dimensional (3D) structure of the protein covering residues 34–513 has been determined in complex with the inhibitor α-naphthoflavone, while the structure of the N-terminal transmembrane helical domain is lost in this crystal structure14. According to the crystal structure (PDB ID: 2HI414), CYP1A2 holds fifteen α-helices and five β-sheets14. The iron atom of the heme prosthetic group is coordinated by the Cys458 of the protein moiety which belongs to the consensus signature of cytochrome P450 proteins (PROSITE signature PS00086)24. In addition, arginine 137 (R137) from C helix is hydrogen bonded to the heme propionate oxygen and further stabilizes its position.
CYPalleles is a web page which was developed to standardize the nomenclature of human cytochrome P450 alleles (http://www.cypalleles.ki.se/9). It also provides genetic information and the molecular effect of the variants on the enzyme activity. More than 20 alleles have been reported for CYP1A2 gene in CYPalleles, among them, CYP1A2*6 (R431W), CYP1A2*8 (R456H), CYP1A2*11 (F186L), CYP1A2*15 (P42R) and CYP1A2*16 (R377Q) are the most studied alleles25–29. Nevertheless, structural or functional consequences of the vast majority of nsSNPs for CYP1A2 recorded by the NCBI dbSNP database have not yet been determined. Since CYP1A2 is one of the main hepatic CYPs involved in the bioactivation of carcinogens and metabolism of clinically used drugs, SNPs of this enzyme could affect cancer susceptibility or drug efficiency. Therefore, the identification and evaluation of CYP1A2 pathogenic nonsynonymous SNPs (nsSNPs) are of major importance. This is also helpful in personalized medicine and optimization of drug treatment to achieve the most efficiency and least side effects. In this study, nsSNPs of CYP1A2 gene were evaluated by computational tools to identify pathogenic nsSNPs. We also performed MD simulation to assess how these nsSNPs affect the protein structure.
Methods
Data collection
The human CYP1A2 protein sequence was obtained from UniProt database30 (UniProt ID: P05177). SNP data for CYP1A2 gene were retrieved from NCBI dbSNP31 build 150. All nucleotide positions were related to GRCh37.p13 (hg19) annotation release 105. The three-dimensional structure of the CYP1A2 protein (PDB ID: 2HI414) was downloaded from Protein Data Bank (https://www.rcsb.org32).
In silico evaluation of nsSNPs
In silico evaluation of CYP1A2 nsSNPs was performed using a variety of computational tools in a stepwise fashion where the output of each step was served as the input for the next one. SIFT33, PROVEAN34, MutationAssessor35, EFIN36, LRT37, FATHMM-MKL38, PhD-SNP39, and CADD40 are sequence-based predictors which could be easily applied to amino acid or nucleotide sequences. PolyPhen241, SNAP242, SuSPect43, PMUT44 and MutPred245 are sequence- and structure-based tools which utilize the user-provided sequence information and the self-extracted structural features to predict if SNPs are associated with functional effects.
We categorized the tools into three groups (Table 1). SIFT33, PROVEAN34, MutationAssessor35, EFIN36, LRT37, FATHMM-MKL38, CADD40, PolyPhen241 and SNAP242 were used to predict the impact of the nsSNPs on the protein function. PhD-SNP39, SuSPect43, PMUT44, MutPred245 and VEST-446 were employed to assess the likelihood that a variant is pathogenic. CHASM-3.147 was used to identify possible cancer driver variants. All prediction scores were received directly from their own web servers except for VEST-4 and CHASM-3.1 which were fetched from CRAVAT48 server. In addition to the score, VEST-4 and CHASM-3.1 also assign a p-value to each variation and an approximate false discovery rate (FDR) for each p-value. The p-value denotes the probability that benign/passenger variant is misclassified as a pathogenic/driver.
Table 1.
Classification of the methods used for in silico evaluation of CYP1A2 gene nsSNPs.
| Method | Prediction category | Prediction result |
|---|---|---|
| SIFT | Functional impact | Deleterious/Tolerated |
| PolyPhen2 | Functional impact | Probably damaging/Possibly damaging/Benign |
| PROVEAN | Functional impact | Deleterious/Neutral |
| MutationAssessor | Functional impact | High/Medium/Low/Neutral |
| SNAP2 | Functional impact | Effect/Neutral |
| LRT | Functional impact | Deleterious/Neutral |
| EFIN | Functional impact | Damaging/Neutral |
| FATHMM-MKL | Functional impact | Deleterious/Neutral |
| CADD | Functional impact | Deleterious/Neutral |
| PhD-SNP | Deleteriousness | Disease/Neutral |
| SuSPect | Deleteriousness | Disease-causing/Neutral |
| MutPred2 | Pathogenicity | Pathogenic/Benign |
| PMUT | Pathogenicity | Disease/Neutral |
| VEST-4 | Pathogenicity | Pathogenic/Benign |
| CHASM-3.1 | Cancer susceptibility | Driver/Passenger |
Evolutionary conservation analysis
The evolutionary conservation of amino acid positions was calculated with ConSurf49,50 web server which assigns a score between 1 (most variable position) and 9 (most conserved position) to each amino acid position. The protein sequence similarity searching was performed against UNIREF-90 in which CSI-BLAST (Context-Specific Iterated-Basic Local Alignment Search Tool), 3 and 0.0001 were set for homolog search algorithm, number of iteration and E-value cutoff, respectively.
Prediction of transmembrane helix
The TMHMM 2.0 (Transmembrane Hidden Markov Model)51 web server was used to predict transmembrane helices. The TMHMM incorporates hydrophobicity, charge bias, helix lengths and grammatical constraints into prediction of various regions of a transmembrane protein.
Molecular dynamics simulation
All MD simulations were conducted by GROMACS package version 5.0.552 using the CHARMM36 force field53. The crystal structure of the CYP1A2 protein (PDB ID: 2HI414) was used as the starting structure for wild-type (WT) protein after removing the ligand (alpha-naphthoflavone) atomic coordinates. The initial structure of the variant proteins was generated from WT structure using mutate tool of Swiss-Pdb Viewer v4.1.054. The proteins were immersed in a cubic box of TIP3P water molecules. An adequate number of water molecules was replaced by counter ions to neutralize the systems. Each neutralized system was then subjected to steepest descent energy minimization until the maximum force fell below 500 kJ mol−1 nm−1. In order to equilibrate the solvent and ions around the proteins, two position-restrained MD simulations were carried out. The temperature and pressure of the systems were controlled at 300 K and 1 bar by V-rescale thermostat55 and Parrinello-Rahman barostat56, respectively. After equilibration, each system was subjected to 200 ns (ns) unrestrained MD simulation considering the similar conditions as two previous position-restraint simulations. The LINCS algorithm57 was used to constrain the bonds with hydrogen atoms and the particle mesh Ewald method58 was employed for long range electrostatic interactions. The Cut-off distance for the Lennard–Jones, short-range and long-range electrostatic interaction was set to 12 Å. A time step of 2 fs was used for integrating Newton's equations of motion.
Trajectory analysis and visualization
Most of the trajectory analyses reported in this study were performed by built-in utilities of GROMACS package version 5.0.552. The root mean square deviation (RMSD), root mean square fluctuation (RMSF), radius of gyration (Rg), and intramolecular hydrogen bonds were analyzed using gmx rms, gmx rmsf, gmx gyrate and gmx hbond of GROMACS package, respectively. The secondary structure content of the proteins was calculated as a function of time using the DSSP program59. The principal component analysis (PCA) was conducted using gmx covar and gmx anaeig. To perform free energy landscape (FEL) analysis, all-atom RMSD with respect to the average structure and radius of gyration were initially obtained for the analyzed time frames and then were employed by gmx sham module of GROMACS for calculation of Gibbs free energy as well as construction of FEL. A conformation with minimum free energy was extracted as the representative structure for visualization. The three-dimensional structures of the proteins were visualized using Chimera 1.1160. The CaPTURE program61 was used to explore cation-pi interactions of the snapshots extracted from the MD trajectories.
Results
The SNP dataset
The nsSNPs of human CYP1A2 gene were retrieved from the NCBI dbSNP database31 build 150. The nsSNPs which met at least one of the following criteria in the validation method were entered to the evaluation: (1) sequenced in 1000Genome project (1000G), (2) validated by multiple independent submissions to the refSNP cluster, (3) validated by frequency or genotype data, (4) genotyped by HapMap project, (5) validated by submitter confirmation, and (6) observed in at least two chromosome apiece. The nsSNPs which have no information on validation method (did not have any of the mentioned criteria) were excluded. Among them, there were four known alleles of CYP1A2 which were listed in CYPalleles including P42R (CYP1A2*15), S212C (CYP1A2*12), R377Q (CYP1A2*16) and N397H (CYP1A2*18). Since these alleles have been frequently studied, we made an exception for these nsSNPs and included them in our analyses. Totally, 176 nsSNPs were prepared for analysis (Supplementary Table S1). More than half of the nsSNPs occured in exon 2 (n = 94) and the others were mapped in exons 3 (n = 10), 4 (n = 8), 5 (n = 17), 6 (n = 14) and 7 (n = 33). The G to A transition is the most frequent nucleotide substitution (29.5%) found among all analyzed variations followed by C to T (23.9%), A to G (6.8%) and C to A (6.8%). At the protein level, the most common amino acids as the reference and missense were Arg (n = 45) and Leu (n = 17), respectively. The replacements of Arg with Trp (n = 12, 6.8%), Gln (n = 12, 6.8%), Cys (n = 7, 4.0%), and His (n = 7, 4.0%) and substitution of Asp by Asn (n = 7, 4.0%) are the most frequent amino acid substitutions (Fig. 1).
Figure 1.
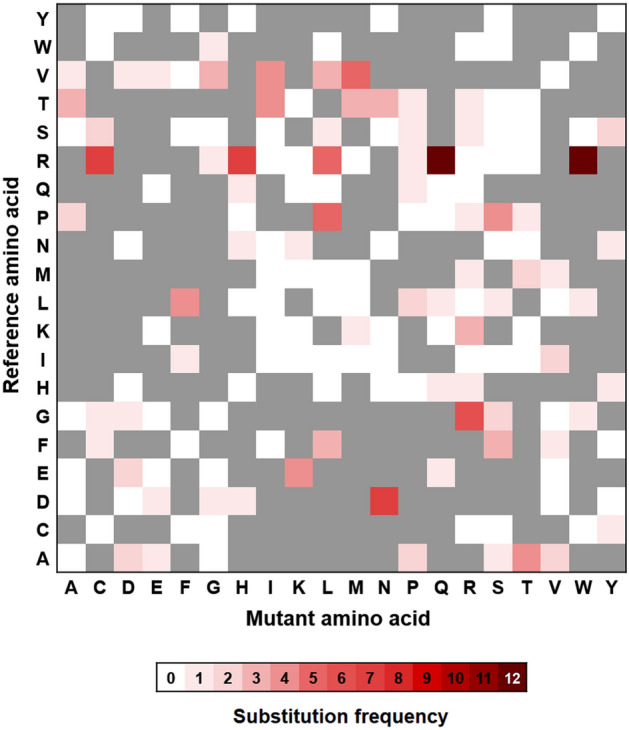
The Amino acid substitution heatmap. The one-letter codes of amino acids at the left and bottom side of the map correspond to the reference and mutant amino acids, respectively. A color index (white to red) was assigned for amino acid substitutions according to the number of their occurrences ranged from 0 to 12. The gray blocks show the amino acid replacements that are not allowed to occur by single nucleotide substitution.
In silico evaluation of nsSNPs
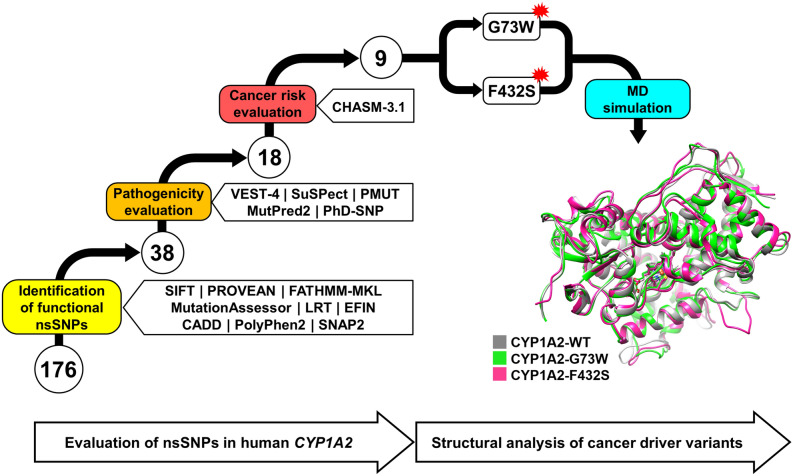
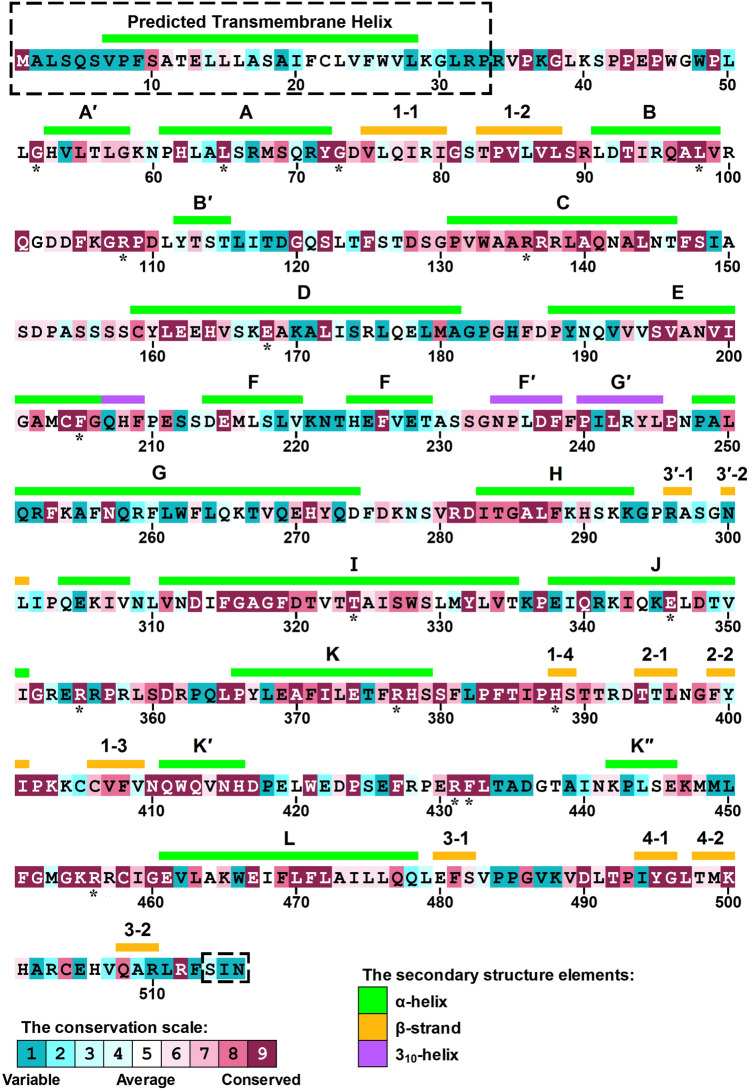
As shown in Fig. 2, a total of 176 nsSNPs for human CYP1A2 gene were evaluated in a multi-step framework. A variant must be voted by all of the tools to proceed to the next step of the analysis. Firstly, all nsSNPs were evaluated by SIFT, PROVEAN, MutationAssessor, LRT, FATHMM-MKL, EFIN, CADD, PolyPhen2 and SNAP2 to identify functional nsSNPs. As a result, 38 nsSNPs were agreed to be associated with functional effects by all of the used methods (Supplementary Table S2). Subsequently, the isolated nsSNPs were subjected to pathogenicity evaluation using SuSPect, MutPred2, PMUT, PhD-SNP and VEST-4. 18 out of the 38 examined nsSNPs including G52R, L65P, G73R, G73W, L98Q, R108Q, R108W, R136C, E168K, F205V, T324R, E346K, R355W, R377Q, H388Y, R431W, F432S and R456H were classified as pathogenic by all five methods (Table 2). The evolutionary conservation profile was calculated for the amino acid position of these pathogenic variants using ConSurf49,50 web server. The conservation scores calculated by this server range from 1 to 9, and discriminate between highly variable and highly conserved positions, respectively. The results included one position (136) with score of 8 and fifteen positions (52, 65, 73, 98, 108, 168, 205, 324, 346, 355, 377, 388, 431, 432 and 456) with score of 9 (Fig. 3), indicating that almost all of the pathogenic nsSNPs affect evolutionary conserved positions in CYP1A2 protein.
Figure 2.
Schematic representation of the stepwise evaluation of CYP1A2 gene nonsynonymous single nucleotide polymorphisms (nsSNPs). A total of 176 nsSNPs were entered into the analysis by a variety of computational tools. In first step, 38 out of 176 nsSNPs were found to be associated with functional effects. Among them, 18 nsSNPs were predicted as pathogenic. Finally, 9 nsSNPs (G73R, G73W, R108Q, R108W, E168K, E346K, R431W, F432S and R456H) were also found to be cancer drivers. G73W and F432S cancer driver variants were then subjected to 200 ns molecular dynamics simulation. Conformations with minimum free energy were extracted as the representative structure for wild-type, G73W and F432S CYP1A2 proteins using FEL analysis and were visualized and superimposed using UCSF Chimera 1.11 (www.cgl.ucsf.edu/chimera).
Table 2.
Pathogenicity evaluation of functional CYP1A2 nsSNPs.
| Variant | PhD-SNP | SuSPect | MutPred2 | PMUT | VEST-4 |
|---|---|---|---|---|---|
| Pred (S) | Pred (S) | Pred (S) | Pred (S) | Pred (S, P-value, FDR) | |
| P36S | N (0.23) | N (16) | N (0.38) | N (0.36) | N (0.48, 0.194, 0.55) |
| P42R | P (0.53) | P (96) | P (0.69) | P (0.91) | N (0.48, 0.196, 0.55) |
| G52R | P (0.85) | P (95) | P (0.95) | P (0.91) | P (0.97, 0.003, 0.10) |
| P61L | P (0.55) | N (42) | P (0.58) | N (0.48) | N (0.69, 0.077, 0.35) |
| L65P | P (0.86) | P (92) | P (0.90) | P (0.86) | P (0.93, 0.006, 0.10) |
| G73R | P (0.86) | P (88) | P (0.91) | P (0.91) | P (0.97, 0.003, 0.10) |
| G73W | P (0.90) | P (94) | P (0.92) | P (0.91) | P (0.96, 0.003, 0.10) |
| R79C | P (0.80) | P (78) | N (0.33) | N (0.48) | N (0.17, 0.582, 0.90) |
| V85M | N (0.37) | P (53) | P (0.59) | N (0.24) | N (0.46, 0.207, 0.55) |
| L98Q | P (0.84) | P (93) | P (0.91) | P (0.91) | P (0.96, 0.003, 0.10) |
| R108Q | P (0.83) | P (86) | P (0.82) | P (0.91) | P (0.98, 0.002, 0.10) |
| R108W | P (0.89) | P (97) | P (0.90) | P (0.91) | P (0.98, 0.002, 0.10) |
| F125L | N (0.42) | N (41) | P (0.73) | N (0.30) | P (0.91, 0.008, 0.10) |
| R136C | P (0.69) | P (54) | P (0.71) | P (0.63) | P (0.76, 0.046, 0.25) |
| R137Q | P (0.82) | P (92) | P (0.75) | P (0.87) | N (0.71, 0.069, 0.35) |
| R138C | P (0.91) | P (75) | P (0.62) | P (0.78) | N (0.35, 0.291, 0.60) |
| V165G | P (0.73) | P (64) | P (0.65) | P (0.68) | N (0.53, 0.172, 0.55) |
| E168K | P (0.86) | P (75) | P (0.71) | P (0.57) | P (0.77, 0.045, 0.25) |
| F205V | P (0.87) | P (78) | P (0.77) | P (0.63) | P (0.93, 0.006, 0.10) |
| F238S | P (0.61) | N (47) | P (0.83) | N (0.28) | P (0.95, 0.004, 0.10) |
| R243C | P (0.74) | P (59) | N (0.40) | N (0.31) | N (0.40, 0.244, 0.55) |
| T324I | P (0.86) | P (54) | P (0.71) | N (0.40) | P (0.95, 0.004, 0.10) |
| T324R | P (0.92) | P (85) | P (0.83) | P (0.78) | P (0.97, 0.003, 0.10) |
| E346K | P (0.87) | P (93) | P (0.72) | P (0.90) | P (0.96, 0.003, 0.10) |
| R355Q | P (0.57) | N (44) | P (0.70) | N (0.41) | N (0.47, 0.203, 0.55) |
| R355W | P (0.82) | P (71) | P (0.77) | P (0.74) | P (0.81, 0.029, 0.20) |
| R377Q | P (0.79) | P (95) | P (0.77) | P (0.90) | P (0.94, 0.005, 0.10) |
| I386F | N (0.40) | P (57) | P (0.72) | N (0.30) | P (0.93, 0.006, 0.10) |
| H388Y | P (0.64) | P (78) | P (0.85) | P (0.85) | P (0.98, 0.002, 0.10) |
| R431W | P (0.82) | P (96) | P (0.81) | P (0.90) | P (0.89, 0.012, 0.10) |
| F432S | P (0.87) | P (95) | P (0.91) | P (0.90) | P (0.97, 0.003, 0.10) |
| K447M | N (0.47) | P (56) | P (0.64) | P (0.70) | N (0.57, 0.146, 0.55) |
| R456H | P (0.86) | P (79) | P (0.78) | P (0.89) | P (0.94, 0.005, 0.10) |
| R457P | P (0.87) | P (62) | P (0.92) | P (0.87) | N (0.70, 0.074, 0.35) |
| R457W | P (0.79) | P (80) | P (0.79) | P (0.87) | N (0.54, 0.164, 0.55) |
| E461K | P (0.91) | N (28) | P (0.80) | P (0.58) | N (0.73, 0.059, 0.30) |
| A473D | P (0.89) | P (84) | P (0.59) | P (0.91) | N (0.72, 0.064, 0.30) |
| T498N | P (0.73) | P (64) | P (0.51) | P (0.51) | N (0.48, 0.195, 0.55) |
Pred: Prediction, S: Score, P-value: Probability that a benign variant is misclassified as pathogen, FDR: False discovery rate, P: Pathogenic, N: Neutral/Benign.
The nsSNPs classified as pathogenic by all five methods are highlighted in bold.
Figure 3.
The conservation profile of CYP1A2 amino acid positions calculated by ConSurf (consurf.tau.ac.il). Each amino acid position is scored based on the conservation score obtained from multiple sequence alignment. The higher the score, the more conserved is the position. The uppercase letters (helices) and numbers (strands) represent the regular secondary structure elements. The structure of the areas enclosed by dashed lines has not yet been determined. The positions labeled by black stars indicate amino acid positions of the 18 nsSNPs which predicted as pathogenic.
The filtered pathogenic variants were further analyzed with CHASM-3.147 to assess possible association with cancer susceptibility. CHASM-3.1 consists of cancer-specific classifiers which allow to predict cancer driver variants depending on a particular cancer type. Since CYP1A2 is a hepatic enzyme, we selected liver-viral (hepatocellular carcinoma) to compute the cancer driver scores. The results reported in Table 3 revealed a possible association with hepatocellular carcinoma for G73R, G73W, R108Q, R108W, E168K, E346K, R431W, F432S and R456H variants (P-value < 0.05).
Table 3.
Assessing the cancer susceptibility of pathogenic CYP1A2 nsSNPs using CHASM-3.1.
| Variant | Prediction | Score | P-value | FDR |
|---|---|---|---|---|
| G52R | Passenger | 0.50 | 0.080 | 0.70 |
| L65P | Passenger | 0.49 | 0.100 | 0.70 |
| G73R | Cancer driver | 0.63 | 0.013 | 0.30 |
| G73W | Cancer driver | 0.62 | 0.014 | 0.30 |
| L98Q | Passenger | 0.48 | 0.110 | 0.75 |
| R108Q | Cancer driver | 0.67 | 0.006 | 0.20 |
| R108W | Cancer driver | 0.68 | 0.005 | 0.20 |
| R136C | Passenger | 0.42 | 0.190 | 0.80 |
| E168K | Cancer driver | 0.60 | 0.021 | 0.35 |
| F205V | Passenger | 0.43 | 0.178 | 0.80 |
| T324R | Passenger | 0.36 | 0.316 | 0.80 |
| E346K | Cancer driver | 0.63 | 0.012 | 0.30 |
| R355W | Passenger | 0.53 | 0.056 | 0.60 |
| R377Q | Passenger | 0.52 | 0.061 | 0.60 |
| H388Y | Passenger | 0.51 | 0.071 | 0.65 |
| R431W | Cancer driver | 0.65 | 0.007 | 0.20 |
| F432S | Cancer driver | 0.66 | 0.007 | 0.20 |
| R456H | Cancer driver | 0.72 | 0.002 | 0.20 |
P-value: Probability that a passenger variant is misclassified as driver, FDR: False discovery rate.
Evaluation of nsSNPs occurring in transmembrane helix
The CYP1A2 is a membrane-bound protein which is anchored to the endoplasmic reticulum membrane through an N-terminal transmembrane helix. However, to date, no complete structure for CYP1A2 including this region has been determined. Hence, the sequence of CYP1A2 protein was submitted to TMHMM server v2.0 to predict the transmembrane helix. According to the server’s estimation, the transmembrane helix includes residues 7 to 28. Nine substitutions including S10L, L15F, S18C, S18Y, A19P, F21L, F25C, F25S and V27M have occurred in the transmembrane helical region, none of which were found to be associated with pathogenicity. Moreover, evolutionary conservation analysis of the nsSNPs located in this transmembrane helix did not found any conserved amino acid position other than Ser10 (Fig. 3).
Molecular dynamics simulation
In order to determine which of the cancer driver nsSNPs should be subjected to MD simulation, we used all evaluation tools with stringent threshold of effectiveness/deleteriousness (Fig. 4). As a result, two cancer driver nsSNPs G73W and F432S voted by all the tools were selected for the structural evaluation by MD simulation. The structure of CYP1A2 (PDB ID: 2HI414) after removal of the ligand (alpha-naphthoflavone) was used as the wild-type (WT) protein. The initial structure of the G73W and F432S variants was obtained by substitution of the corresponding residues in the WT structure. Finally, variant and WT structures were subjected to 200 ns MD simulation to explore possible impacts of the substitutions on protein structure.
Figure 4.
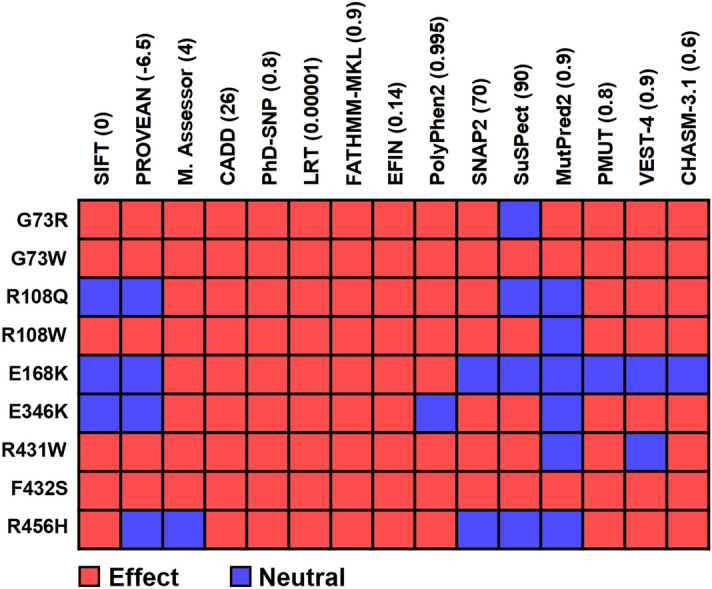
Evaluation of the cancer driver nsSNPs by all methods with modified thresholds. The numbers in parentheses refer to the user-defined thresholds.
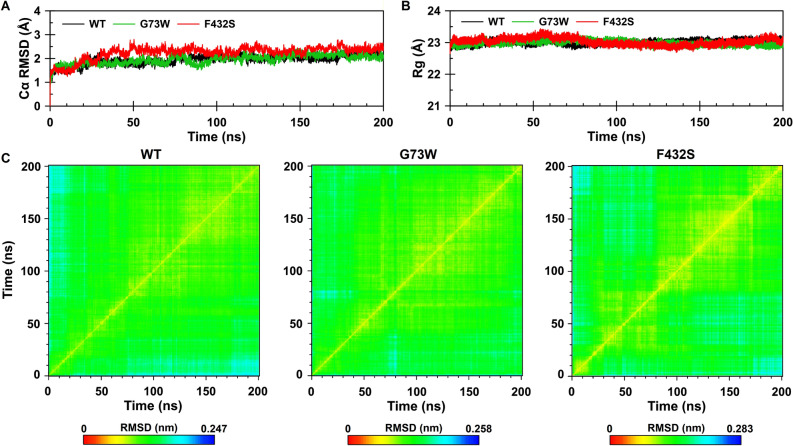
Root mean square deviation (RMSD) of the alpha carbon (Cα) atoms for each frame with respect to the starting (1D-RMSD) and to all other frames (2D-RMSD) as well as radius of gyration (Rg) along the simulation time were calculated (Fig. 5). By comparing the 1D-RMSD trend it was found that the G73W (1.95 ± 0.20 Å) behaves more or less similar to the WT (1.94 ± 0.21 Å), whereas the F432S demonstrates minor deviation in the Cα atom positions (2.24 ± 0.28 Å). The 2D-RMSD plots indicate that WT and G73W variant converged to relatively stable conformations after about 40 ns of simulations (Fig. 5C), while for F432S variant, such a stable conformation was achieved after about 80 ns, suggesting that F432S has experienced more structural changes before running out into a stable structure (Fig. 5C). The measurement of Rg as a function of the simulation time also implied that the structures converged after about 80 ns (Fig. 5B). Taking these findings together and to be statistically comparable, the analyses were focused on those trajectories obtained from the last 120 ns of simulations (from 80 to 200 ns) for all the three proteins.
Figure 5.
(A) Time dependence of the root mean square deviation and (B) Radius of gyration calculated for Cα atoms. WT, G73W and F432S are shown in black, green and red, respectively. (C) Two-dimensional root mean square deviation (2D-RMSD) plots calculated for Cα atoms as a function of the simulation time. The plots are color-coded according to RMSD values (nm).
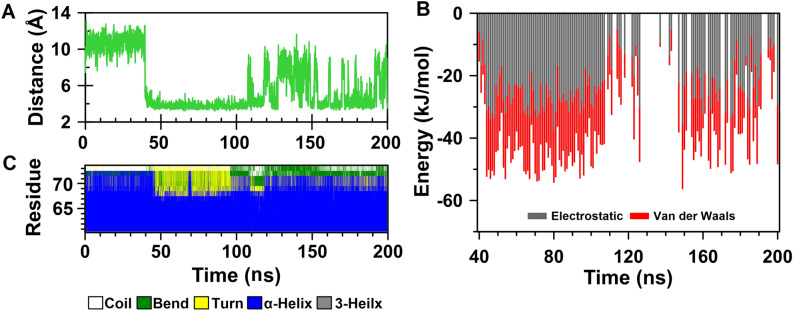
In order to gain more insight into the local structural changes around substitution sites, we extracted a conformation with minimum free energy as the representative structure using free energy landscape analysis from the last 120 ns of each MD simulation. Gly73 is located in a short loop just after A helix (residues 61–72). Substitution of this residue by tryptophan renders the indole ring of Trp to be captured by the positive charge of the guanidinium group of Arg90. As a result, a cation-pi interaction formed between Trp73 and Arg90 after about 39 ns of the simulation. The distance between the indole ring and guanidinium group is maintained at about 4 Å for 70 ns, after that the magnitude of the fluctuations increased (Fig. 6A). In this regard, 161 snapshots were extracted at every 1 ns from 40 to 200 ns of the simulation time and explored for cation-pi interactions by CaPTURE program61. The results taken from CaPTURE also confirmed the formation of cation-pi interaction between Trp73 and Arg90, although it was attenuated after 120 ns (Fig. 6B). On the other hand, analysis of the secondary structure showed the C-terminal end of the A helix became unstable after establishment of cation-pi interaction between Trp73 and Arg90 (Fig. 6C). The next substitution site, Phe432, is located in a 310 helix flanked by helices K' and K". In WT structure, most of the residues located within a radius of 5 Å from side chain of Phe432 are nonpolar residues, of which, Ala370, Leu373, Trp421, Ile440, Leu444 and Met448 have been shown to be involved in van der Waals interactions with the aromatic moiety of Phe432. By comparing WT and F432S representative structures, it was cleared that substitution of serine residue with a small polar side chain for F432 has led to disappearance of these interactions.
Figure 6.
Local structural changes resulting from G73W substitution. (A) Time evaluation of the distance between aromatic moiety of Trp73 and guanidinium group of Arg90. (B) Binding energies of W73-R90 cation-pi interaction calculated with CaPTURE program. The total binding energy is equal to the electrostatic plus the van der Waals interaction energies (Etotal = Eelec + EvdW). (C) Time-dependent secondary structure of the A helix. The occurrence of secondary structure elements is indicated by using a color code.
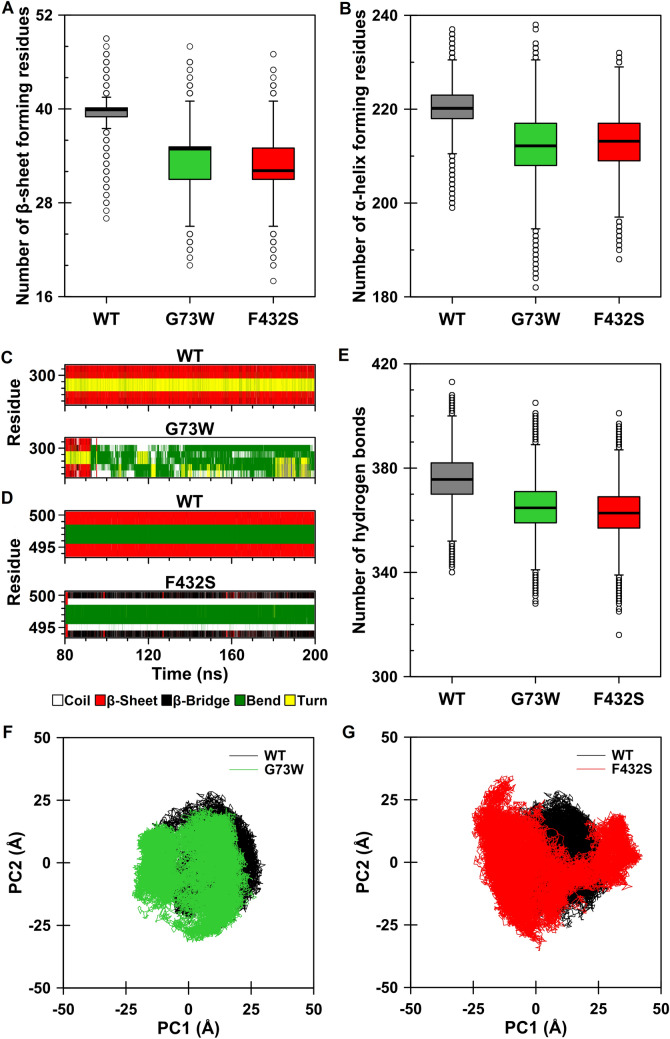
We also conducted further analyses to explore the overall structural changes upon substitutions. The secondary structure content of the proteins was also measured during the analyzed time window. Both variants showed a decrease in the β-sheet (Fig. 7A) and α-helical content (Fig. 7B). The average number of β-sheet forming residues was reduced from 40 ± 2 in WT to 34 ± 3 in G73W variant and 33 ± 3 in F432S variant. The average number of residues participating in α-helix was also decreased from 220 ± 4 in WT to 212 ± 7 and 213 ± 6 in G73W and F432S, respectively. Detailed analysis of secondary structure elements revealed disruption of β-sheet 3′ in G73W variant (Fig. 7C) and β-sheet 4 in F432S variant (Fig. 7D). The results implied that no α-helix structure was completely lost, they were just shortened by one or more residues.
Figure 7.
Trajectory analysis of the wild-type, G73W and F432S CYP1A2 proteins during the analyzed time frames (last 120 ns). (A,B) Number of β-sheet and α-helix forming residues. Box plots for WT, G73W and F432S are shown in dark gray, green and red, respectively. (C,D) Time-dependent secondary structure profile of β-sheets 3′ and 4 for G73W and F432S variants, respectively. (E) Comparison of the intramolecular hydrogen bonds. (F,G) Projection of the motion of the protein in phase space along the first two principal eigenvectors. Comparison of G73W (green) and F432S (red) with WT (black) are presented.
On the other hand, analysis of hydrogen bonds implied a decrease in the number of intramolecular hydrogen bonds in both variants as the average number of hydrogen bonds was reduced from 376 ± 9 in WT to 365 ± 9 and 363 ± 9 in G73W and F432S variants, respectively (Fig. 7E). It was also observed that the number of hydrogen bonds with occupancy above 70% has decreased from 264 in WT to 237 and 249 in G73W and F432S variants, respectively. The reduction in the number and strength of hydrogen bonds suggested a gain in the overall flexibility of the variants upon substitutions. So, to examine whether these substitutions affect protein overall flexibility, we performed principal component analysis (PCA). The Eigenvectors and eigenvalues were obtained from diagonalization of the covariance matrices of the Cα atoms, and the principal components were generated by projecting the trajectories on the respective eigenvectors (Fig. 7F and 7G). The trace of the diagonalized covariance matrix was found to be 530.27 Å2, 693.11 Å2 and 931.91 Å2 for WT, G73W and F432S variants, respectively, confirming an increase in the overall flexibility of the variants, of which the increase in the F432S variant is more drastic compared to that of G73W.
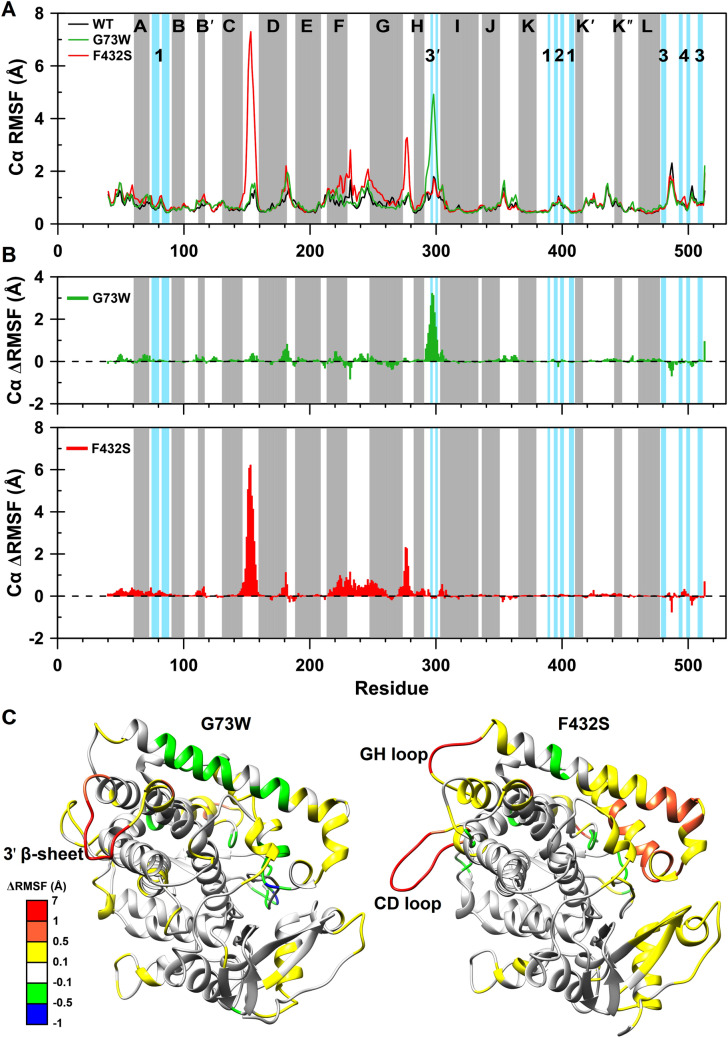
In order to provide more insight into the protein structural flexibility, RMSF of the Cα atoms as a function of residue number was calculated over the last 120 ns (Fig. 8A). The RMSF graph has been highlighted with color blocks indicating α-helices and β-strands according to CYP1A2 crystallographic structure. The differences in per-residue RMSF (ΔRMSF) for G73W and F432S Cα atoms with respect to the WT were also measured and visualized in Fig. 8B. Positive values indicate more flexible residues and negative values show less flexible residues compared to those of WT. As seen in Figs. 8B and 8C, a significant increase in flexibility was measured for β-sheet 3′ and its flanking loops of G73W variant. Disruption of β-sheet 3′ due to breaking of two hydrogen bonds between Ala297 and Asn300 confirmed the higher flexibility in this region (Fig. 7C). In case of F432S variant, a sharp increase in fluctuation of the CD loop was particularly significant (Figs. 8B and 8C). Increased flexibility was also observed in F helix, FG loop, G helix and GH loop.
Figure 8.
(A) Root mean square fluctuation (RMSF) of the Cα atoms as a function of residue number. The gray and blue blocks indicate α-helices (denoted with letters) and β-strands (denoted with numbers), respectively. WT protein is shown in black, G73W in green and F432S in red. (B) Change in RMSF (ΔRMSF) of the Cα atoms for G73W (green) and F432S (red) with respect to the WT as a function of residue number. Positive and negative values of ΔRMSF indicate more and less flexible residues compared to the WT ones, respectively. (C) Three-dimensional representation of G73W and F432S structures colored based on ΔRMSF values. A Conformation with minimum free energy was extracted as the representative structure for G73W and F432S using FEL analysis and were visualized using UCSF Chimera 1.11 (www.cgl.ucsf.edu/chimera). The position of β-sheet 3′ in G73W, CD and GH loops in F432S, showing significant differences in ΔRMSF values are marked on corresponding structures.
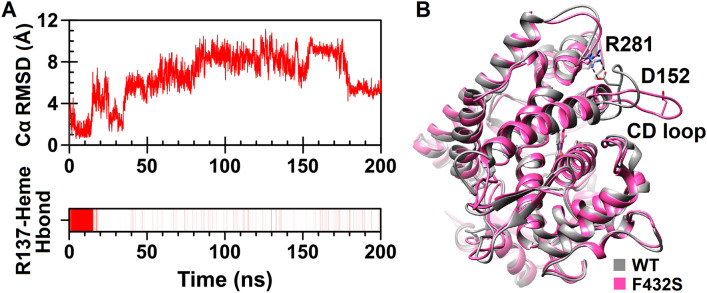
Calculation of RMSD for Cα of the CD loop during the entire course of the F432S simulation demonstrated displacement of this loop after about 14 ns of the simulation (Fig. 9A). In addition, monitoring of the CD loop interactions revealed that F432S has lost the hydrogen bonding network in this region of the protein (Supplementary Table S3). The salt bridge between Asp152 from this loop and Arg281 from GH loop has also disrupted (Fig. 9B). The removal of these interactions thought to be the reason for displacement and higher mobility of the CD loop as well as GH loop in F432S variant. Another notable change was the significant weakening of the conserved hydrogen bond between Arg137 of the C helix and the heme propionate oxygen which occurred shortly after CD loop movement (Fig. 9A). By looking at the results described for CD loop, it may be concluded that displacement of the CD loop together with its increased flexibility have induced breakage of the Arg137-heme hydrogen bond.
Figure 9.
Structural changes caused by F432S substitution. (A) Evaluation of the Cα RMSD as a function of time for the CD loop (upper plot) and existence map for the hydrogen bond between Arg137 of the C helix and heme propionate (lower plot) are shown. Presence of the R137-heme hydrogen bond is shown by vertical red lines. (B) The positions of the CD loop and D152-R281 salt bridge in superimposed structures of the wild-type CYP1A2 (gray) and F432S (pink). UCSF Chimera 1.11 (www.cgl.ucsf.edu/chimera) was used for superposition and three-dimensional visualization of the structures.
Discussion
In this study, we performed a comprehensive in silico evaluation to identify CYP1A2 gene pathogenic nsSNPs using a wide variety of computational tools. To our knowledge only one study has been carried out to evaluate the nsSNPs of human CYP1A2 gene. Wang et al. using two tools SIFT and PolyPhen analyzed the functional impact of thirty-three nsSNPs of CYP1A2 gene and reported eleven nsSNPs as damaging substitutions62. We expanded our study to include more nsSNPs and hypothesized that a more reliable and accurate estimate of a substitution consequence could be provided by using a variety of computational methods that follow different approaches to distinguish between pathogenic and neutral variants. Although all predictive methods have been developed to estimate whether a given substitution has functional/pathogenic effect, it does not necessarily mean that they can elucidate the mechanism how the SNPs affect protein function or cause disease. This question could be explored using other experimental or computational techniques including MD simulation.
To test our hypothesis, we initially annotated the nsSNPs using a variety of computational methods to distinguish between functional and neutral variants. Assessing the pathogenicity of functional nsSNPs identified 18 pathogenic nsSNPs. Evolutionary conservation analysis indicated that almost all of the pathogenic nsSNPs occupy conserved amino acid positions. Moreover, the results obtained from CHASM-3.1 revealed a possible association between G73R, G73W, R108Q, R108W, E168K, E346K, R431W, F432S and R456H with risk of developing hepatocellular carcinoma.
The results of this study are in fairly good agreement with those published by Ito and colleagues. They reported reduced activity for CYP1A2*4 (I386F), CYP1A2*6 (R431W), CYP1A2*8 (R456H), CYP1A2*11 (F186L), CYP1A2*15 (P42R), CYP1A2*16 (R377Q) and CYP1A2*21 (S298R and Y495Ter) toward phenacetin and 7-ethoxyresorufin substrates. The nonsense substitution (Y459Ter) of CYP1A2*21 results in a truncated protein that reduces the activity of the enzyme25. Moreover, two allelic variants CYP1A2*14 (T438I) and CYP1A2*20 (D436N) showed higher activity for phenacetin compared with wild-type enzyme. In the current study, P42R, R377Q, I386F, R431W and R456H variants were predicted as functional variants, of which R431W and R456H variants were also found to be associated with pathogenicity and cancer susceptibility.
Among nsSNPs predicted as cancer drivers, G73W and F432S were still voted by all methods even after applying more stringent thresholds. Accordingly, these variants were subjected to 200 ns MD simulations to explore the effect of substitutions on the protein structure. Findings demonstrated that these substitutions change protein structural features not only in proximity of the substituted residues but also in spatially distant regions. Both variants experienced a reduction in the number and strength of intramolecular hydrogen bonds as well as in β-sheet and α-helical content. Results derived from the principal component analysis (PCA) confirmed an increase in the overall flexibility especially for F432S variant. A drastic increase was also found for the CD loop flexibility which is a long serine-rich stretch (residues 148–158) extended into the solvent. Increased mobility of the CD loop has been recently reported upon simulation of R377Q27. In this regard, the experimentally observed loss of the enzymatic activity in R377Q variant has been attributed to the reduced heme stability due to the increased flexibility of the C helix, which is adjacent to the CD loop. The C helix is also adjacent to the heme prosthetic group and interacts with heme propionate oxygen via a conserved arginine residue (Arg137). Hence, any change in flexibility of the C helix could affect the stability of the heme. Moreover, C helix is one of the main regions involved in interaction with redox partners like cytochrome b5 (CYB5). CYPs binding to CYB5 is mediated through a groove on the proximal surface of the protein which includes C helix. There are also growing evidences for the involvement of CD loop in binding of some CYPs to the CYB5, although it appears the CYB5 interactive elements of various CYPs are type specific. For example, the interacting region on CYP3A4 in apo form consists of helices B, C, D, BB' and CD loops, β-bulge and meander region while on CYP2E1 is provided by helices C, J', L, β-bulge and meander region63,64. Taken together, it seems reasonable to expect that the high mobility of the CD loop in F432S may affect heme stability as well as interaction with CYB5.
Conclusion
CYP1A2 is one of the main hepatic CYPs involved in the bioactivation of carcinogens and metabolism of clinically used drugs. Hence, nsSNPs of this enzyme could affect cancer susceptibility and drug efficiency. In current study, using a variety of computational tools, 38 out of 176 nsSNPs of human CYP1A2 gene were predicted as functional variants. The functional nsSNPs were further analyzed to trace possible association with pathogenicity and cancer susceptibility. As a result, 18 nsSNPs predicted as pathogenic, of which G73R, G73W, R108Q, R108W, E168K, E346K, R431W, F432S and R456H variants were also found to be associated with hepatocellular carcinoma. We also performed 200 ns MD simulations to explore how G73W and F432S cancer driver variants affect the protein structure. Simulation results revealed several significant structural alterations, particularly for F432S variant. Among them, increased flexibility of the CD loop and loss of the hydrogen bond between heme and Arg137 from C helix were the most prominent ones, because they could affect the heme stability as well as the protein interaction with cytochrome b5. These findings may be considered in designing experimental studies and provide novel insights into understanding the structure–function relationship in CYP1A2 and other CYPs.
Supplementary Information
Author contributions
N.M. and L.N. designed the research. L.N. performed computational analyses and MD simulations. N.M and L.N. contributed to results interpretation and wrote the manuscript.
Competing interests
The authors declare no competing interests.
Footnotes
Publisher's note
Springer Nature remains neutral with regard to jurisdictional claims in published maps and institutional affiliations.
Supplementary Information
The online version contains supplementary material available at 10.1038/s41598-021-83696-x.
References
- 1.Kruglyak L, Nickerson DA. Variation is the spice of life. Nat. Genet. 2001;27:234–236. doi: 10.1038/85776. [DOI] [PubMed] [Google Scholar]
- 2.Shastry BS. SNP alleles in human disease and evolution. J. Hum. Genet. 2002;47:561–566. doi: 10.1007/s100380200086. [DOI] [PubMed] [Google Scholar]
- 3.Jia M, et al. Computational analysis of functional single nucleotide polymorphisms associated with the CYP11B2 gene. PLoS ONE. 2014;9:e104311. doi: 10.1371/journal.pone.0104311. [DOI] [PMC free article] [PubMed] [Google Scholar]
- 4.George DCP, et al. Evolution-and structure-based computational strategy reveals the impact of deleterious missense mutations on MODY 2 (maturity-onset diabetes of the young, type 2) Theranostics. 2014;4:366–385. doi: 10.7150/thno.7473. [DOI] [PMC free article] [PubMed] [Google Scholar]
- 5.AbdulAzeez S, Borgio JF. In-silico computing of the most deleterious nsSNPs in HBA1 gene. PLoS ONE. 2016;11:e0147702. doi: 10.1371/journal.pone.0147702. [DOI] [PMC free article] [PubMed] [Google Scholar]
- 6.Kelly JN, Barr SD. In silico analysis of functional single nucleotide polymorphisms in the human TRIM22 gene. PLoS ONE. 2014;9:e101436. doi: 10.1371/journal.pone.0101436. [DOI] [PMC free article] [PubMed] [Google Scholar]
- 7.Pires AS, Porto WF, Franco OL, Alencar SA. In silico analyses of deleterious missense SNPs of human apolipoprotein E3. Sci. Rep. 2017;7:2509. doi: 10.1038/s41598-017-01737-w. [DOI] [PMC free article] [PubMed] [Google Scholar]
- 8.Evans WE, Relling MV. Pharmacogenomics: translating functional genomics into rational therapeutics. Science. 1999;286:487–491. doi: 10.1126/science.286.5439.487. [DOI] [PubMed] [Google Scholar]
- 9.Sim SC, Ingelman-Sundberg M. The Human Cytochrome P450 (CYP) Allele Nomenclature website: a peer-reviewed database of CYP variants and their associated effects. Hum. Genom. 2010;4:278–281. doi: 10.1186/1479-7364-4-4-278. [DOI] [PMC free article] [PubMed] [Google Scholar]
- 10.Preissner SC, et al. Polymorphic cytochrome P450 enzymes (CYPs) and their role in personalized therapy. PLoS ONE. 2013;8:e82562. doi: 10.1371/journal.pone.0082562. [DOI] [PMC free article] [PubMed] [Google Scholar]
- 11.Nelson DR. The cytochrome p450 homepage. Hum. Genom. 2009;4:59–65. doi: 10.1186/1479-7364-4-1-59. [DOI] [PMC free article] [PubMed] [Google Scholar]
- 12.Zanger U, et al. Genetics, epigenetics, and regulation of drug-metabolizing cytochrome P450 enzymes. Clin. Pharmacol. Ther. 2014;95:258–261. doi: 10.1038/clpt.2013.220. [DOI] [PubMed] [Google Scholar]
- 13.Nebert DW, Dalton TP. The role of cytochrome P450 enzymes in endogenous signalling pathways and environmental carcinogenesis. Nat. Rev. Cancer. 2006;6:947–960. doi: 10.1038/nrc2015. [DOI] [PubMed] [Google Scholar]
- 14.Sansen S, et al. Adaptations for the oxidation of polycyclic aromatic hydrocarbons exhibited by the structure of human P450 1A2. J. Biol. Chem. 2007;282:14348–14355. doi: 10.1074/jbc.M611692200. [DOI] [PubMed] [Google Scholar]
- 15.Brøsen K. Drug interactions and the cytochrome P450 system. Clin. Pharmacokinet. 1995;29:20–25. doi: 10.2165/00003088-199500291-00005. [DOI] [PubMed] [Google Scholar]
- 16.Kim D, Guengerich FP. Cytochrome P450 activation of arylamines and heterocyclic amines. Annu. Rev. Pharmacol. Toxicol. 2005;45:27–49. doi: 10.1146/annurev.pharmtox.45.120403.100010. [DOI] [PubMed] [Google Scholar]
- 17.Tassaneeyakul W, et al. Caffeine metabolism by human hepatic cytochromes P450: contributions of 1A2, 2E1 and 3A isoforms. Biochem. Pharmacol. 1994;47:1767–1776. doi: 10.1016/0006-2952(94)90304-2. [DOI] [PubMed] [Google Scholar]
- 18.Skene DJ, et al. Contribution of CYP1A2 in the hepatic metabolism of melatonin: studies with isolated microsomal preparations and liver slices. J. Pineal Res. 2001;31:333–342. doi: 10.1034/j.1600-079X.2001.310408.x. [DOI] [PubMed] [Google Scholar]
- 19.Wang B, Zhou S-F. Synthetic and natural compounds that interact with human cytochrome P450 1A2 and implications in drug development. Curr. Med. Chem. 2009;16:4066–4218. doi: 10.2174/092986709789378198. [DOI] [PubMed] [Google Scholar]
- 20.Spaldin V, et al. Determination of human hepatic cytochrome P4501A2 activity in vitro use of tacrine as an isoenzyme-specific probe. Drug Metab. Dispos. 1995;23:929–934. [PubMed] [Google Scholar]
- 21.Bertilsson L, et al. Clozapine disposition covaries with CYP1A2 activity determined by a caffeine test. Br. J. Clin. Pharmacol. 1994;38:471–473. doi: 10.1111/j.1365-2125.1994.tb04385.x. [DOI] [PMC free article] [PubMed] [Google Scholar]
- 22.Sarkar MA, Hunt C, Guzelian PS, Karnes HT. Characterization of human liver cytochromes P-450 involved in theophylline metabolism. Drug Metab. Dispos. 1992;20:31–37. [PubMed] [Google Scholar]
- 23.Pichard L, et al. Oxidative metabolism of zolpidem by human liver cytochrome P450S. Drug Metab. Dispos. 1995;23:1253–1262. [PubMed] [Google Scholar]
- 24.Sigrist CJ, et al. New and continuing developments at PROSITE. Nucl. Acids Res. 2012;41:D344–D347. doi: 10.1093/nar/gks1067. [DOI] [PMC free article] [PubMed] [Google Scholar]
- 25.Ito M, Katono Y, Oda A, Hirasawa N, Hiratsuka M. Functional characterization of 20 allelic variants of CYP1A2. Drug Metab. Pharmacokinet. 2015;30:247–252. doi: 10.1016/j.dmpk.2015.03.001. [DOI] [PubMed] [Google Scholar]
- 26.Lim Y-R, et al. Functional significance of cytochrome P450 1A2 allelic variants, P450 1A2*8, *15, and *16 (R456H, P42R, and R377Q) Biomol. Ther. 2015;23:189–194. doi: 10.4062/biomolther.2015.009. [DOI] [PMC free article] [PubMed] [Google Scholar]
- 27.Watanabe Y, et al. Prediction of three-dimensional structures and structural flexibilities of wild-type and mutant cytochrome P450 1A2 using molecular dynamics simulations. J. Mol. Graph. Model. 2016;68:48–56. doi: 10.1016/j.jmgm.2016.06.006. [DOI] [PubMed] [Google Scholar]
- 28.Zhang T, Liu LA, Lewis DF, Wei D-Q. Long-range effects of a peripheral mutation on the enzymatic activity of cytochrome P450 1A2. J. Chem. Inf. Model. 2011;51:1336–1346. doi: 10.1021/ci200112b. [DOI] [PubMed] [Google Scholar]
- 29.Ying B-L, Fa B-T, Cong S, Zhong Y, Wang J-F. Insight into the mutation-induced decrease of the enzymatic activity of human cytochrome P450 1A2. Med. Chem. 2016;6:174–178. doi: 10.4172/2161-0444.1000342. [DOI] [Google Scholar]
- 30.Apweiler R, et al. UniProt: the universal protein knowledgebase. Nucl. Acids Res. 2004;32:D115–D119. doi: 10.1093/nar/gkh131. [DOI] [PMC free article] [PubMed] [Google Scholar]
- 31.Sherry ST, et al. dbSNP: the NCBI database of genetic variation. Nucl. Acids Res. 2001;29:308–311. doi: 10.1093/nar/29.1.308. [DOI] [PMC free article] [PubMed] [Google Scholar]
- 32.Berman HM, et al. The protein data bank. Nucl. Acids Res. 2000;28:235–242. doi: 10.1093/nar/28.1.235. [DOI] [PMC free article] [PubMed] [Google Scholar]
- 33.Sim N-L, et al. SIFT web server: predicting effects of amino acid substitutions on proteins. Nucl. Acids Res. 2012;40:W452–W457. doi: 10.1093/nar/gks539. [DOI] [PMC free article] [PubMed] [Google Scholar]
- 34.Choi Y, Sims GE, Murphy S, Miller JR, Chan AP. Predicting the functional effect of amino acid substitutions and indels. PLoS ONE. 2012;7:e46688. doi: 10.1371/journal.pone.0046688. [DOI] [PMC free article] [PubMed] [Google Scholar]
- 35.Reva B, Antipin Y, Sander C. Predicting the functional impact of protein mutations: application to cancer genomics. Nucl. Acids Res. 2011;39:e118–e118. doi: 10.1093/nar/gkr407. [DOI] [PMC free article] [PubMed] [Google Scholar]
- 36.Zeng S, Yang J, Chung BH-Y, Lau YL, Yang W. EFIN: predicting the functional impact of nonsynonymous single nucleotide polymorphisms in human genome. BMC Genom. 2014;15:455. doi: 10.1186/1471-2164-15-455. [DOI] [PMC free article] [PubMed] [Google Scholar]
- 37.Chun S, Fay JC. Identification of deleterious mutations within three human genomes. Genome Res. 2009;19:1553–1561. doi: 10.1101/gr.092619.109. [DOI] [PMC free article] [PubMed] [Google Scholar]
- 38.Shihab HA, et al. An integrative approach to predicting the functional effects of non-coding and coding sequence variation. Bioinformatics. 2015;31:1536–1543. doi: 10.1093/bioinformatics/btv009. [DOI] [PMC free article] [PubMed] [Google Scholar]
- 39.Capriotti E, Calabrese R, Casadio R. Predicting the insurgence of human genetic diseases associated to single point protein mutations with support vector machines and evolutionary information. Bioinformatics. 2006;22:2729–2734. doi: 10.1093/bioinformatics/btl423. [DOI] [PubMed] [Google Scholar]
- 40.Kircher M, et al. A general framework for estimating the relative pathogenicity of human genetic variants. Nat. Genet. 2014;46:310. doi: 10.1038/ng.2892. [DOI] [PMC free article] [PubMed] [Google Scholar]
- 41.Adzhubei IA, et al. A method and server for predicting damaging missense mutations. Nat. Methods. 2010;7:248. doi: 10.1038/nmeth0410-248. [DOI] [PMC free article] [PubMed] [Google Scholar]
- 42.Hecht M, Bromberg Y, Rost B. Better prediction of functional effects for sequence variants. BMC Genom. 2015;16:S1. doi: 10.1186/1471-2164-16-S8-S1. [DOI] [PMC free article] [PubMed] [Google Scholar]
- 43.Yates CM, Filippis I, Kelley LA, Sternberg MJ. SuSPect: enhanced prediction of single amino acid variant (SAV) phenotype using network features. J. Mol. Biol. 2014;426:2692–2701. doi: 10.1016/j.jmb.2014.04.026. [DOI] [PMC free article] [PubMed] [Google Scholar]
- 44.Ferrer-Costa C, et al. PMUT: a web-based tool for the annotation of pathological mutations on proteins. Bioinformatics. 2005;21:3176–3178. doi: 10.1093/bioinformatics/bti486. [DOI] [PubMed] [Google Scholar]
- 45.Pejaver, V. et al. MutPred2: inferring the molecular and phenotypic impact of amino acid variants. bioRxiv, 134981 (2017). [DOI] [PMC free article] [PubMed]
- 46.Carter H, Douville C, Stenson PD, Cooper DN, Karchin R. Identifying Mendelian disease genes with the variant effect scoring tool. BMC Genom. 2013;14:S3. doi: 10.1186/1471-2164-14-S3-S3. [DOI] [PMC free article] [PubMed] [Google Scholar]
- 47.Carter H, et al. Cancer-specific high-throughput annotation of somatic mutations: computational prediction of driver missense mutations. Cancer Res. 2009;69:6660–6667. doi: 10.1158/0008-5472.CAN-09-1133. [DOI] [PMC free article] [PubMed] [Google Scholar]
- 48.Douville C, et al. CRAVAT: cancer-related analysis of variants toolkit. Bioinformatics. 2013;29:647–648. doi: 10.1093/bioinformatics/btt017. [DOI] [PMC free article] [PubMed] [Google Scholar]
- 49.Berezin C, et al. ConSeq: the identification of functionally and structurally important residues in protein sequences. Bioinformatics. 2004;20:1322–1324. doi: 10.1093/bioinformatics/bth070. [DOI] [PubMed] [Google Scholar]
- 50.Ashkenazy H, et al. ConSurf 2016: an improved methodology to estimate and visualize evolutionary conservation in macromolecules. Nucleic Acids Res. 2016;44:W344–W350. doi: 10.1093/nar/gkw408. [DOI] [PMC free article] [PubMed] [Google Scholar]
- 51.Krogh A, Larsson B, Von Heijne G, Sonnhammer EL. Predicting transmembrane protein topology with a hidden markov model: application to complete genomes. J. Mol. Biol. 2001;305:567–580. doi: 10.1006/jmbi.2000.4315. [DOI] [PubMed] [Google Scholar]
- 52.Abraham MJ, et al. GROMACS: High performance molecular simulations through multi-level parallelism from laptops to supercomputers. SoftwareX. 2015;1:19–25. doi: 10.1016/j.softx.2015.06.001. [DOI] [Google Scholar]
- 53.Huang J, MacKerell AD. CHARMM36 all-atom additive protein force field: validation based on comparison to NMR data. J. Comput. Chem. 2013;34:2135–2145. doi: 10.1002/jcc.23354. [DOI] [PMC free article] [PubMed] [Google Scholar]
- 54.Guex N, Peitsch MC. SWISS-MODEL and the Swiss-Pdb Viewer: an environment for comparative protein modeling. Electrophoresis. 1997;18:2714–2723. doi: 10.1002/elps.1150181505. [DOI] [PubMed] [Google Scholar]
- 55.Bussi G, Donadio D, Parrinello M. Canonical sampling through velocity rescaling. J. Chem. Phys. 2007;126:014101. doi: 10.1063/1.2408420. [DOI] [PubMed] [Google Scholar]
- 56.Parrinello M, Rahman A. Polymorphic transitions in single crystals: a new molecular dynamics method. J. Appl. Phys. 1981;52:7182–7190. doi: 10.1063/1.328693. [DOI] [Google Scholar]
- 57.Hess B, Bekker H, Berendsen HJ, Fraaije JG. LINCS: a linear constraint solver for molecular simulations. J. Comput. Chem. 1997;18:1463–1472. doi: 10.1002/(SICI)1096-987X(199709)18:12<1463::AID-JCC4>3.0.CO;2-H. [DOI] [Google Scholar]
- 58.Darden T, York D, Pedersen L. Particle mesh Ewald: An N log (N) method for Ewald sums in large systems. J. Chem. Phys. 1993;98:10089–10092. doi: 10.1063/1.464397. [DOI] [Google Scholar]
- 59.Kabsch W, Sander C. Dictionary of protein secondary structure: pattern recognition of hydrogen-bonded and geometrical features. Biopolymers. 1983;22:2577–2637. doi: 10.1002/bip.360221211. [DOI] [PubMed] [Google Scholar]
- 60.Pettersen EF, et al. UCSF Chimera—a visualization system for exploratory research and analysis. J. Comput. Chem. 2004;25:1605–1612. doi: 10.1002/jcc.20084. [DOI] [PubMed] [Google Scholar]
- 61.Gallivan J, Dougherty D. Cation-π interactions in structural biology. Proc. Natl. Acad. Sci. U.S.A. 1999;96:9459–9464. doi: 10.1073/pnas.96.17.9459. [DOI] [PMC free article] [PubMed] [Google Scholar]
- 62.Wang L-L, Li Y, Zhou S-F. A bioinformatics approach for the phenotype prediction of non-synonymous single nucleotide polymorphisms in human cytochromes P450. Drug Metab. Dispos. 2009;37:977–991. doi: 10.1124/dmd.108.026047. [DOI] [PubMed] [Google Scholar]
- 63.Zhao C, et al. Cross-linking mass spectrometry and mutagenesis confirm the functional importance of surface interactions between CYP3A4 and holo/apo cytochrome b5. Biochemistry. 2012;51:9488–9500. doi: 10.1021/bi301069r. [DOI] [PMC free article] [PubMed] [Google Scholar]
- 64.Gao Q, et al. Identification of the interactions between cytochrome P450 2E1 and cytochrome b5 by mass spectrometry and site-directed mutagenesis. J. Biol. Chem. 2006;281:20404–20417. doi: 10.1074/jbc.M601785200. [DOI] [PubMed] [Google Scholar]
Associated Data
This section collects any data citations, data availability statements, or supplementary materials included in this article.


