Abstract
Objectives
Health care workers experience an uncertain risk of aerosol exposure during patient oxygenation. To improve our understanding of these risks, we sought to measure aerosol production during various approaches to oxygenation in healthy volunteers in an emergency department.
Methods
This was a prospective study conducted in an empty patient room in an academic ED. The room was 10 ft. long x 10 ft. wide x 9 ft. tall (total volume 900 ft3) with positive pressure airflow (1 complete turnover of air every 10 minutes). Five oxygenation conditions were used: humidified high‐flow nasal cannula (HFNC) at 3 flow rates [15, 30, and 60 liters per minute (LPM)], non‐rebreather mask (NRB) at 1 flow rate (15 LPM), and closed‐circuit continuous positive airway pressure (CPAP) using the ED ventilator; in all cases a simple procedural mask was used. The NRB and HFNC at 30 LPM maneuvers were also repeated without the procedural mask, and CPAP was applied both with and without a filter. Each subject then sequentially underwent 8 total oxygenation conditions, always in the same order. Each oxygenation condition was performed with the participant on a standard ED bed. Particles were measured by laser aerosol spectrometer, with the detector sampling port positioned directly over the center of the bed, 0.35 meters away and at a 45‐degree angle from the subject's mouth. Each approach to oxygenation was performed for 10 minutes, followed by a 20‐minute room washout (≈ 2 complete room air turnovers). Particle counts were summated for 2 size ranges (150–300 nm and 0.5–2.0 μm) and compared before, during, and after each of the 8 oxygenation conditions.
Results
Eight adult subjects were enrolled (mean age 42 years, body mass index 25). All subjects completed 8 oxygenation procedures (64 total). Mean particle counts per minute across all oxygenation procedures was 379 ± 112 (mean ± SD) for smaller aerosols (150–300 nm) and 9.3 ± 4.6 for larger aerosols (0.5–2.0 μm). HFNC exhibited a flow‐dependent increase in particulate matter (PM) generation—at 60 LPM, HFNC had a substantial generation of small (55% increase) and large particles (70% increase) compared to 15 LPM. CPAP was associated with lowered small and large particle generation (≈ 10–15% below baseline for both sizes of PM). A patient mask limited particle generation with the NRB, where it was associated with a reduction in small and large particulates (average 40% and 20% lower, respectively).
Conclusion
Among 3 standard oxygenation procedures, higher flow rates generally were associated with greater production of both small and large aerosols. A patient mask lowered aerosol counts in the NRB only. Protocol development for oxygenation application should consider these factors to increase health care worker safety.
Keywords: aerosols, health care workers, high‐flow nasal cannula, oxygenation, particulates, SARS‐CoV‐2
1. INTRODUCTION
1.1. Background
Patients presenting to the emergency department with acute hypoxemic respiratory failure may require a range of oxygenation therapies. All such therapies may theoretically generate droplets and/or aerosols, which place health care workers (HCWs) at risk for various infectious diseases. Currently, the potential for airborne transmission of the severe acute respiratory syndrome coronavirus 2 (SARS‐CoV‐2) from patients to HCWs is a global health issue. 1 , 2 There have been heightened safety concerns during the SARS‐CoV‐2 pandemic 3 , as HCWs are among the highest risk groups for both acquisition of SARS‐CoV‐2 and severe coronavirus disease 2019 (COVID‐19). 4
In general, viruses can be passed from person to person in 3 ways: (1) from contact with contaminated surfaces, (2) via larger respiratory droplets (>5 μm), and (3) via aerosolized particles (<5 μm). Aerosols may remain suspended in the air for minutes or even hours and, therefore, travel longer distances. SARS‐CoV‐2 particles are typically in the range of 75–160 nm, although the viral RNA is found in aerosols ranging in size from 0.1 to well over 2.5 μm. 5 , 6
1.2. Importance
With SARS‐CoV‐2 and other respiratory viruses, the amount of particle spread, particulate size, and potential virulence of pathogens contained within droplets remains incompletely characterized, including in health care settings. Researchers have employed a variety of techniques to study the transmission of infectious diseases, including smoke as a tracer to determine the spread of exhaled gases from mannequins, 7 bacterial air cultures from pneumonia patients, 8 and air dispersion from patients during breathing and coughing. 9 A recent study by Miller et al measured aerosol size and mass concentration near human subjects using 2 approaches to oxygenation–both with and without a surgical mask. 10 This study failed to identify significant trends in particle production, owing in part to a limited number of study subjects (n = 2).
1.3. Goals of this investigation
We have built on the model developed by Miller et al to study further the particle generation during various approaches to oxygenation of adults. We specifically sought to estimate aerosol generation from healthy subjects during several common approaches to oxygenation: high‐flow nasal cannula (HFNC), non‐rebreather facemask (NRB), and continuous positive airway pressure (CPAP).
2. METHODS
2.1. Design and setting
This was a prospective study of aerosol particle generation during various approaches to oxygenation using healthy volunteers. The study was conducted in a single unoccupied room in an academic ED; the same room was used for all subjects. The ED room was positive‐pressure ventilated, at roughly 6 room exchanges per hour (1 every 10 minutes). Inflow was above the head of the patient, and outflow was near the sliding door, close to the floor (Figure 1). The Human Research Review Committee of the University of New Mexico Health Sciences Center approved the study before commencement.
FIGURE 1.
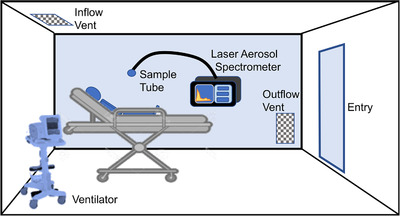
Experimental layout in the emergency department cubicle. Room dimensions were ≈ 10 ft x 10 ft x 9 ft (900 ft3 or 25 m3). Ventilation systems were placed on the opposite side of the stretcher from the Laser Aerosol Spectrometer and particle sampling tube. The sampling tube was placed in the approximate position of a bedside health care worker
2.2. Selection of participants
Healthy subjects between the ages of 25 and 55 years provided verbal consent to participate. Subjects included members of the research team and local HCWs. By institutional policy, subjects were required to confirm having no symptoms related to COVID‐19 before coming on campus each day.
2.3. Oxygenation procedures
The 5 approaches to oxygenation were HFNC at 3 flow rates, NRB, and CPAP. The 3 flow rates for HFNC were 15, 30, and 60 liters per minute (LPM; Optiflow, Fisher & Paykel Healthcare, Auckland, NZ). We used 15 LPM for the NRB (Vyaire Medical Inc, Chicago, IL, USA). For CPAP, we used a non‐invasive ventilator (Phillips V‐60) with a heated bilevel circuit (Fisher & Paykel, RT139) at 10 cmH2O. For all HFNC and NRB approaches, the participant wore a standard procedural mask over the oxygenation device. For HFNC at 30 LPM and the NRB approach, we repeated the approach without the procedural mask, to provide a comparison for the benefit of mask usage in limiting aerosol generation. CPAP ventilation was conducted with and without filtration of the return flow; no procedural mask was used. With all combinations of oxygenation and mask/filter, subjects completed 8 total oxygenation procedures (same order for each subject). The specific order was (1) NRB 15 LPM with procedural mask, (2) NRB 15 LPM without mask, (3) HFNC 15 LPM with mask, (4) HFNC 30 LPM with mask, (5) HFNC 30 LPM without mask, (6) HFNC 60 LPM with mask, (7) CPAP with filter, and (8) CPAP without filter.
Subjects were seated 60 degrees upright on an ED bed (Figure 1). Subjects were asked to remain relatively stationary throughout the testing period and were instructed to breathe normally; no specific protocol for coughing or speaking was implemented. Subjects underwent 8 sequential oxygen procedures, each lasting 10 minutes in duration followed by a 20‐minute washout period. At the end of each 10‐minute oxygenation period, masks and oxygenation were removed at approximately the same time. The ED room, containing only the subject and single researcher (in standard COVID‐19 protocol personal protective equipment (PPE), including an N‐95 mask), remained closed with the exception of washout periods, when oxygenation devices were turned off and systems exchanged.
The Bottom Line
The risks to health care workers from infectious aerosols remain uncertain, despite the urgency of this knowledge during the severe acute respiratory syndrome coronavirus 2 (SARS‐CoV‐2) pandemic. In a simulation‐based study of 8 healthy adults in an emergency department, the investigators present a model for future studies and provide evidence for the relative production of aerosols across a range of oxygenation procedures, with higher flow rates generally associated with greater aerosol production.
2.4. Particle measurement
A single polyurethane tube (1/4” inner diameter) was placed 0.35 meters and 45 degrees from the subject's mouth (Figure 1) and connected to a laser aerosol spectrometer (Model 3340A; TSI, Inc., Shoreview, MN, USA). The placement of the sampling tube was designed to reflect a common position and distance for HCWs actively treating a patient. Particulate matter (PM) was continuously sampled at 1‐minute intervals. Importantly, this assessment does not discriminate between naturally occurring background PM and subject‐derived PM. The investigator remaining in the room wore a procedural mask, stood toward the door (away from the air intake), and kept movement to a minimum (to minimize distribution and measurement of background of PM).
2.5. Data analysis
We summated PM counts in 2 size ranges: 150–300 nm and 0.5–2.0 μm. We selected these ranges owing to much higher background levels of nanosized particles (<300 nm) and because analyzing PM counts separately afforded a better opportunity to observe meaningful trends for different oxygen delivery systems. Furthermore, because of the high variability of background PM levels before the oxygenation procedures, for both PM size ranges and each oxygenation procedure we also summarized PM data for 4 epochs: the 5 minutes before, the first and second 5 minutes during, and the first and second 5 minutes following oxygenation.
For both the smaller (150–300 nm) and larger (0.5–2.0 μm) PM ranges, we calculated the mean PM count and SD for the 4 5‐minute epochs of each oxygenation procedure. We then used 1‐ or 2‐way repeated measures analysis of variance (ANOVA) to assess the change in mean PM counts across the 5 epochs. Finally, we used a Benjamini, Krieger, and Yekutieli post hoc test to understand the influence of flow (HFNC) or the procedural mask (NRB) on PM concentrations. We performed all analyses with GraphPad Prism (v 8.3.1).
3. RESULTS
3.1. Enrollment
Eight healthy subjects were enrolled and completed the full study protocol (8 oxygenation sessions each, 64 total; sessions completed between May 7–22, 2020). Subject demographics and predicted lung vital capacity 11 are provided in Table 1.
TABLE 1.
Characteristics of 8 healthy subjects
| Subject | Sex | Age (years) | Ht (m) | Wt (kg) | Body mass index | Predicted vital capacity (L) |
|---|---|---|---|---|---|---|
| 1 | M | 48 | 1.92 | 110 | 29.8 | 4.27 |
| 2 | F | 39 | 1.75 | 65 | 21.2 | 3.12 |
| 3 | M | 45 | 1.88 | 95 | 26.9 | 4.25 |
| 4 | M | 45 | 1.81 | 85 | 25.9 | 4.09 |
| 5 | M | 50 | 1.70 | 75 | 26.0 | 3.75 |
| 6 | F | 36 | 1.65 | 51 | 18.7 | 2.99 |
| 7 | M | 36 | 1.85 | 90 | 26.3 | 4.37 |
| 8 | F | 35 | 1.65 | 77 | 28.4 | 3.01 |
| Mean (SD) | 41.8 (5.9) | 1.78 (0.10) | 81.0 (18.3) | 25.4 (3.7) | 3.73 (0.60) |
3.2. Particle measures
Average PM counts for all 64 oxygenation procedures were 392 ± 142 per minute (mean ± SD) for smaller PM (150–300 nm) and 10.2 ± 6.2 counts per minute for larger PM (0.5–2.0 μm). For the 5‐minute baseline period, the mean PM counts were 388 ± 112 per minute for the smaller range and 9.4 ± 5.1 per minute for the larger range (baseline relatively stable across all subjects and oxygenation procedures).
3.3. High‐flow nasal cannula
HFNC generated PM in a flow‐related manner, with particle counts lowest for 15 LPM and highest for 60 LPM (Figure 2, absolute PM counts shown). From 5 to 10 minutes after cessation of oxygenation, small PM counts were maximally 30% higher for HFNC at 30 LPM and 55% higher for 60 LPM, both compared to 15 LPM (Figure 3A, % change from each baseline, P < 0.001). For larger PM, we observed a significant change only for 60 LPM–over 70% compared with the baseline (Figure 3B; P < 0.001).
FIGURE 2.
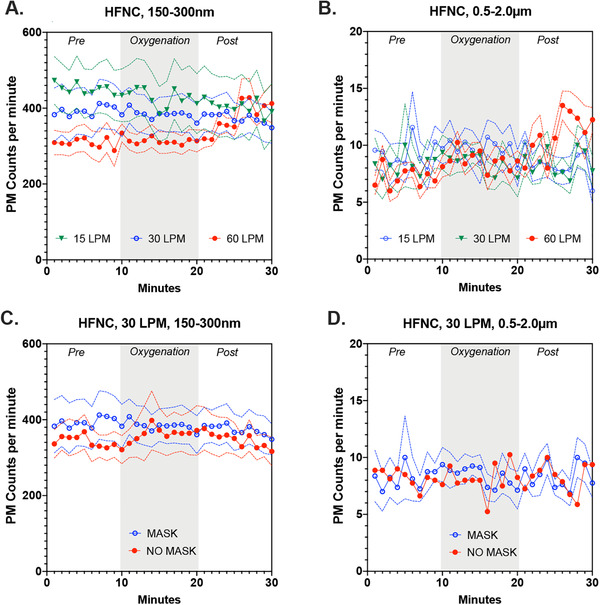
Absolute value of particulate counts per minute for the 2 size fractions (150–300 nm) and (0.5–2.0 μm) during various oxygenation strategies. (A) The effects of flow rate on 150–300 nm aerosol formation from a high‐flow nasal cannula (HFNC), while wearing a procedural mask. (B) The effects of flow rate on aerosols in the range of 0.5–2.0 μm from a HFNC, while wearing a procedural mask. (C) At 30 liters per minute (LPM) for HFNC, the comparisons of particulate matter (PM) generation with and without a procedural mask in place for 150–300 nm particulates. (D) At 30 LPM for HFNC, the comparisons of PM generation with and without a procedural mask in place for 0.5‐2.0m μm particulates. Data shown are mean ± SEM
FIGURE 3.
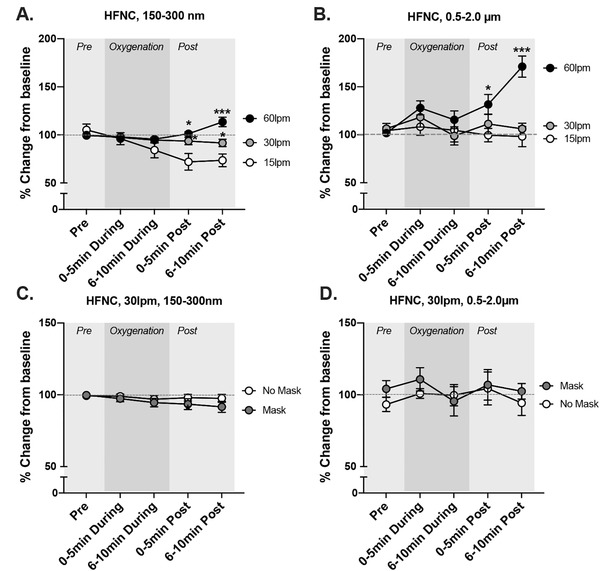
Relative changes in aerosols (150–300 nm) and droplets (0.5–2.0 μm) during various oxygenation strategies. (A) The effects of flow rate on 150–300 nm aerosol formation from a high‐flow nasal cannula (HFNC), while wearing a procedural mask. (B) The effects of flow rate on aerosols in the range of 0.5–2.0 μm from a HFNC, while wearing a procedural mask. (C) At 30 liters per minute (LPM) for HFNC, the comparisons of particulate matter (PM) generation with and without a procedural mask in place for 150–300 nm particulates. (D) At 30 LPM for HFNC, the comparisons of PM generation with and without a procedural mask in place for 0.5–2.0m μm particulates. Data shown are mean ± SEM. Asterisks indicate significant difference from 15 LPM trial at specific time points by a 2‐way repeated measures analysis of variance (*P < 0.05, **P < 0.01, ***P < 0.001)
The addition of a simple facemask to HFNC at 30 LPM was associated with a significant linear reduction for smaller (P = 0.0004) but not larger PM (Figures 3C and 3D). Compared with the baseline, the simple facemask reduced smaller PM counts by 5%–10% during the postoxygenation epochs.
3.4. Non‐rebreather
The NRB (only tested at 15 LMP) led to modest increases in PM–counts increased from baseline by a maximum of 5% and 15% for small and large PM, respectively (Figures 4A,B and 5A,B). The addition of a facemask to the NRB reduced both smaller (Figures 4A and 5A; 20% reduction, P = 0.017) and larger PM (Figures 4B and 5B; 65% reduction, P < 0.001) immediately following the 10‐minute oxygenation.
FIGURE 4.
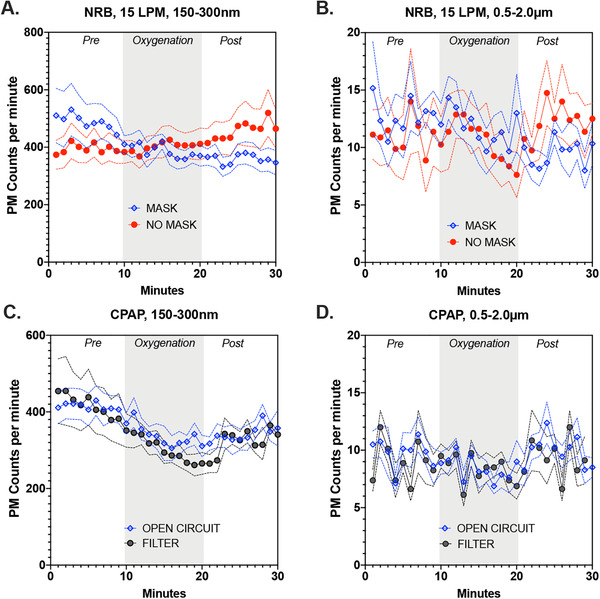
Absolute value of particulate counts per minute for the 2 size fractions (150–300 nm) and (0.5–2.0 μm) during various oxygenation strategies. (A) The effects of procedural mask usage on 150–300 nm aerosol formation from a non‐rebreather mask (NRB) at 15 liters per minute (LPM). (B) The effects of procedural mask usage on 0.5–2.0 μm aerosol formation from a NRB at 15 LPM. (C) The effects of internal filtration of a continuous positive airway pressure (CPAP) device on subject‐derived 150–300 nm aerosol formation. (D) The effects of internal filtration of a CPAP device on subject‐derived 0.5–2 μm aerosol formation. Data shown are mean ± SEM. PM, particulate matter
FIGURE 5.
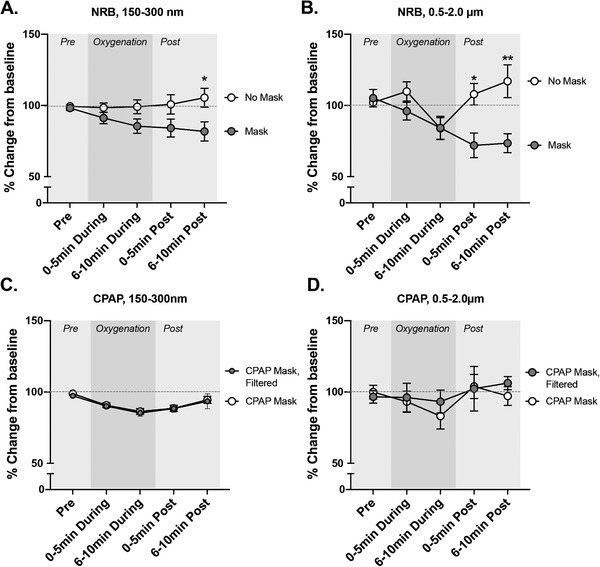
Relative changes in aerosols (150–300 nm) and droplets (0.5‐02.0 μm) during various oxygenation strategies. (A) The effects of procedural mask usage on 150–300 nm aerosol formation from a non‐rebreather mask (NRB) at 15 LPM. (B) The effects of procedural mask usage on 0.5–2.0 μm aerosol formation from a NRB at 15 LPM. (C) The effects of internal filtration of a continuous positive airway pressure (CPAP) device on subject‐derived 150–300 nm aerosol formation. (D) The effects of internal filtration of a CPAP device on subject‐derived 0.5–2 μm aerosol formation. Data shown are mean ± SEM. Asterisks indicate significant difference for mask usage at specific time points by a 2‐way repeated measures analysis of variance (*P < 0.05, **P < 0.01). For CPAP, no significant differences for filtration were noted, but the overall reduction in 150–300 nm particulates during the 10‐minute procedure was highly significant (P < 0.0001) compared to preprocedure for both arms of the experiment
A 2‐way repeated‐measures ANOVA confirmed that the use of the mask and the mask x time interaction affected the reduction in larger PM (P = 0.044 and P < 0.0001, respectively). Similar trends were noted for smaller PM, with the mask factor alone nearing significance (P = 0.0687, 16.5% of variance) and the "mask x time" interaction significantly affecting PM levels (P = 0.0007, 6.3% of variance).
3.5. Continuous positive airway pressure
CPAP was associated with a maximum 15% reduction in smaller PM counts (P < 0.0001; Figures 4C and 5C). Larger PM showed no significant change from baseline (Figure 4D, 5D). The addition of filtration to CPAP was not associated with significant changes in PM counts in either size ranges.
3.6. Secondary analysis
To examine further the impact of a simple facemask on PM counts, we performed a follow‐up 3‐way ANOVA, combining data from the NRB at 15 LPM and HFNC at 30 LPM. We included 3 factors–time, oxygenation conditions, and the facemask. For smaller PM, the effect of the mask (P = 0.0375) and time (P = 0.002) remained significant. Facemask usage accounted for 10.0% of the data variation, and time accounted for 2.9%. For larger PM, the mask factor was not significant, although mask x time was a significant factor (P = 0.018).
3.7. Limitations
Our study has several important limitations. First, we included only a small number of healthy subjects, and we did not attempt to model issues known to produce more aerosols, such as coughing, sneezing, or increased airway mucous. A larger, more diverse sample of patients might produce meaningfully different PM count patterns. Second, we found that day‐to‐day variation in background PM counts in the study room precluded any reasonable estimates of “background” versus “subject‐derived” PM. When we attempted to measure background levels in the empty room, we often measured particle counts at or above those measured when subjects and investigators were present. We estimate that the subject‐derived PM is a very small percentage of our totals—at most 30%. Therefore, changes in total PM counts actually reflect a muted overall change of subject‐derived PM, which are much more substantial than we could delineate. Lastly, we studied the spatial distribution and air convection pattern of a single room. The spatial distribution was designed to mirror a HCW in a working position close to the head of a patient. However, the room and the subject were quite still during the process, and the investigator generally stood further away from the bedside. In a true clinical setting, a great deal of activity would lead to a more complex pattern of air convection and PM production and movement. Methods to delineate patient‐derived versus other PM in clinical settings would be exceedingly challenging.
4. DISCUSSION
Research into the generation, dispersion, and duration of aerosols is essential for optimal clinical guidance to protect HCWs from infectious diseases during respiratory procedures. The present study adds to the literature by (1) considering real‐time PM counts obtained from a position approximating an actively engaged HCWs; (2) using healthy subjects breathing normally; (3) assessing small and larger aerosols; (4) determining the impact of a range of HFNC flow rates; and (5) considering the impact of procedural mask or filter. Our general conclusions are that, for the conditions studied, HFNC flow rates of 30–60 LPM led to substantially greater generation of aerosols, whereas the procedural mask modestly helped to limit the generation of aerosols with 30 LMP (5%–20% reduction, depending on conditions). At 60 LPM, PM was substantially increased despite the use of the procedural mask. The self‐contained CPAP circuit appeared to lower the levels of PM in the vicinity of a bedside HCW.
HCWs are among the groups at the highest risk of both contracting the SARS‐CoV‐2 virus and developing severe COVID‐19. 4 Using healthy subjects, our study suggests that lower flow HFNC, a NRB, CPAP, and patient mask usage can modestly reduce the generation of smaller‐sized aerosols. Our study further suggests that aerosol‐sized PM may be generated even in healthy subjects, without coughing or increased sputum, because of airway shear stress, vibration, and sporadic collapse/reopening of terminal bronchioles. 3 Coughing, sneezing, and increased upper airway mucous production, which are all components of severe COVID‐19, may amplify the generation of aerosol‐sized PM. 3
Aerosol transmission of infectious diseases, especially in a closed setting, is an essential means of viral spread. 12 Humans can produce a wide range of particle size range during breathing, coughing, and sneezing. Although the SARS‐CoV‐2 virus ranges in size from 75 to 160 nm, 5 patients can produce particles ranging from 0.05 to >100 μm. 6 Our results in healthy human subjects were consistent with an in silico transmission modeling study 13 and a recent study of a simulated patient, wherein droplet spread was higher with greater HFNC flow rates. 14 In that study, investigators also modeled aerosol spread for patients with moderate and severe lung disease, which ultimately dampened flow and led to reduced aerosol distribution. A general gap for these studies, as well as the present report, is the absence of information on whether measured droplets had the potential to carry pathogens.
In summary, we modeled the position of HCWs directly working with a patient in an ED bed and found that, with healthy subjects, specific oxygenation procedures can increase or decrease the PM burden in the room. The contribution to background PM counts, however, was relatively low. Based upon our findings and until additional studies are conducted, it may be advisable to restrict HFNC to 30 LPM or less when HCWs’ respiratory protection cannot be assured. Placing a procedure mask over oxygen‐delivery masks and cannulas also seems prudent to limit the potential for viral transmission. The impact of any of these changes may be modest, however, and HCW should continue to practice optimal PPE donning and doffing to optimize protection.
FINANCIAL DISCLOSURES
All authors have no financial interests to disclose.
AUTHOR CONTRIBUTIONS
Study design–EP, JTB, MJC, JF, DH, EK, PM, BW, ML, DB; data collection–EP, MJC, JF, DH, PM, BW; JTB. Data Analysis–EP, MJC, DH, BW; manuscript preparation–JTB, MJC, PM, DB; manuscript editing–EP, JTB, MJC, JF, DH, EK, PM, BW, ML, DB.
ACKNOWLEDGMENTS
This work was supported in part by the University of New Mexico Clinical and Translational Sciences Center Career Development Program (KL2 TR001448) and also by the University of New Mexico Center for Metals in Biology and Medicine (P20 GM130422).
Biography
Darren Braude, MD, MPH, is a Professor in the Department of Emergency Medicine and specializes in EMS and Disaster Medicine at the University of New Mexico.

Pearce E, Campen MJ , Baca JT, et al. Aerosol generation with various approaches to oxygenation in healthy volunteers in the emergency department. JACEP Open. 2021;2:e212390. 10.1002/emp2.12390
Funding and support: By JACEP Open policy, all authors are required to disclose any and all commercial, financial, and other relationships in any way related to the subject of this article as per ICMJE conflict of interest guidelines (see www.icmje.org). The authors have stated that no such relationships exist.
Supervising Editor: Benjamin Kerrey, MS, MS
REFERENCES
- 1. Agarwal A, Basmaji J, Muttalib F, et al. High‐flow nasal cannula for acute hypoxemic respiratory failure in patients with COVID‐19: systematic reviews of effectiveness and its risks of aerosolization, dispersion, and infection transmission. Can J Anaesth. 2020;67:1217–1248. [DOI] [PMC free article] [PubMed] [Google Scholar]
- 2. Jayaweera M, Perera H, Gunawardana B & Manatunge J. Transmission of COVID‐19 virus by droplets and aerosols: a critical review on the unresolved dichotomy. Environ Res. 2020;188:109819. [DOI] [PMC free article] [PubMed] [Google Scholar]
- 3. Dhand R & Li J. Coughs and sneezes: their role in transmission of respiratory viral infections, including SARS‐CoV‐2. Am J Respir Crit Care Med. 2020;202(5):651‐659. [DOI] [PMC free article] [PubMed] [Google Scholar]
- 4. Cournoyer A, Maison SG, Lonergan AM, et al. Oxygen therapy and risk of infection for health care workers caring for patients with viral severe acute respiratory infection: a systematic review and meta‐analysis. Ann Emerg Med. 2021;77:19–31. [DOI] [PMC free article] [PubMed] [Google Scholar]
- 5. Simpson JP, , Wong DN, Verco L, et al. Measurement of airborne particle exposure during simulated tracheal intubation using various proposed aerosol containment devices during the COVID‐19 pandemic. Anaesthesia. 2020;75(12):1587‐1595. [DOI] [PMC free article] [PubMed] [Google Scholar]
- 6. Gralton J, Tovey E, McLaws ML & Rawlinson WD. The role of particle size in aerosolized pathogen transmission: a review. J Infect. 2011;62:1–13. [DOI] [PMC free article] [PubMed] [Google Scholar]
- 7. Hui DS, Chow BK, Lo T, et al. Exhaled air dispersion during noninvasive ventilation via helmets and a total facemask. Chest. 2015;147:1336–1343. [DOI] [PMC free article] [PubMed] [Google Scholar]
- 8. Leung CCH, Joynt GM, Gomersall CD, et al. Comparison of high‐flow nasal cannula versus oxygen face mask for environmental bacterial contamination in critically ill pneumonia patients: a randomized controlled crossover trial. J Hosp Infect. 2019;101:84–87. [DOI] [PubMed] [Google Scholar]
- 9. Hui DS, Chow BK, Chu L, et al. Exhaled air dispersion during coughing with and without wearing a surgical or N95 mask. PLoS One. 2012;7:e50845. [DOI] [PMC free article] [PubMed] [Google Scholar]
- 10. Miller DC, Beamer PD, et al. Aerosol risk with noninvasive respiratory support in patients with COVID‐19. J Am Coll Emerg Physicians Open. 2020;1(4):521‐526. [DOI] [PMC free article] [PubMed] [Google Scholar]
- 11. Baldwin ED, Cournand A & Richards DW, Jr. Pulmonary insufficiency; physiological classification, clinical methods of analysis, standard values in normal subjects. Med (Baltimore). 1948;27:243–278. [PubMed] [Google Scholar]
- 12. Tang S, Mao Y, Jones MY, et al. Aerosol transmission of SARS‐CoV‐2? Evidence, prevention and control. Environ Int. 2020;144:106039. [DOI] [PMC free article] [PubMed] [Google Scholar]
- 13. Leonard S, Atwood CW Jr., Walsh BK, et al. Preliminary findings on control of dispersion of aerosols and droplets during high‐velocity nasal insufflation therapy using a simple surgical mask: implications for the high‐flow nasal cannula. Chest. 2020;158(3):1046‐1049. [DOI] [PMC free article] [PubMed] [Google Scholar]
- 14. Hui DS, Chow BK, Lo T, et al. Exhaled air dispersion during high‐flow nasal cannula therapy versus CPAP via different masks. Eur Respir J. 2019;53:1802339. [DOI] [PubMed] [Google Scholar]


