

Abstract
Current understandings on cell motility and directionality rely heavily on accumulated investigations of the adhesion–actin cytoskeleton–actomyosin contractility cycles, while microtubules have been understudied in this context. Durotaxis, the ability of cells to migrate up gradients of substrate stiffness, plays a critical part in development and disease. Here, we identify the pivotal role of Golgi microtubules in durotactic migration of single cells. Using high‐throughput analysis of microtubule plus ends/focal adhesion interactions, we uncover that these non‐centrosomal microtubules actively impart leading edge focal adhesion (FA) dynamics. Furthermore, we designed a new system where islands of higher stiffness were patterned within RGD peptide coated polyacrylamide gels. We revealed that the positioning of the Golgi apparatus is responsive to external mechanical cues and that the Golgi–nucleus axis aligns with the stiffness gradient in durotaxis. Together, our work unveils the cytoskeletal underpinning for single cell durotaxis. We propose a model in which the Golgi–nucleus axis serves both as a compass and as a steering wheel for durotactic migration, dictating cell directionality through the interaction between non‐centrosomal microtubules and the FA dynamics.
Keywords: durotaxis, Golgi, mechanobiology, microtubules
Subject Categories: Cell Adhesion, Polarity & Cytoskeleton
The Golgi‐nucleus axis serves both as a compass and a steering wheel for durotactic migration, dictating cell directionality through the interaction between non‐centrosomal microtubules and the FA dynamics.
Introduction
Directional cell motility is required for embryonic development and tissue homeostasis (Locascio & Nieto, 2001; Ridley et al, 2003; Luster et al, 2005; Friedl & Gilmour, 2009), while its dysregulation leads to disease states including metastasis (Yamaguchi et al, 2005; Bravo‐Cordero et al, 2012). Efficient cell migration requires the mechanical interplay between the cell and its environment–force generated at the adhesion sites is utilized to propel the cytoskeletal machinery. The role of actomyosin network and its interaction with the focal adhesions (FAs) have been heavily investigated in random migration as well as in directed cell movement (Swaminathan et al, 2016). Fibroblasts lacking the Arp2/3‐branched actin exhibit defects in crawling toward an extracellular matrix gradient (haptotaxis) (Wu et al, 2012). Moreover, the polarized myosin IIB activity has been shown to be critical for mesenchymal cells to chemotax (Asokan et al, 2014). In contrast, the microtubule cytoskeleton has been understudied in the context of directional cell migration, although its polarized architecture has long been documented at the wound edge during collective cell motility (Salaycik et al, 2005; Li & Gundersen, 2008; Etienne‐Manneville, 2013). Aside from chemotaxis and haptotaxis, cells can also move toward the stiff end of the substrate (durotaxis) (Lo et al, 2000; Isenberg et al, 2009; Choi et al, 2012; Vincent et al, 2013; Hartman et al, 2016; Sunyer et al, 2016; Hadden et al, 2017; Kim et al, 2020), which involves detecting the stiffness bias and subsequently crawling toward that direction. Mechanisms proposed to underlie mesenchymal cell durotaxis include probing of the local environment by actin based protrusions and oscillating focal adhesions, as well as polarized contracting of the cell body by the actomyosin network (Plotnikov et al, 2012; Raab et al, 2012; Plotnikov & Waterman, 2013; Wong et al, 2014; Wormer et al, 2014; Sunyer et al, 2016). In the scenario of durotactic migration, much less is known about the role of the microtubule network.
The mechanical properties of microtubules contribute to force generation in cells. Microtubule assembly and disassembly can generate force to be utilized in mitosis (Dogterom et al, 2005). In migrating cells, persistent elongation of microtubules toward the leading edge and their crosslinking with other cytoskeletal elements promote membrane protrusion (Etienne‐Manneville, 2013). During tissue morphogenesis, global patterning of polarized microtubule cytoskeleton controls the mechanics of individual cells to coordinate collective cell behavior (Singh et al, 2018). Intriguingly, the microtubule dynamics is also force‐dependent. Pulling back the nucleus or stiffening the substrate instantaneously induces microtubule outgrowth (Kaverina et al, 2002). Moreover, subcellular localization of the centrosome is also responsive to extracellular matrix stiffness (Raab & Discher, 2017). Aside from these cellular mechanical functions, microtubules also play multifaceted roles in regulating FA dynamics. On one hand, depolymerization of microtubules leads to release of GEF‐H1 from the microtubule lattice, which induces local activation of RhoA (Krendel et al, 2002; Chang et al, 2008). Enhanced RhoA activity then triggers either integrin activation or FA assembly (Bershadsky et al, 1996; Wittmann & Waterman‐Storer, 2001; Zhou et al, 2001). On the other hand, microtubule attachment and stabilization around FA sites involve in adhesion turnover or disassembly (Kaverina et al, 1999; Ezratty et al, 2005). A number of proteins have been identified to participate in this process, including ACF7 (Wu et al, 2008), CLASPs (CLIP‐associated proteins) (Stehbens et al, 2014), ELKS, LL5β (Lansbergen et al, 2006), and KANK1 (Bouchet et al, 2016).
Aside from the microtubule organizing center (MTOC) localized at the centrosome, alternative cytoplasmic sites also serve as MTOCs for microtubules (Wu & Akhmanova, 2017). Golgi is a major center for non‐centrosomal microtubule origination and anchorage (Zhu & Kaverina, 2013). CLASPs and AKAP450 (also known as AKAP9 or CG‐NAP) are critical Golgi microtubule nucleators (Efimov et al, 2007; Rivero et al, 2009), while the calmodulin‐regulated spectrin‐associated protein (CAMSAP)/Patronin/Nezha family can bind to the minus ends of non‐centrosomal microtubules to facilitate their stabilization and docking at the Golgi apparatus (Jiang et al, 2014; Akhmanova & Hoogenraad, 2015; Wu et al, 2016). These microtubules in turn promote Golgi organization and polarized vesicle trafficking (Miller et al, 2009), and are essential to maintain persistent cell migration (Miller et al, 2009; Wu et al, 2016; Martin et al, 2018).
In this study, we observe that the Golgi microtubules are required for mesenchymal durotaxis of single cells, while the centrosome is dispensable. By simultaneously monitoring the dynamics of FAs and the microtubule plus ends, we conclude that the Golgi microtubules specifically regulate FA turnover, possibly through post‐Golgi trafficking toward the FA region. We further uncover the spatial‐temporal response of Golgi positioning in response to mechanical cues. Our data suggest that re‐positioning of the Golgi apparatus—triggered by mechanical cues—may organize polarized FA disassembly through Golgi microtubules. Our work establishes important connections among Golgi positioning, microtubule network, FA dynamics, and durotactic migration.
Results
Microtubules are essential for single cell durotaxis
In order to examine single cell durotaxis, polyacrylamide gels with stiffness gradient (~ 30 kPa/mm) were manufactured as previously described (Sunyer et al, 2016) with modifications (Fig 1A). Extracellular matrix (ECM) proteins such as fibronectin or collagen were then crosslinked to the gel surface to facilitate efficient cell adhesion and spreading. In order to visualize the homogeneity of coated surface, fluorescently labeled fibronectin was mixed into the total batch (Fig 1B). In contrast to earlier reports that the soft matrix tended to absorb more ECM molecules(Lo et al, 2000), we detected relatively even coating of fibronectin at the gradient gel surface (Hadden et al, 2017) (Fig 1B), compared to the glass surface or gels with constant stiffness (Fig EV1A). This ensured that the directional migration we observed was not due to a haptotactic cue. Under our experimental setting, human retinal pigment epithelial (hRPE) cells moved upward the stiff end of the gradient gel, without significant alterations in velocity, as tracked by their position at different time points followed by directionality analysis (Figs 1C and EV1B, Movie EV1). Single cell durotaxis was previously reported in several cancer cell lines and was shown to be abolished upon Arp2/3 inhibition (DuChez et al, 2019). However, inhibition of the Arp2/3 complex by CK‐666 failed to affect hRPE single cell durotaxis (Figs 1D, and EV1, EV2, EV3, EV4C and F, Movie EV2). Interestingly, when we applied nocodazole to inhibit microtubule polymerization (Figs 1E and EV1D), durotaxis of individual cells was abolished—while cell velocity also decreased (Figs 1E and EV1, EV2, EV3, EV4, Movie EV3). These observations indicate an intriguing role of the microtubule network but not Arp2/3‐branched actin in mediating mechanical force‐induced directional cell migration.
Figure 1. Microtubules are essential for single cell durotaxis.
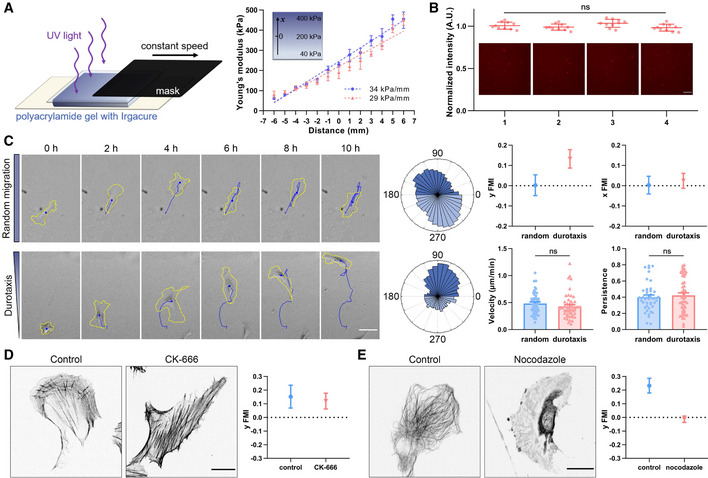
- Left: Schematic diagram of manufacturing polyacrylamide gels with stiffness gradient. The gel containing photoinitiator is solidified by ultraviolet light irradiation. Mask with a constant speed is used to control the irradiation time for a hardness gradient. Right: Representative stiffness gradient of polyacrylamide gels measured by atomic force microscope was plotted (34 and 29 kPa/mm, respectively). All error bars are s.e.m. (n = 5 regions, replicates are biological).
- Representative images of fluorescently labeled fibronectin at the gradient gel surface and the quantification of fluorescence intensity. 1–4 in turn represent hard to soft areas. Scale bar: 100 μm. All error bars are s.e.m. (n = 10 regions, replicates are biological), ns, not significant, by one‐way ANOVA.
- Left: Representative time‐lapse images showing the migration of single hRPE cells on the surface of polyacrylamide gels with uniform stiffness (top) and stiffness gradient (bottom), referring as random migration and durotaxis migration, respectively. Yellow line is the cell outline, and blue line is the cell migration trajectory. Scale bar: 50 μm. Middle: Angular displacement of hRPE cells on the uniform stiffness gels (top) and stiffness gradient gels (bottom). Right: y/x FMI (forward migration index), velocity and persistence of hRPE cells with random migration and durotaxis. All error bars are s.e.m. (n = 50 cells, replicates are biological), ns, not significant, by Student's t‐test.
- Left: Representative immunofluorescent staining of F‐actin in control and CK‐666 (100 μM, 3 h)‐treated hRPEs. Scale bar: 20 μm. Right: Y FMI of control and CK‐666 (100 μM, pre‐treated for 1 h and incubated for the whole experiment)‐treated hRPEs moving on stiffness gradient gel. All error bars are s.e.m. (n = 50 cells, replicates are biological).
- Left: Representative immunofluorescent staining of α‐tubulin in control and nocodazole (8 μM, 30 min)‐treated hRPEs. Scale bar: 20 μm. Right: Y FMI of control and nocodazole (8 μM, pre‐treated for 10 min and incubated for the whole experiment)‐treated hRPEs moving on stiffness gradient gel. All error bars are s.e.m. (n = 50 cells, replicates are biological).
Figure EV1. Microtubules are essential for single cell durotaxis.
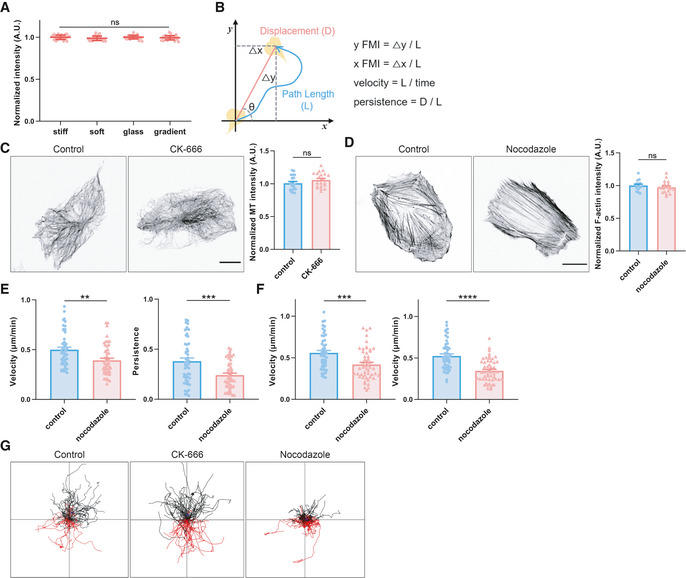
- Quantification of fluorescence intensity of fluorescently labeled fibronectin at the stiff or soft uniform gel, glass and gradient gel surface. All error bars are s.e.m. (n = 30 regions, replicates are biological), ns, not significant, by one‐way ANOVA.
- Schematic diagram of a cell trajectory (blue line) and variables used to characterize migratory phenotypes. The equations used to calculate cell migration parameters are listed on the right.
- Left: Representative immunofluorescent staining of α‐tubulin in control and CK‐666 (100 μM, 3 h)‐treated hRPEs. Scale bar: 20 μm. Right: Quantification of microtubule fluorescence intensity. All error bars are s.e.m. (n = 20 cells, replicates are biological), ns, not significant, by Student's t‐test.
- Left: Representative immunofluorescent staining of F‐actin in control and nocodazole (8 μM, 30 min)‐treated hRPEs. Scale bar: 20 μm. Right: Quantification of F‐actin fluorescence intensity. All error bars are s.e.m (n = 20 cells, replicates are biological), ns, not significant, by Student's t‐test.
- Velocity and persistence of control and nocodazole (8 μM, pre‐treated for 10 min and incubated for the whole experiment)‐treated hRPEs moving on stiffness gradient gel. All error bars are s.e.m. (n = 50 cells, replicates are biological), **P < 0.01, ***P < 0.001, by one‐way ANOVA.
- Velocity of control and nocodazole (8 μM, pre‐treated for 10 min and incubated for the whole experiment)‐treated hRPEs moving on glass‐bottom dishes (stiff substrate, left) and uniform gels (30 kPa, soft substrate, right). All error bars are s.e.m. (n = 50 cells, replicates are biological), ***P < 0.001, ****P < 0.0001, by Student's t‐test.
- Individual cell migration trajectories showing control, CK‐666‐treated (100 μM, pre‐treated for 1 h and incubated for the whole experiment), and nocodazole‐treated (8 μM, pre‐treated for 10 min and incubated for the whole experiment) hRPEs moving on stiffness gradient gels. Black line: cells moving toward the stiff side, red line: cells moving toward the soft side.
Figure EV2. Single cell durotaxis is under the regulation by Golgi microtubules.
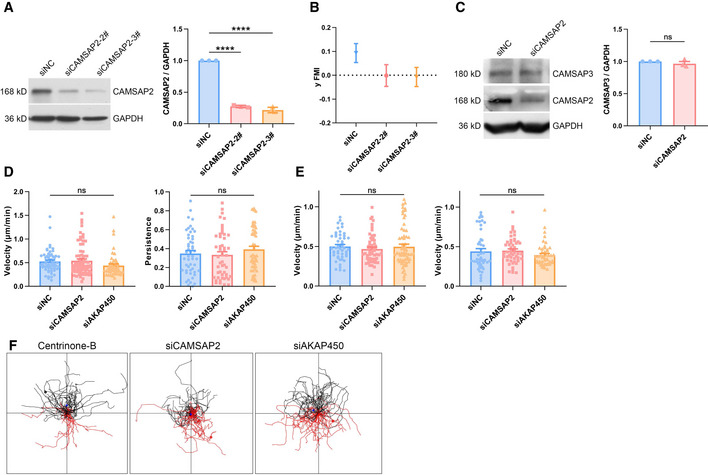
- Western blot showing the protein level of CAMSAP2 in negative control and other two CAMSAP2 siRNA‐transfected hRPEs. GAPDH was used as loading control. Bar chart shows quantification of protein levels normalized to GAPDH in each condition. All error bars are s.e.m (n = 3 independent experiments, replicates are biological), ****P < 0.0001, by Student's t‐test.
- Y FMI of negative control and other two CAMSAP2 siRNA‐transfected hRPEs moving on stiffness gradient gels. All error bars are s.e.m. (n = 50 cells, replicates are biological).
- Western blot showing the protein level of CAMSAP3 and CAMSAP2 in negative control and CAMSAP2 siRNA‐transfected hRPEs. GAPDH was used as loading control. Bar chart shows quantification of protein levels normalized to GAPDH in each condition. All error bars are s.e.m. (n = 3 independent experiments, replicates are biological), ns, not significant, by Student's t‐test.
- Velocity and persistence of negative control, CAMSAP2, and AKAP450 siRNA‐transfected hRPEs moving on stiffness gradient gels. All error bars are s.e.m. (n = 50 cells, replicates are biological), ns, not significant, by one‐way ANOVA.
- Velocity of negative control, CAMSAP2, and AKAP450 siRNA‐transfected hRPEs moving on glass‐bottom dishes (stiff substrate, left) and uniform gels (30 kPa, soft substrate, right). All error bars are s.e.m. (n = 50 cells, replicates are biological), ns, not significant, by one‐way ANOVA.
- Individual cell migration trajectories showing centrinone‐B (500 nM, 7 days)‐treated and CAMSAP2, AKAP450 siRNA‐transfected hRPEs moving on stiffness gradient gels. Black line: cells moving toward the stiff side, red line: cells moving toward the soft side.
Figure EV3. Loss of Golgi microtubules does not affect RhoA activity or cell contraction.
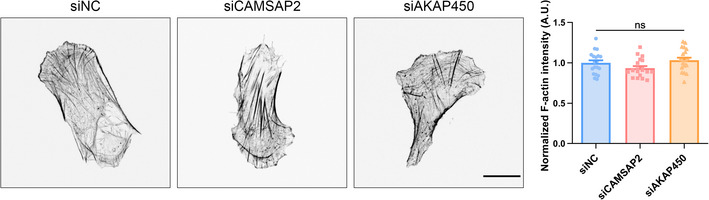
Left: Representative immunofluorescent staining of F‐actin in negative control, CAMSAP2, and AKAP450 siRNA‐transfected hRPEs. Scale bar: 20 μm. Right: Quantification of F‐actin fluorescence intensity. All error bars are s.e.m. (n = 20 cells, replicates are biological), ns, not significant, by one‐way ANOVA.
Figure EV4. The Golgi apparatus is oriented in response to mechanical cues to maintain cell polarity.
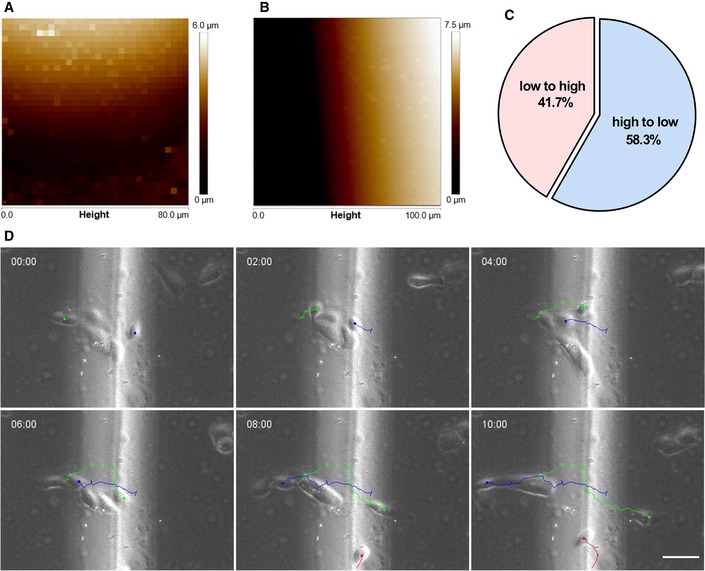
- Height map of polyacrylamide gels with stiff islands measured by atomic force microscope.
- Height map of polyacrylamide gels with height difference but without stiffness difference measured by atomic force microscope.
- Quantification of the percentage of cells moving across the height boundary. N = 12 cells, replicates are biological.
- Representative time‐lapse images showing the migration of single hRPE cells on polyacrylamide gels with height difference but without stiffness difference. Color line is the cell migration trajectory. Scale bar: 50 μm.
Single cell durotaxis is under the regulation of Golgi microtubules
As has been shown recently, the centrosomal and non‐centrosomal microtubules play differential roles in cell migration persistence (Martin et al, 2018). Thus, we asked what would be the effects of depleting either of these microtubules on single cell durotaxis. Using the Plk4 inhibitor centrinone‐B (Wong et al, 2015) to devoid cells of centrosomal microtubules (Fig 2A), we noticed insignificant changes in microtubule amount or plus tip dynamics (Fig 2G–I), consistent with previous studies (Martin et al, 2018). In contrast to nocodazole‐treated cells, the durotaxis index was not perturbed in these centrinone‐B‐treated cells (Figs 2B and EV2F, Movie EV4). This result argues that the centrosomal microtubules are not essential for durotaxis of individual cells.
Figure 2. Single cell durotaxis is under the regulation by Golgi microtubules.
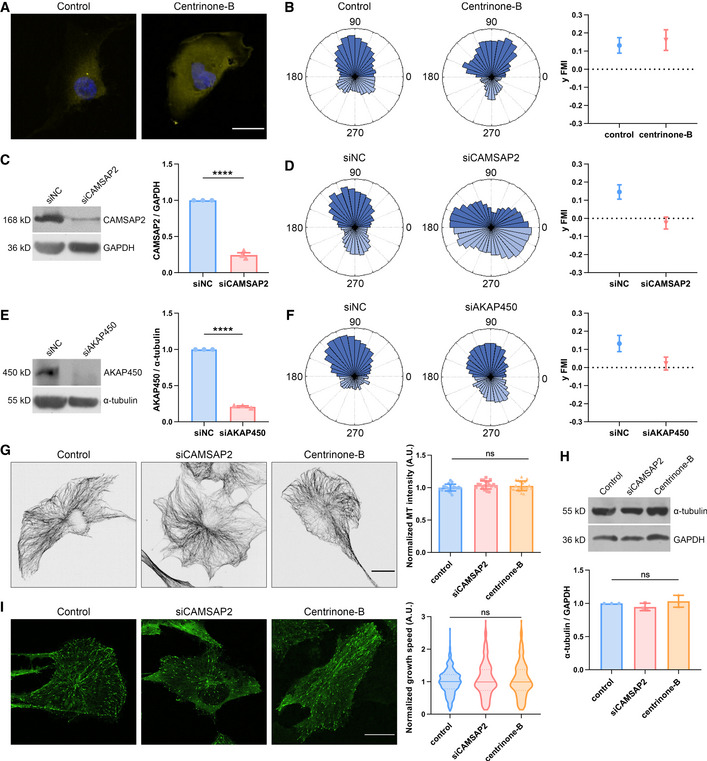
- Representative immunofluorescent staining of γ‐tubulin (yellow) and DAPI (blue) in control and centrinone‐B (500 nM, 7 days)‐treated hRPEs. Scale bar: 20 μm.
- Angular displacement and y FMI of control and centrinone‐B (500 nM, 7 days)‐treated hRPEs moving on stiffness gradient gels. All error bars are s.e.m. (n = 50 cells, replicates are biological).
- Western blot showing the protein level of CAMSAP2 in negative control and CAMSAP2 siRNA‐transfected hRPEs. GAPDH was used as loading control. Bar chart shows quantification of protein levels normalized to GAPDH in each condition. All error bars are s.e.m. (n = 3 independent experiments, replicates are biological), ****P < 0.0001, by Student's t‐test.
- Angular displacement and y FMI of negative control and CAMSAP2 siRNA‐transfected hRPEs moving on stiffness gradient gels. All error bars are s.e.m. (n = 50 cells, replicates are biological).
- Western blot showing the protein level of AKAP450 in negative control and AKAP450 siRNA‐transfected hRPEs. α‐tubulin was used as loading control. Bar chart shows quantification of protein levels normalized to α‐tubulin in each condition. All error bars are s.e.m. (n = 3 independent experiments, replicates are biological), ****P < 0.0001, by Student's t‐test.
- Angular displacement and y FMI of control and AKAP450 siRNA‐transfected hRPEs moving on stiffness gradient gels. All error bars are s.e.m. (n = 50 cells, replicates are biological).
- Left: Representative immunofluorescent staining of α‐tubulin in control, CAMSAP2 siRNA‐transfected, and centrinone‐B (500 nM, 7 days)‐treated hRPEs. Scale bar: 20 μm. Right: Quantification of microtubule fluorescence intensity. All error bars are s.e.m. (n = 20 cells, replicates are biological), ns, not significant, by one‐way ANOVA.
- Western blot showing the protein level of α‐tubulin in control, CAMSAP2 siRNA‐transfected, and centrinone‐B (500 nM, 7 days)‐treated hRPEs. GAPDH is used as loading control. Bar chart shows quantification of protein levels normalized to GAPDH in each condition. All error bars are s.e.m. (n = 3 independent experiments, replicates are biological), ns, not significant, by one‐way ANOVA.
- Left: Representative live‐cell fluorescence imaging of EGFP‐EB1 in control, CAMSAP2 siRNA‐transfected, and centrinone‐B (500 nM, 7 days)‐treated hRPEs. Scale bar: 20 μm. Right: Quantification of EB1 growth speed obtained by plusTipTracker. Violin plot center lines denote the median, and dashed lines represent the 25th and 75th percentiles. N = 10 cells, replicates are biological, ns, not significant, by one‐way ANOVA.
Next, we utilized siRNAs to knock down CAMSAP2 (Figs 2C and EV2, EV3, EV4A and C), which functions to anchor microtubules onto the Golgi and to facilitate the generation of Golgi‐derived microtubules (Wu et al, 2016). Consistent with previous reports (Martin et al, 2018), these manipulations did not alter the total amount of microtubules in individual cells, as revealed by immunofluorescent staining and Western blot (Fig 2G and H). Live‐cell imaging and subsequent tracking of EGFP tagged EB1 showed that cells lacking these proteins had intact microtubule dynamics (Fig 2I). Strikingly, these cells significantly reduced their forward migration index (FMI) in durotaxis. Instead of migrating upwards the stiff end, they appeared to move randomly on a gradient gel but with similar velocity compared to control cells (Figs 2D and EV2, EV3, EV4B, D–F, Movie EV5). Meanwhile, upon knocking down of AKAP450 which plays a key part in maintaining the population of Golgi‐derived microtubules (Rivero et al, 2009), we also detected reduced directionality in single cell durotaxis (Figs 2E and F, and EV2, EV3, EV4, Movie EV6). Taken together, these observations demonstrate a pivotal role of the Golgi microtubules in sensing and maintaining cellular polarity during mechanical cue‐induced directional motility.
Loss of Golgi microtubules does not affect RhoA activity or cell contraction
RhoA activity and cell contraction are effective in durotaxis of collective cells (Sunyer et al, 2016). One possible mechanism that may explain the loss of durotaxis upon non‐centrosomal microtubule removal is that GEF‐H1 is released from the microtubule lattice, leading to RhoA activation (Krendel et al, 2002). We then set to interrogate whether the influence on durotaxis from loss of the Golgi microtubule is mediated by altered RhoA activity. First, upon silencing of CAMSAP2, we did not detect aberrant GTP‐RhoA or the total RhoA protein abundance by Western blotting (Fig 3A). Meanwhile, perturbation of the non‐centrosomal microtubules did not significantly change F‐actin abundance in cells (Fig EV3A). Second, We also employed a previously described RhoA biosensor (Piekny & Glotzer, 2008) to probe RhoA activity in individual cells. Our result indicated that RhoA is not overactivated upon disturbance of the Golgi microtubules (Fig 3B). Furthermore, since myosin light chain (MLC) gets phosphorylated by ROCK upon RhoA activation (Lessey et al, 2012), we then probed pMLC in control cells and in those with Golgi microtubule deficiency. Indeed, we detected unchanged pMLC level by immunofluorescent staining and Western blot (Fig 3C). Furthermore, cell contraction assayed from collagen deformation demonstrated that knocking down CAMSAP2 or AKAP450 did not alter cell contractility (Fig 3D). Collectively, these data reveal that loss of the Golgi microtubules has little effect on RhoA activity. Mechanisms other than altered RhoA activation are required to explain the loss of durotaxis upon Golgi microtubule disruption.
Figure 3. Loss of Golgi microtubules does not affect RhoA activity or cell contraction.
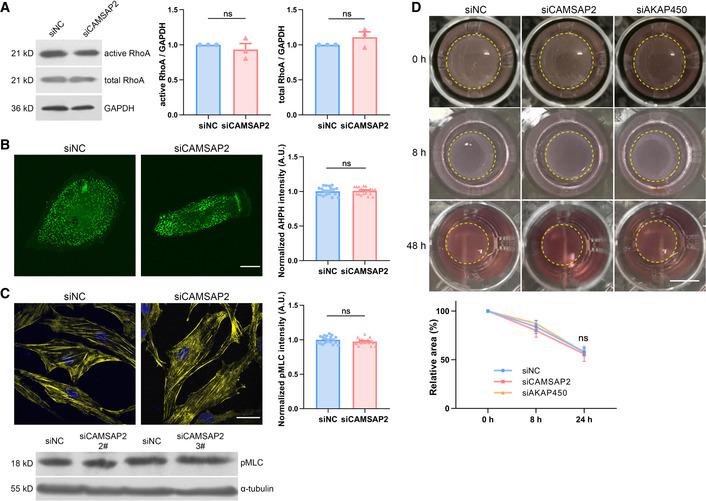
- Western blot showing the protein level of active RhoA, total RhoA in negative control, and CAMSAP2 siRNA‐transfected hRPEs. GAPDH is used as loading control. Bar chart shows quantification of protein levels normalized to GAPDH in each condition. All error bars are s.e.m. (n = 3 independent experiments, replicates are biological), ns, not significant, by Student's t‐test.
- Left: Representative live‐cell fluorescence imaging of GFP‐AHPH in negative control and CAMSAP2 siRNA‐transfected hRPEs. Scale bar: 20 μm. Right: Quantification of GFP‐AHPH fluorescence intensity. All error bars are s.e.m. (n = 20 cells, replicates are biological), ns, not significant, by Student's t‐test.
- Left: Representative immunofluorescent staining of pMLC (yellow) and DAPI (blue) in negative control and CAMSAP2 siRNA‐transfected hRPEs. Scale bar: 20 μm. Right: Quantification of pMLC fluorescence intensity. All error bars are s.e.m. (n = 20 cells, replicates are biological), ns, not significant, by Student's t‐test. Below: Western blot showing the protein level of pMLC in negative control and CAMSAP2 siRNA‐transfected hRPEs. α‐tubulin is used as loading control
- Top: Images showing collagen gel deformation at 0, 8, and 24 h. HRPEs transfected with negative control, CAMSAP2, and AKAP450 siRNA were seeded in 1% collagen gel (yellow dashed lines). Scale bar: 5 mm. Bottom: Quantification of gel area. All error bars are s.e.m. (n = 3 independent experiments, replicates are biological), ns, not significant, by one‐way ANOVA.
Golgi microtubules regulate focal adhesion dynamics
FAs are well known to play a crucial role in mechanical sensation and cell migration (Plotnikov et al, 2012; Swaminathan & Waterman, 2016). Targeting of microtubules to FAs was shown to trigger FA disassembly and contribute to its turnover (Kaverina et al, 1999; Ezratty et al, 2005). We thus asked whether the Golgi microtubules regulate FA dynamics in a specific way to influence cellular directionality in response to a stiffness gradient. Live‐cell imaging of the FA protein paxillin was acquired and subsequently analyzed by the Focal Adhesion Analysis Server (FAAS) (Wu et al, 2012; Berginski & Gomez, 2013) to reveal FA dynamics under different microtubule perturbations. Disruption of microtubule polymerization by nocodazole significantly increased FA size (Fig 4A). Interestingly, upon removal of the Golgi microtubules, we also found marked increase in FA area, and meanwhile, both FA assembly and disassembly rates significantly dropped (Fig 4B), which reflected changes in adhesion turnover. One likely explanation is that loss of the Golgi microtubules disturbs the turnover of focal adhesions, thus leading to more adhesions with larger size. To test this, we simultaneously labeled both EB1 and paxillin to reveal microtubule plus ends and the FAs at the same time. We developed an automatic pipe line to unbiasedly extract both the EB1 position and the FA location from live‐cell images (Fig 4C). We then identified and quantified events where EB1 signal overlapped with paxillin intensity (Fig 4C). The ratio of the overlapping events to the total of EB1 comet number was defined as the “FA‐MT contacts ratio”. In line with the hypothesis that Golgi microtubules play important roles in FA dynamics, the FA‐MT contacts ratio reduced dramatically when Golgi microtubules were abolished (Fig 4D).
Figure 4. Golgi microtubules regulate focal adhesion dynamics.
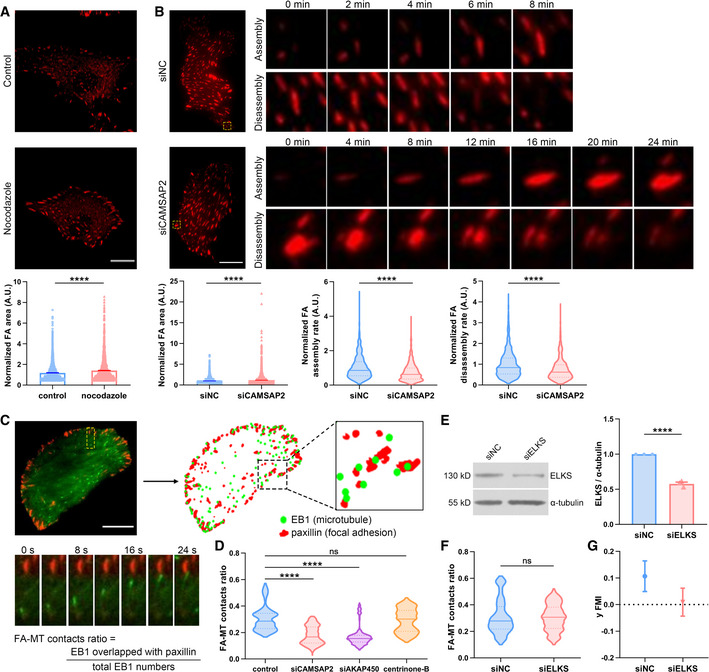
- Top: Representative live‐cell fluorescence imaging of RFP‐paxillin in control and nocodazole (8 μM, 30 min)‐treated hRPEs. Scale bar: 20 μm. Bottom: Quantification of FA area obtained by FAAS. All error bars are s.e.m. N = 10 cells, replicates are biological, ****P < 0.0001, by non‐parametric test.
- Top: Representative live‐cell fluorescence imaging of RFP‐paxillin in negative control and CAMSAP2 siRNA‐transfected hRPEs. Time‐lapse fluorescence imaging zoomed from the yellow box showed the assembly and disassembly stage of a single FA. Scale bar: 20 μm. Bottom: Quantification of FA area, assembly rate, and disassembly rate obtained by FAAS. All error bars are s.e.m. Violin plot center lines denote the median, and dashed lines represent the 25th and 75th percentiles. N = 10 cells, replicates are biological, ****P < 0.0001, by non‐parametric test.
- Top: Schematic diagram of FA‐MT contact analysis. Position of EB1 and paxillin were extracted from live‐cell images, followed by automated co‐localization identification. Scale bar: 20 μm. Bottom: Representative time‐lapse fluorescence imaging of EGFP‐EB1 and RFP‐paxillin zoomed from the yellow box above showed the targeting of MT to FA. FA‐MT contact ratio was calculated by the ratio of co‐localization events to the total EB1 number.
- FA‐MT contact ratio of negative control, CAMSAP2, AKAP450 siRNA‐transfected, and centrinone‐B (500 nM, 7 days)‐treated hRPEs. Violin plot center lines denote the median, and dashed lines represent the 25th and 75th percentiles. N = 10 cells, replicates are biological, ns, not significant, ****P < 0.0001, by non‐parametric test.
- Western blot showing the protein level of ELKS in negative control and ELKS siRNA‐transfected hRPEs. α‐tubulin was used as loading control. Bar chart shows quantification of protein levels normalized to α‐tubulin in each condition. All error bars are s.e.m. (n = 3 independent experiments, replicates are biological), ****P < 0.0001, by Student's t‐test.
- FA‐MT contact ratio of negative control and ELKS siRNA‐transfected hRPEs. Violin plot center lines denote the median, and dashed lines represent the 25th and 75th percentiles. N = 10 cells, replicates are biological, ns, not significant, by non‐parametric test.
- Y FMI of negative control and ELKS siRNA‐transfected hRPEs moving on stiffness gradient gels. All error bars are s.e.m. (n = 50 cells, replicates are biological).
To further investigate potential post‐Golgi trafficking toward the microtubule/FA contacts in regulating FA dynamics and durotaxis, we silenced ELKS, which is a Rab6 effector and was shown to be involved in regulating several trafficking pathways (Monier et al, 2002; Grigoriev et al, 2007). Knocking down ELKS did not change FA‐MT contact ratio, but significantly hampered durotactic migration in cells (Fig 4E–G). These results combined with our other data suggest a role of post‐Golgi trafficking—possibly through the Golgi microtubules—in durotaxis.
The Golgi apparatus is oriented in response to mechanical cues to maintain cell polarity
The positioning of the Golgi apparatus relative to that of the nucleus has been recognized to associate with the direction of collectively migrating cells (Gomes et al, 2005), while it is evident that the Golgi–nucleus axis is decoupled with cell directionality in random motility (Uetrecht & Bear, 2009). Moreover, our recent opto‐genetic manipulation reveals that turning of the Golgi apparatus lags behind cell steering in single cell migration (Hao et al, 2020). Consistent with the early notion, we observed the front positioning of the Golgi in wound healing assays, where we defined the Golgi–nucleus orientation as the angle between the Golgi–nucleus axis with the wound edge (Fig 5A). While in freely moving single cells, there is little coherence between the migration direction and the Golgi–nucleus axis (Uetrecht & Bear, 2009), we noticed that in single cell durotaxis, the Golgi was mostly oriented upwards the stiff side (Fig 5B). When we analyzed and plotted the Golgi positioning from multiple cells, we found that the Golgi–nucleus orientation up gradient (in the 45–135 degree range) was two folds as that down gradient (in the −45 to −135 degree range) (Fig 5B). It is clear that the durotactic cells tend to favor an “upward” localization of the Golgi apparatus.
Figure 5. The Golgi apparatus is oriented in response to mechanical cues to maintain cell polarity.
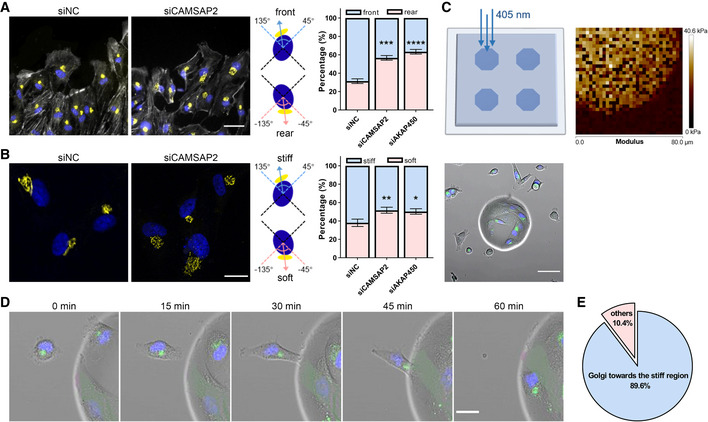
- Left: Representative immunofluorescent staining of GM130 (yellow), F‐actin (gray) and DAPI (blue) in negative control and CAMSAP2 siRNA‐transfected hRPEs at the edge of the wound after 8 h. Scale bar: 50 μm. Middle: Schematic diagram of Golgi–nucleus orientation toward the front (45°–135°) or the rear (−45° to −135°). Right: Quantification of the percentage of Golgi–nucleus orientation toward the front or rear of the cell. All error bars are s.e.m. (n = 100 cells, replicates are biological), ***P < 0.001, ****P < 0.001, by Student's t‐test.
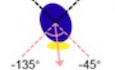
- Left: Representative immunofluorescent staining of GM130 (yellow) and DAPI (blue) in negative control and CAMSAP2 siRNA‐transfected hRPEs on the stiffness gradient gel. Scale bar: 20 μm. Middle: Schematic diagram of Golgi–nucleus orientation toward the stiff side (45°–135°) or the soft side (−45° to −135°). Right: Quantification of the percentage of Golgi–nucleus orientation toward the stiff or soft side. All error bars are s.e.m. (n = 100 cells, replicates are biological), *P < 0.05, **P < 0.01, by Student's t‐test.
- Top left: Schematic diagram of manufacturing polyacrylamide gels with islands of higher stiffness by 405 nm laser irradiation. Top right: Modulus of polyacrylamide gels with stiff islands measured by atomic force microscope. Bottom: Representative live‐cell fluorescence imaging of cells marked with the Golgi (green) and nucleus (blue) on the soft region and the stiff island. Scale bar: 50 μm.
- Representative time‐lapse fluorescence images showing the migration of hRPE cell to the stiff island and the reorientation of Golgi in this process. Scale bar: 20 μm.
- Quantification of the percentage of cells having a stiff‐end biased Golgi positioning. N = 29 cells, replicates are biological.
Golgi has recently been suggested to be mechanically sensitive (Ng et al, 2012; Romani et al, 2019). We then wondered whether the changes in substrate stiffness would be sensed by the Golgi–nucleus axis. To test this, we designed a system where islands of higher stiffness were patterned within RGD peptide coated polyacrylamide gels (Fig 5C). In this system, 10 times higher stiffness was observed in the central islands compared to the surrounding soft area (30 kPa vs. 3 kPa, see Figs 5C and EV4A). Random cell migration on the soft regions of the substrate was imaged, and the events where cells encountering the stiff region were captured. During random migration, cells lacked the coherence between Golgi orientation and cell directionality. However, when a cell was landing onto a stiff island, we detected the steering of the Golgi–nucleus axis toward the stiff side (Fig 5D and E). We have also excluded a potential geometric cue in driving this biased migration by generating a uniform stiffness gel with only the height difference (Fig EV4B–D). Taken together, these data indicate that Golgi orientation is responsive to mechanical cues.
Discussion
In summary, we unveil the critical role of Golgi microtubules in regulating durotactic migration of single cells. Our work demonstrates an intriguing interplay between the Golgi and its associated microtubules with cellular mechano‐sensation and cell migration, and brings out intriguing subjects worthy of future investigations (Fig 6).
Figure 6. Schematic diagram of Golgi microtubules regulating single cell durotaxis.
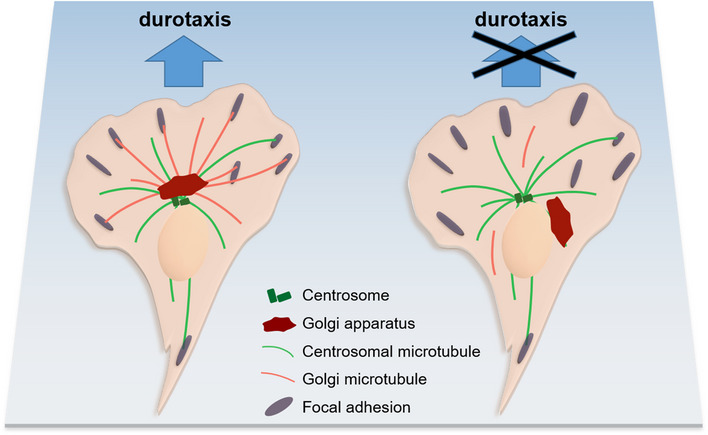
For durotactic cells on stiffness gradient gel, the Golgi–nucleus axis determines the distribution of Golgi microtubules, which then regulates FA turnover in response to stiffness gradient. Once the Golgi microtubules were disrupted, cells with unpolarized Golgi and enlarged FAs were unable to migrate upwards the stiffness gradient.
The Golgi–nucleus axis during cell migration
It has long been controversial whether the Golgi–nucleus orientation dictates cell direction (Ridley et al, 2003; Uetrecht & Bear, 2009; Fife et al, 2014; Hohmann & Dehghani, 2019), and what is the mechanism underlying polarized Golgi positioning. In this study, we observed the front positioned Golgi in leading cells in a cell sheet during wound healing (Fig 5A), in which the edge cells are surrounded by back and side neighboring cells, with the only free space facing the wound region. The protrusion and migration of edge cells would generate force to lead the whole sheet of cells, and meanwhile, the surrounding neighbors may exert pushing force that restrain the edge cells. Interestingly, when single cells were plated on elastic surfaces with stiffness gradient, they exhibited coordinated Golgi–nucleus orientation with migrating direction to the stiff end (Fig 5B). Therefore, the front positioned Golgi is prominent only in edge cells during wound healing or in durotactic single cells. The former is a mode of collective migration, while the latter describes a specialized form of single cell motility. One common feature between these two scenarios is mechanical cues. In both conditions where the Golgi–nucleus axis correlates with migration direction, cells are influenced by environmental mechanical force either from the surrounding cells or from an in homogenously stiffened substrate, supporting the notion that certain mechanical cue is required to ensure Golgi positioning during migration (Wilson et al, 2013).
Having considered this, it may be explainable why durotactic migration of single cells reveals distinct Golgi orientation from random migration of individual cells, but shares similar Golgi positioning with edge cells during collective wound healing. In both conditions where the Golgi–nucleus axis correlates with migration direction, cells are influenced by environmental mechanical force either from the surrounding cells or from an in homogenously stiffened substrate, supporting the notion that certain mechanical cue is required to ensure Golgi positioning during migration.
Golgi as a mechano‐sensing organelle
Having observed the Golgi–nucleus orientation in mechanical constricted cell migration, it is intriguing to ask whether the Golgi and the nucleus could sense force, and if so, how this mechano‐communication with extracellular environment is achieved. The nucleus, being the stiffest organelle inside the cell, has been suggested to play multifaceted roles in mechano‐transduction (Graham & Burridge, 2016). Cellular contraction transmitted through the actomyosin network can signal to the nucleus through the LINC complex residing at the nuclear membrane (Chang et al, 2015). Substrate stiffness has recently been reported to alter nuclear flattening and change nuclear pore size (Elosegui‐Artola et al, 2017). In ameboid migration, the nucleus serves as a headquarter for cells to make pathfinding decisions, that cells would choose the rout with least resistance (Manley et al, 2018; Renkawitz et al, 2019). In contrast, evidence has been scarce with the Golgi being mechanosensitive until recently (Guet et al, 2014). Romani et al (2019) utilized optical tweezer to measure the rheology of the Golgi in cells on elastic substrates with different stiffness. They revealed that the Golgi stiffens in response to force changing. In our experiment, the Golgi steered toward the stiff end when a cell encountered the boundary of the stiff and soft substrates. In a way, this also supports the idea that the Golgi apparatus may be force sensitive.
Differential roles and cooperative efforts of actin and microtubules in directional migration
Crosstalks between the microtubule and actin cytoskeletons are essential for cortical symmetry and cell polarization during cell shape change, cell division, and migration (Dogterom & Koenderink, 2019). Structural and regulatory interaction has been proposed to mediate the crosstalk between these two cytoskeletons (Suozzi et al, 2012; Applewhite et al, 2013; Shi et al, 2019). One example of cytoskeletal crosstalk in cell migration is the guidance of microtubule growth by actin filaments which results in the redirection of microtubule growth along actin bundles (Preciado Lopez et al, 2014). Cell protrusion also requires microtubule‐dependent membrane trafficking through the delivery of specific membrane proteins (Etienne‐Manneville, 2013). It has been suggested that certain tumor cells exhibit durotactic migration as individual cell and this directional migration is under the control by the Arp2/3‐branched actin (DuChez et al, 2019). In our experiments, inhibiting the Arp2/3 did not hamper durotaxis as drastically as depleting the Golgi microtubules in cells. One explanation may be that certain cancer cells with altered nuclear morphology, as has been suggested with cancer cells, are more dependent on the branched actin in sensing and responding to extracellular mechanical cues. An alternative explanation could be that different cytoskeletal networks are sensitive to and responsive for different ranges of stiffness gradient.
Golgi microtubules in regulating focal adhesions
Microtubules have been reported to touch the vicinity of focal adhesion sites and trigger their disassembly or turnover (Bershadsky et al, 1996; Krylyshkina et al, 2003; Wu et al, 2008; Yue et al, 2014). Disruption of microtubule polymerization can induce enlargement of focal adhesions, which involves kinesin‐1, FAK and the endocytic machinery (Krylyshkina et al, 2002; Ezratty et al, 2005). Exocytic vesicles transport of MMP and RAB6‐associated post‐Golgi secretion would be the possible pathways for this regulation (Stehbens et al, 2014; Fourriere et al, 2019). At the vicinity of focal adhesion sites, talin‐KANK1 interaction directs cortical microtubule stabilization complexes (CMSCs) assembly and organization, followed by clustering of microtubule plus‐end tracking proteins (+TIPs), leading to microtubule stabilization in cell periphery (Bouchet et al, 2016). After specific depletion of the Golgi microtubules, we observed increase in area and decreases in assembly or disassembly rate of FAs, along with a decrease in MT‐FA contact frequency. These data suggest that Golgi microtubules might be the principle population of microtubules contacting the focal adhesions. This Golgi microtubule‐focal adhesion regulation may then lead to establishment and sustaining of cell polarization on a stiffness gradient gel. It remains to be investigated how Golgi microtubules interact more with focal adhesions.
Taken together, our results reveal the cytoskeletal mechanism responsible for single cell durotaxis—the Golgi microtubules interact with and modulate the dynamics of specific FAs, possibly under the control of polarized Golgi positioning in response to force.
Materials and Methods
Antibodies and reagents
The following antibodies were used in this study: anti‐GAPDH (ab181602) from Abcam; anti‐AKAP450 (611518) and anti‐GM130 (610822) from BD Biosciences; anti‐phospho‐myosin light chain 2 (3674S) from Cell Signaling Technology; anti‐RhoA (ARH04) from Cytoskeleton; anti‐CAMSAP2 (17880‐1‐AP) from Proteintech; anti‐α‐tubulin (T9026); anti‐γ‐tubulin (T3320); anti‐acetylated‐α‐tubulin (T7451) and anti‐detyrosinated‐α‐tubulin (AB3201) from Sigma‐Aldrich; anti‐ELKS (A9509) from Abclone; anti‐CAMSAP3 generously gifted from Wenxiang Meng Lab (Institute of Genetics and Developmental Biology, Chinese Academy of Sciences, Beijing, China); anti‐mouse (sc‐2005) and anti‐rabbit (sc‐2004) horseradish peroxidase‐conjugated secondary antibodies from Santa Cruz Biotechnology; and Acti‐stain 670 phalloidin from Cytoskeleton.
The following reagents were used in this study: nocodazole (M1404) from Sigma‐Aldrich; centrinone‐B (HY‐18683) from MedChem Express; and CK‐666(182515) from EMD Millipore.
Cell lines and cell culture
Human embryonic kidney 293T (HEK 293T) cells were kept by our laboratory. The human retinal pigment epithelium (HRPE) cells were generously provided by Prof. Yujie Sun (Peking University, Beijing, China).
Cells were maintained in Dulbecco’s modified Eagle medium (DMEM; Corning, 10‐013‐CRVC) for HEK 293T or DMEM/Ham's F‐12 (Invitrogen, 11320033) for HRPE supplemented with 10% fetal bovine serum (FBS; PAN‐Biotech, P30‐3302), 100 U/ml penicillin, and 100 μg/ml streptomycin at 37°C with 5% CO2. For cell passage, cells were washed with PBS (Macgene, CC010) and digested with trypsin (Macgene, CC012).
The CK‐666 was used at the concentration of 100 μM for 3 h. Nocodazole was used at the concentration of 8 μM for 10 min. Centrinone‐B was used at the concentration of 500 nM for 7 days.
Plasmids and siRNA
EB1‐2xEGFP, GFP‐AHAP, and GalT‐EGFP were obtained from Addgene. RFP‐paxillin was generously provided by the James E. Bear laboratory. Both were subcloned into lentiviral vector (Plvx‐AcGFP‐N1) for establishing stable cell lines.
The following siRNAs purchased from Sangon Biotech were used in this study:
CAMSAP2‐1#, 5′‐UCUCGAAUCUGUUUCUGUGGAGAGG‐3′
CAMSAP2‐2#, 5′‐GAATACTTCTTGACGAGTT‐3′
CAMSAP2‐3#, 5′‐GTACTGGATAAATAAGGTA‐3′
AKAP450, 5′‐AUAUGAACACAGCUUAUGA‐3′
ELKS, 5′‐GUGGGAAAACCCUUUCAAU‐3′
Negative control, 5′‐UUCUCCGAACGUGUCACGUTT‐3′
siRNA transfections were done with Lipofectamine RNAi‐MAX (Thermo Fisher Scientific, 13778‐150) according to the manufacturer's instructions.
Polyacrylamide gel
Polyacrylamide gels with uniform stiffness were generated as described before. A 50 μl drop of an acrylamide mix (12.5 μl 40% acrylamide, 12.5 μl 2% bis‐acrylamide, 17.5 μl 10 mM HEPES with 5 μl 10% AP and 2.5 μl TEMED) was applied to glutaraldehyde‐modified 24 mm glass coverslip, covered with a glass coverslip made hydrophobic by treatment with Repel‐Silane. After gel photopolymerization, the hydrophobic glass coverslip was removed and the gel was washed with PBS thoroughly to remove unreacted reagents. The stiffness was measured with AFM.
To generate polyacrylamide gels with different height, a 20 μl drop of an acrylamide mix as above was applied to half of a glutaraldehyde‐modified 24 mm glass coverslip, covered with a glass coverslip made hydrophobic by treatment with Repel‐Silane. After gel photopolymerization, additional 30 μl drop of an acrylamide mix was applied to the other half of the glutaraldehyde‐modified 24 mm glass coverslip and covered with a hydrophobic glass coverslip until gel photopolymerization.
Polyacrylamide gels with a stiffness gradient were generated as described before. A 65 μl drop of an acrylamide mix (19 μl 40% acrylamide, 19 μl 2% bis‐acrylamide, 27 μl 10 mM HEPES with 2 mg/ml Irgacure 2959, Sigma‐Aldrich, 410896) was applied to glutaraldehyde‐modified 24 mm glass coverslip, covered with a glass coverslip made hydrophobic by treatment with Repel‐Silane. Gradients were generated by initially covering the acrylamide mix solution with an opaque mask and then slowly sliding it at a controlled speed while irradiating with a UV bench lamp. The mask was slid using an automatic syringe pump machine (Chemyx Fusion 200). To ensure complete polymerization, the whole acrylamide mix solution was first exposed to the UV light for 10 min without covering (for the initial nucleation in the polymerization reaction), and then mask was slid at 40 μm/s for 10 min to produce the steep stiffness gradient gels. After gel photopolymerization, the hydrophobic glass coverslip was removed and the gel was washed with PBS thoroughly to remove unreacted reagents. The stiffness was measured with AFM.
To promote cell adhesion, fibronectin was covalently linked to the gradient gels. Gels were first immersed into soak solution (137 mM NaCl, 5% (v/v) glycerol) at RT for at least 1 h and then incubated in a solution of EDC (15 mM) and NHS (25 mM) in a MES buffer (0.1 M, 5% (v/v) glycerol) at RT for 30 min in the dark. Subsequently, gels were incubated with 10 μg/ml fibronectin for 35 min at RT. After washing three more times with PBS, gels were stored at 4°C for up to 2 weeks.
For labeling fibronectin, fibronectin was dissolved at 1 mg/ml (3.8 μM) in H2O at 37°C for 30 min. Incubated 100 μl fibronectin stock solution (3.8 μM), 8 μl Dye‐NHS (1,000 μM) and 20 μl NaHCO3 (1 M) with 72 μl fibronectin buffer (50 mM Tris, pH 7.5) before gel filtration. Then allowed the reaction to proceed for 30 min at RT on a shaking platform and protected from light. During the reaction, equilibrated NAP‐5 gel filtration columns, one per labeling reaction, by running three column volumes (750 μl) of PBS. Added the entire volume to the center of the column and allowed the sample to enter the column. After the last drip, added 550 μl PBS to wash. Finally added 300 μl PBS and collected the eluent into a 1.5 ml Eppendorf tube and measured absorbance of labeled fibronectin on Nano drop.
Polyacrylamide gels with stiff island
To generate polyacrylamide gels with stiff island, we used photoinitiator LAP (lithium phenyl‐2, 4, 6‐trimethylbenzoyl phosphinate) which can be motivated by 405 nm laser channel of TIRF microscope. The hydrogel was produced with 100 μl system solution, 30 μl bis‐acrylamide was coupled with 10 μl 1 mM RGD and 25 μl PBS, then incubated for 3–5 h at 37°C incubator. Following, 30 μl 40% acrylamide and 5 μl 100 mM LAP were added to the system, the 100 μl drop of acrylamide mix was applied to a silanized 35 mm glass bottom. The solution was covered with a glass coverslip made hydrophobic by treatment with Repel‐Silane. Stiff islands were generated by TIRF microscope, array selection point was irradiating with 5% 405 nm laser channel for 6 s, and then the whole solution was exposed to a UV lamp of 365 nm for 12 s for complete polymerization. Ultimately, the polyacrylamide gels were dipped in PBS for 1 h so as to cell culture.
Scratch assay
Plated cells at 100% confluency. Scraped the cell monolayer in a straight line to create a “scratch” with a p200 pipet tip. Removed the debris and smooth the edge of the scratch by washing the cells once with PBS, then replaced with new medium and cultured for 8 h.
Western blotting
For Western blotting, cells were washed with DPBS once and lysed in an appropriate volume of RIPA buffer (50 mM Tris–HCl, pH 8.0, 150 mM NaCl, 1% Triton X‐100, 0.5% Na‐deoxycholate, 0.1% SDS, 1 mM EDTA and protease inhibitor cocktail) for 15 min on ice. Lysates were centrifuged at 15,000 g for 10 min, and the supernatants were collected. Then, 5 × SDS loading buffer was added to the supernatants and boiled for 10 min at 95°C. To obtain active RhoA, Rhotekin‐RBD Protein GST Beads (Cytoskeleton, TR02) were used according to the manufacturer's instructions. Protein samples were run on 10% SDS–PAGE acrylamide gels and transferred onto PVDF membranes by wet electrophoretic transfer, followed by first and second antibody incubation at 4°C overnight or at room temperature for 2 h. The X‐ray film was used to detect and record the band intensities. The fixed X‐ray film was scanned, and digital images were obtained. The band intensity was quantified by “gel analysis” plugin of ImageJ.
Immunofluorescence staining
Cells were plated on acid‐washed coverslips coated with 10 μg/ml fibronectin overnight. Cells were then fixed with 4% paraformaldehyde at RT for 15 min or with methanol at −20°C for 20 min, permeabilized with 0.5% Triton X‐100 in PBS for 5 min, washed with PBS once for 5 min, and sequentially blocked with 10% bovine serum albumin (BSA) for 1 h at RT. Then, the primary antibody was appropriately diluted in PBS and incubated for 1 h at RT. After washed with PBS three times, the coverslips were incubated with Alexa Fluor 488‐ or Alexa Fluor 555‐conjugated secondary antibody (Thermo Fisher Scientific) for 1 h at RT. After another washed in PBS three times, the coverslips were mounted with Prolong Diamond Antifade with DAPI. After mounting medium is solidified, images were captured using Andor Dragonfly confocal imaging system.
Image acquisition and analysis
For long‐term live‐cell imaging, cells were plated on PA gel or glass‐bottom cell culture dishes and maintained in CO2‐independent DMEM (Gibco, 18045‐088) supplemented with 10% FBS, 100 U/ml penicillin, and 100 μg/ml streptomycin at 37°C throughout the imaging process.
Bright‐field images for migration analysis were acquired with a 10× objective lens on Olympus IX83. Acquisitions were performed at 15 min interval during 10–20 h. Images were analyzed using “manual tracking” and “chemotaxis tool” plugin of ImageJ.
Live fluorescence imaging of Golgi orientation was taken every 15 min for 16 h with a 40× objective lens on a confocal imaging system.
Live fluorescence imaging of EB1 was acquired with a 63 × 1.4 NA objective lens on Dragonfly confocal imaging system at 2‐s interval during 2 min, and the growth speed was analyzed by plusTipTracker (Applegate et al, 2011).
Live‐cell TIRF imaging was performed on Olympus cell TIRF with a 60× objective lens. For focal adhesion dynamics analysis, images were taken every 2 min for 2 h and then processed for estimation of various parameters using Focal Adhesion Analysis Server (FAAS) (http://faas.bme.unc.edu). For FA‐MT contact analysis, images were taken every 2 s for 2 min. The EB1 position and the FA location from live‐cell images were extracted by plusTipTracker and FAAS, respectively. Events where EB1 signal overlapped with paxillin intensity were identified and quantified. The ratio of the overlapping events to the total of EB1 comet number was defined as the “FA‐MT contacts ratio”.
Fluorescence imaging of fixed samples was captured using Dragonfly confocal imaging system.
Statistical analysis
Normality of data distribution was tested using the Shapiro–Wilk test. Statistical differences between two groups of data were analyzed with a two‐tailed unpaired Student’s t‐test or non‐parametric test with GraphPad Prism 8.0. Graphical data are represented as a mean with data bars representing s.e.m. For violin plot, the box contains the entire population, with a marker for the median of the data and a marker indicating the interquartile range. Statistical significance was described in *P < 0.05, **P < 0.01, ***P < 0.001, ****P < 0.001, ns, no significant difference. Normalization was done by dividing each value in the experimental group by the mean value of the control group.
Author contributions
CW and YR conceived the project and designed the experiments. YR and WY performed the experiments and data analysis. SL and BL designed the MT‐FA contact ratio analysis. WW and ZL manufactured the high stiffness island system. PS, YH, and HH assisted with Western blot and data analysis. CW, YR, YS, and WY wrote the manuscript. All authors participated in discussion and editing of the manuscript.
Conflict of interest
The authors declare that they have no conflict of interest.
Supporting information
Expanded View Figures PDF
Movie EV1
Movie EV2
Movie EV3
Movie EV4
Movie EV5
Movie EV6
Review Process File
Acknowledgements
We thank Prof. Wenxiang Meng (Chinese Academy of Sciences) for the CAMSAP3 antibody. We thank Prof. Huaqing Cai (Institute of Biophysics of Chinese Academy of Sciences) and Prof. Xin Liang (Tsinghua University) for helpful discussion. We thank Xinmin Xu and Yuan Wang (Peking University Health Science Center) for technical support and data discussion. This work was supported by funding from the National Key R&D Program of China 2017YFA0506500 and the National Natural Science Foundation of China 81672457 for C.W.; and National Natural Science Foundation of China 21775115 for Z.L.
EMBO Reports (2021) 22: e51094
Data availability
The authors declare that no data were deposited in a public database.
References
- Akhmanova A, Hoogenraad Casper C (2015) Microtubule minus‐end‐targeting proteins. Curr Biol 25: R162–R171 [DOI] [PubMed] [Google Scholar]
- Applegate, KT , Besson, S , Matov, A , Bagonis, MH , Jaqaman, K , Danuser, G (2011) plusTipTracker: quantitative image analysis software for the measurement of microtubule dynamics. J Struct Biol 176: 168–184 [DOI] [PMC free article] [PubMed] [Google Scholar]
- Applewhite DA, Grode KD, Duncan MC, Rogers SL (2013) The actin‐microtubule cross‐linking activity of Drosophila Short stop is regulated by intramolecular inhibition. Mol Biol Cell 24: 2885–2893 [DOI] [PMC free article] [PubMed] [Google Scholar]
- Asokan Sreeja B, Johnson Heath E, Rahman A, King Samantha J, Rotty Jeremy D, Lebedeva Irina P, Haugh Jason M, Bear James E (2014) Mesenchymal chemotaxis requires selective inactivation of myosin II at the leading edge via a noncanonical PLCγ/PKCα pathway. Dev Cell 31: 747–760 [DOI] [PMC free article] [PubMed] [Google Scholar]
- Berginski ME, Gomez SM (2013) The Focal Adhesion Analysis Server: a web tool for analyzing focal adhesion dynamics. F1000Res 2: 68 [DOI] [PMC free article] [PubMed] [Google Scholar]
- Bershadsky A, Chausovsky A, Becker E, Lyubimova A, Geiger B (1996) Involvement of microtubules in the control of adhesion‐dependent signal transduction. Curr Biol 6: 1279–1289 [DOI] [PubMed] [Google Scholar]
- Bouchet BP, Gough RE, Ammon YC, van de Willige D, Post H, Jacquemet G, Altelaar AM, Heck AJ, Goult BT, Akhmanova A (2016) Talin‐KANK1 interaction controls the recruitment of cortical microtubule stabilizing complexes to focal adhesions. Elife 5: e18124 [DOI] [PMC free article] [PubMed] [Google Scholar]
- Bravo‐Cordero JJ, Hodgson L, Condeelis J (2012) Directed cell invasion and migration during metastasis. Curr Opin Cell Biol 24: 277–283 [DOI] [PMC free article] [PubMed] [Google Scholar]
- Chang YC, Nalbant P, Birkenfeld J, Chang ZF, Bokoch GM (2008) GEF‐H1 couples nocodazole‐induced microtubule disassembly to cell contractility via RhoA. Mol Biol Cell 19: 2147–2153 [DOI] [PMC free article] [PubMed] [Google Scholar]
- Chang W, Worman HJ, Gundersen GG (2015) Accessorizing and anchoring the LINC complex for multifunctionality. J Cell Biol 208: 11–22 [DOI] [PMC free article] [PubMed] [Google Scholar]
- Choi YS, Vincent LG, Lee AR, Kretchmer KC, Chirasatitsin S, Dobke MK, Engler AJ (2012) The alignment and fusion assembly of adipose‐derived stem cells on mechanically patterned matrices. Biomaterials 33: 6943–6951 [DOI] [PMC free article] [PubMed] [Google Scholar]
- Dogterom M, Kerssemakers JWJ, Romet‐Lemonne G, Janson ME (2005) Force generation by dynamic microtubules. Curr Opin Cell Biol 17: 67–74 [DOI] [PubMed] [Google Scholar]
- Dogterom M, Koenderink GH (2019) Actin‐microtubule crosstalk in cell biology. Nat Rev Mol Cell Biol 20: 38–54 [DOI] [PubMed] [Google Scholar]
- DuChez BJ, Doyle AD, Dimitriadis EK, Yamada KM (2019) Durotaxis by human cancer cells. Biophys J 116: 670–683 [DOI] [PMC free article] [PubMed] [Google Scholar]
- Efimov A, Kharitonov A, Efimova N, Loncarek J, Miller PM, Andreyeva N, Gleeson P, Galjart N, Maia ARR, McLeod IX et al (2007) Asymmetric CLASP‐dependent nucleation of noncentrosomal microtubules at the trans‐Golgi network. Dev Cell 12: 917–930 [DOI] [PMC free article] [PubMed] [Google Scholar]
- Elosegui‐Artola A, Andreu I, Beedle AEM, Lezamiz A, Uroz M, Kosmalska AJ, Oria R, Kechagia JZ, Rico‐Lastres P, Le Roux AL et al (2017) Force triggers YAP nuclear entry by regulating transport across nuclear pores. Cell 171: 1397–1410 [DOI] [PubMed] [Google Scholar]
- Etienne‐Manneville S (2013) Microtubules in cell migration. Annu Rev Cell Dev Biol 29: 471–499 [DOI] [PubMed] [Google Scholar]
- Ezratty EJ, Partridge MA, Gundersen GG (2005) Microtubule‐induced focal adhesion disassembly is mediated by dynamin and focal adhesion kinase. Nat Cell Biol 7: 581–590 [DOI] [PubMed] [Google Scholar]
- Fife CM, McCarroll JA, Kavallaris M (2014) Movers and shakers: cell cytoskeleton in cancer metastasis. Br J Pharmacol 171: 5507–5523 [DOI] [PMC free article] [PubMed] [Google Scholar]
- Fourriere L, Kasri A, Gareil N, Bardin S, Bousquet H, Pereira D, Perez F, Goud B, Boncompain G, Miserey‐Lenkei S (2019) RAB6 and microtubules restrict protein secretion to focal adhesions. J Cell Biol 218: 2215–2231 [DOI] [PMC free article] [PubMed] [Google Scholar]
- Friedl P, Gilmour D (2009) Collective cell migration in morphogenesis, regeneration and cancer. Nat Rev Mol Cell Biol 10: 445 [DOI] [PubMed] [Google Scholar]
- Gomes ER, Jani S, Gundersen GG (2005) Nuclear movement regulated by Cdc42, MRCK, myosin, and actin flow establishes MTOC polarization in migrating cells. Cell 121: 451–463 [DOI] [PubMed] [Google Scholar]
- Graham DM, Burridge K (2016) Mechanotransduction and nuclear function. Curr Opin Cell Biol 40: 98–105 [DOI] [PMC free article] [PubMed] [Google Scholar]
- Grigoriev I, Splinter D, Keijzer N, Wulf PS, Demmers J, Ohtsuka T, Modesti M, Maly IV, Grosveld F, Hoogenraad CC et al (2007) Rab6 regulates transport and targeting of exocytotic carriers. Dev Cell 13: 305–314 [DOI] [PubMed] [Google Scholar]
- Guet D, Mandal K, Pinot M, Hoffmann J, Abidine Y, Sigaut W, Bardin S, Schauer K, Goud B, Manneville JB (2014) Mechanical role of actin dynamics in the rheology of the Golgi complex and in Golgi‐associated trafficking events. Current biology : CB 24: 1700–1711 [DOI] [PubMed] [Google Scholar]
- Hadden WJ, Young JL, Holle AW, McFetridge ML, Kim DY, Wijesinghe P, Taylor‐Weiner H, Wen JH, Lee AR, Bieback K et al (2017) Stem cell migration and mechanotransduction on linear stiffness gradient hydrogels. Proc Natl Acad Sci USA 114: 5647–5652 [DOI] [PMC free article] [PubMed] [Google Scholar]
- Hao H, Niu J, Xue B, Su QP, Liu M, Yang J, Qin J, Zhao S, Wu C, Sun Y (2020) Golgi‐associated microtubules are fast cargo tracks and required for persistent cell migration. EMBO Rep 21: e48385 [DOI] [PMC free article] [PubMed] [Google Scholar]
- Hartman CD, Isenberg BC, Chua SG, Wong JY (2016) Vascular smooth muscle cell durotaxis depends on extracellular matrix composition. Proc Natl Acad Sci USA 113: 11190–11195 [DOI] [PMC free article] [PubMed] [Google Scholar]
- Hohmann T, Dehghani F (2019) The Cytoskeleton‐A complex interacting meshwork. Cells 8: 362 [DOI] [PMC free article] [PubMed] [Google Scholar]
- Isenberg BC, Dimilla PA, Walker M, Kim S, Wong JY (2009) Vascular smooth muscle cell durotaxis depends on substrate stiffness gradient strength. Biophys J 97: 1313–1322 [DOI] [PMC free article] [PubMed] [Google Scholar]
- Jiang K, Hua S, Mohan R, Grigoriev I, Yau Kah W, Liu Q, Katrukha Eugene A, Altelaar AFM, Heck Albert JR, Hoogenraad Casper C et al (2014) Microtubule minus‐end stabilization by polymerization‐driven CAMSAP deposition. Dev Cell 28: 295–309 [DOI] [PubMed] [Google Scholar]
- Kaverina I, Krylyshkina O, Small JV (1999) Microtubule targeting of substrate contacts promotes their relaxation and dissociation. J Cell Biol 146: 1033–1044 [DOI] [PMC free article] [PubMed] [Google Scholar]
- Kaverina I, Krylyshkina O, Beningo K, Anderson K, Wang YL, Small JV (2002) Tensile stress stimulates microtubule outgrowth in living cells. J Cell Sci 115: 2283–2291 [DOI] [PubMed] [Google Scholar]
- Kim C, Young JL, Holle AW, Jeong K, Major LG, Jeong JH, Aman ZM, Han DW, Hwang Y, Spatz JP et al (2020) Stem cell mechanosensation on Gelatin Methacryloyl (GelMA) stiffness gradient hydrogels. Ann Biomed Eng 48: 893–902 [DOI] [PubMed] [Google Scholar]
- Krendel M, Zenke FT, Bokoch GM (2002) Nucleotide exchange factor GEF‐H1 mediates cross‐talk between microtubules and the actin cytoskeleton. Nat Cell Biol 4: 294–301 [DOI] [PubMed] [Google Scholar]
- Krylyshkina O, Kaverina I, Kranewitter W, Steffen W, Alonso MC, Cross RA, Small JV (2002) Modulation of substrate adhesion dynamics via microtubule targeting requires kinesin‐1. J Cell Biol 156: 349–359 [DOI] [PMC free article] [PubMed] [Google Scholar]
- Krylyshkina O, Anderson KI, Kaverina I, Upmann I, Manstein DJ, Small JV, Toomre DK (2003) Nanometer targeting of microtubules to focal adhesions. J Cell Biol 161: 853–859 [DOI] [PMC free article] [PubMed] [Google Scholar]
- Lansbergen G, Grigoriev I, Mimori‐Kiyosue Y, Ohtsuka T, Higa S, Kitajima I, Demmers J, Galjart N, Houtsmuller AB, Grosveld F et al (2006) CLASPs attach microtubule plus ends to the cell cortex through a complex with LL5beta. Dev Cell 11: 21–32 [DOI] [PubMed] [Google Scholar]
- Lessey EC, Guilluy C, Burridge K (2012) From mechanical force to RhoA activation. Biochemistry 51: 7420–7432 [DOI] [PMC free article] [PubMed] [Google Scholar]
- Li R, Gundersen GG (2008) Beyond polymer polarity: how the cytoskeleton builds a polarized cell. Nat Rev Mol Cell Biol 9: 860 [DOI] [PubMed] [Google Scholar]
- Lo C‐M, Wang H‐B, Dembo M, Wang Y‐L (2000) Cell movement is guided by the rigidity of the substrate. Biophys J 79: 144–152 [DOI] [PMC free article] [PubMed] [Google Scholar]
- Locascio A, Nieto MA (2001) Cell movements during vertebrate development: integrated tissue behaviour versus individual cell migration. Curr Opin Genet Dev 11: 464–469 [DOI] [PubMed] [Google Scholar]
- Luster AD, Alon R, von Andrian UH (2005) Immune cell migration in inflammation: present and future therapeutic targets. Nat Immunol 6: 1182–1190 [DOI] [PubMed] [Google Scholar]
- Manley HR, Keightley MC, Lieschke GJ (2018) The neutrophil nucleus: an important influence on neutrophil migration and function. Front Immunol 9: 2867 [DOI] [PMC free article] [PubMed] [Google Scholar]
- Martin M, Veloso A, Wu J, Katrukha EA, Akhmanova A (2018) Control of endothelial cell polarity and sprouting angiogenesis by non‐centrosomal microtubules. eLife 7: e33864 [DOI] [PMC free article] [PubMed] [Google Scholar]
- Miller PM, Folkmann AW, Maia AR, Efimova N, Efimov A, Kaverina I (2009) Golgi‐derived CLASP‐dependent microtubules control Golgi organization and polarized trafficking in motile cells. Nat Cell Biol 11: 1069–1080 [DOI] [PMC free article] [PubMed] [Google Scholar]
- Monier S, Jollivet F, Janoueix‐Lerosey I, Johannes L, Goud B (2002) Characterization of novel Rab6‐interacting proteins involved in endosome‐to‐TGN transport. Traffic 3: 289–297 [DOI] [PubMed] [Google Scholar]
- Ng MR, Besser A, Danuser G, Brugge JS (2012) Substrate stiffness regulates cadherin‐dependent collective migration through myosin‐II contractility. J Cell Biol 199: 545–563 [DOI] [PMC free article] [PubMed] [Google Scholar]
- Piekny AJ, Glotzer M (2008) Anillin is a scaffold protein that links RhoA, actin, and myosin during cytokinesis. Curr Biol 18: 30–36 [DOI] [PubMed] [Google Scholar]
- Plotnikov Sergey V, Pasapera Ana M, Sabass B, Waterman Clare M (2012) Force fluctuations within focal adhesions mediate ECM‐rigidity sensing to guide directed cell migration. Cell 151: 1513–1527 [DOI] [PMC free article] [PubMed] [Google Scholar]
- Plotnikov SV, Waterman CM (2013) Guiding cell migration by tugging. Curr Opin Cell Biol 25: 619–626 [DOI] [PMC free article] [PubMed] [Google Scholar]
- Preciado Lopez M, Huber F, Grigoriev I, Steinmetz MO, Akhmanova A, Koenderink GH, Dogterom M (2014) Actin‐microtubule coordination at growing microtubule ends. Nat Commun 5: 4778 [DOI] [PMC free article] [PubMed] [Google Scholar]
- Raab M, Swift J, P. Dingal PCD, Shah P, Shin J‐W, Discher DE (2012) Crawling from soft to stiff matrix polarizes the cytoskeleton and phosphoregulates myosin‐II heavy chain. J Cell Biol 199: 669 [DOI] [PMC free article] [PubMed] [Google Scholar]
- Raab M, Discher DE (2017) Matrix rigidity regulates microtubule network polarization in migration. Cytoskeleton (Hoboken) 74: 114–124 [DOI] [PMC free article] [PubMed] [Google Scholar]
- Renkawitz J, Kopf A, Stopp J, de Vries I, Driscoll MK, Merrin J, Hauschild R, Welf ES, Danuser G, Fiolka R et al (2019) Nuclear positioning facilitates amoeboid migration along the path of least resistance. Nature 568: 546–550 [DOI] [PMC free article] [PubMed] [Google Scholar]
- Ridley AJ, Schwartz MA, Burridge K, Firtel RA, Ginsberg MH, Borisy G, Parsons JT, Horwitz AR (2003) Cell migration: integrating signals from front to back. Science 302: 1704–1709 [DOI] [PubMed] [Google Scholar]
- Rivero S, Cardenas J, Bornens M, Rios RM (2009) Microtubule nucleation at the cis‐side of the Golgi apparatus requires AKAP450 and GM130. EMBO J 28: 1016–1028 [DOI] [PMC free article] [PubMed] [Google Scholar]
- Romani P, Brian I, Santinon G, Pocaterra A, Audano M, Pedretti S, Mathieu S, Forcato M, Bicciato S, Manneville JB et al (2019) Extracellular matrix mechanical cues regulate lipid metabolism through Lipin‐1 and SREBP. Nat Cell Biol 21: 338–347 [DOI] [PubMed] [Google Scholar]
- Salaycik KJ, Fagerstrom CJ, Murthy K, Tulu US, Wadsworth P (2005) Quantification of microtubule nucleation, growth and dynamics in wound‐edge cells. J Cell Sci 118: 4113–4122 [DOI] [PubMed] [Google Scholar]
- Shi P, Wang Y, Huang Y, Zhang C, Li Y, Liu Y, Li T, Wang W, Liang X, Wu C (2019) Arp2/3‐branched actin regulates microtubule acetylation levels and affects mitochondrial distribution. J Cell Sci 132: jcs226506 [DOI] [PubMed] [Google Scholar]
- Singh A, Saha T, Begemann I, Ricker A, Nusse H, Thorn‐Seshold O, Klingauf J, Galic M, Matis M (2018) Polarized microtubule dynamics directs cell mechanics and coordinates forces during epithelial morphogenesis. Nat Cell Biol 20: 1126–1133 [DOI] [PubMed] [Google Scholar]
- Stehbens SJ, Paszek M, Pemble H, Ettinger A, Gierke S, Wittmann T (2014) CLASPs link focal‐adhesion‐associated microtubule capture to localized exocytosis and adhesion site turnover. Nat Cell Biol 16: 561–573 [DOI] [PMC free article] [PubMed] [Google Scholar]
- Sunyer R, Conte V, Escribano J, Elosegui‐Artola A, Labernadie A, Valon L, Navajas D, García‐Aznar JM, Muñoz JJ, Roca‐Cusachs P et al (2016) Collective cell durotaxis emerges from long‐range intercellular force transmission. Science 353: 1157–1161 [DOI] [PubMed] [Google Scholar]
- Suozzi KC, Wu X, Fuchs E (2012) Spectraplakins: master orchestrators of cytoskeletal dynamics. J Cell Biol 197: 465–475 [DOI] [PMC free article] [PubMed] [Google Scholar]
- Swaminathan V, Fischer RS, Waterman CM (2016) The FAK–Arp2/3 interaction promotes leading edge advance and haptosensing by coupling nascent adhesions to lamellipodia actin. Mol Biol Cell 27: 1085–1100 [DOI] [PMC free article] [PubMed] [Google Scholar]
- Swaminathan V, Waterman CM (2016) The molecular clutch model for mechanotransduction evolves. Nat Cell Biol 18: 459 [DOI] [PMC free article] [PubMed] [Google Scholar]
- Uetrecht AC, Bear JE (2009) Golgi polarity does not correlate with speed or persistence of freely migrating fibroblasts. Eur J Cell Biol 88: 711–717 [DOI] [PMC free article] [PubMed] [Google Scholar]
- Vincent LG, Choi YS, Alonso‐Latorre B, del Álamo JC, Engler AJ (2013) Mesenchymal stem cell durotaxis depends on substrate stiffness gradient strength. Biotechnol J 8: 472–484 [DOI] [PMC free article] [PubMed] [Google Scholar]
- Wilson K, Lewalle A, Fritzsche M, Thorogate R, Duke T, Charras G (2013) Mechanisms of leading edge protrusion in interstitial migration. Nat Commun 4: 2896 [DOI] [PMC free article] [PubMed] [Google Scholar]
- Wittmann T, Waterman‐Storer CM (2001) Cell motility: can Rho GTPases and microtubules point the way? J Cell Sci 114: 3795–3803 [DOI] [PubMed] [Google Scholar]
- Wong S, Guo W‐H, Wang Y‐L (2014) Fibroblasts probe substrate rigidity with filopodia extensions before occupying an area. Proc Natl Acad Sci USA 111: 17176–17181 [DOI] [PMC free article] [PubMed] [Google Scholar]
- Wong YL, Anzola JV, Davis RL, Yoon M, Motamedi A, Kroll A, Seo CP, Hsia JE, Kim SK, Mitchell JW et al (2015) Reversible centriole depletion with an inhibitor of Polo‐like kinase 4. Science 348: 1155–1160 [DOI] [PMC free article] [PubMed] [Google Scholar]
- Wormer DB, Davis KA, Henderson JH, Turner CE (2014) The focal adhesion‐localized CdGAP regulates matrix rigidity sensing and durotaxis. PLoS One 9: e91815 [DOI] [PMC free article] [PubMed] [Google Scholar]
- Wu X, Kodama A, Fuchs E (2008) ACF7 regulates cytoskeletal‐focal adhesion dynamics and migration and has ATPase activity. Cell 135: 137–148 [DOI] [PMC free article] [PubMed] [Google Scholar]
- Wu C, Asokan SB, Berginski ME, Haynes EM, Sharpless NE, Griffith JD, Gomez SM, Bear JE (2012) Arp2/3 is critical for lamellipodia and response to extracellular matrix cues but is dispensable for chemotaxis. Cell 148: 973–987 [DOI] [PMC free article] [PubMed] [Google Scholar]
- Wu J, de Heus C, Liu Q, Bouchet BP, Noordstra I, Jiang K, Hua S, Martin M, Yang C, Grigoriev I et al (2016) Molecular pathway of microtubule organization at the Golgi apparatus. Dev Cell 39: 44–60 [DOI] [PubMed] [Google Scholar]
- Wu J, Akhmanova A (2017) Microtubule‐organizing centers. Annu Rev Cell Dev Biol 33: 51–75 [DOI] [PubMed] [Google Scholar]
- Yamaguchi H, Wyckoff J, Condeelis J (2005) Cell migration in tumors. Curr Opin Cell Biol 17: 559–564 [DOI] [PubMed] [Google Scholar]
- Yue J, Xie M, Gou X, Lee P, Schneider MD, Wu X (2014) Microtubules regulate focal adhesion dynamics through MAP4K4. Dev Cell 31: 572–585 [DOI] [PMC free article] [PubMed] [Google Scholar]
- Zhou X, Li J, Kucik DF (2001) The microtubule cytoskeleton participates in control of beta2 integrin avidity. J Biol Chem 276: 44762–44769 [DOI] [PubMed] [Google Scholar]
- Zhu X, Kaverina I (2013) Golgi as an MTOC: making microtubules for its own good. Histochem Cell Biol 140: 361–367 [DOI] [PMC free article] [PubMed] [Google Scholar]
Associated Data
This section collects any data citations, data availability statements, or supplementary materials included in this article.
Supplementary Materials
Expanded View Figures PDF
Movie EV1
Movie EV2
Movie EV3
Movie EV4
Movie EV5
Movie EV6
Review Process File
Data Availability Statement
The authors declare that no data were deposited in a public database.