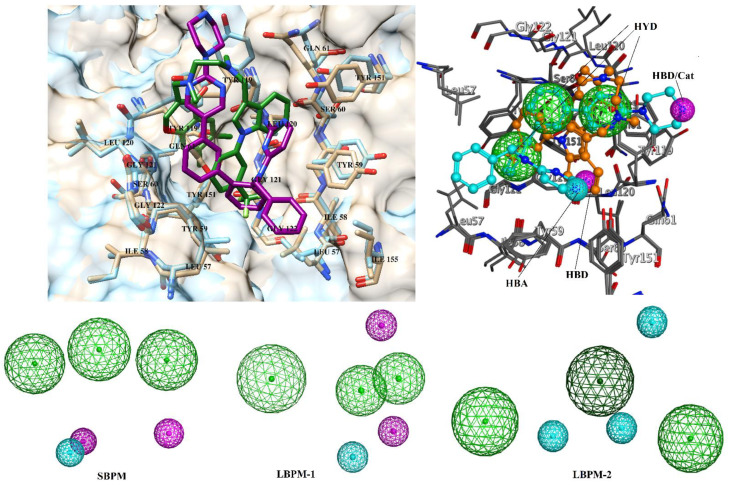
Figure 2.
Superimposed view of 2AZ5 and 5MU8. The ligands are shown in green and magenta sticks. The active site residues are labelled. The structure-based pharmacophore model (SBPM) and ligand-based pharmacophore models (LBPM1 and LBPM2) are shown. Hydrophobic feature (HYD), hydrogen bond donor (HBD) and hydrogen bond acceptors (HBA) are shown in green, magenta and cyan spheres, respectively.

