Abstract
Disruption of the normal splicing patterns of RNA is a major factor in the path o genesis of a number of diseases. Increasingl y research has shown the strong influence that splicing patterns can have on cancer progression. Multiple myeloma is a molecularly heterogeneous disease classified by the presence of key translocations, gene expression profiles and mutations but the splicing patterns in MM remains largely unexplored. We take a multifaceted approach to define the extent and impact of alternative splicing in MM. We looked at the spliceosome component, SF3B1, with hotspot mutations (K700E and K666T/Q) shown to result in an increase in alternative splicing in other cancers. We discovered a number of differentially spliced genes in comparison of the SF3B1 mutant and wild type samples that included, MZB1, DYNLL1, TMEM14C and splicing related genes DHX9, CLASRP, and SNRPE. We identified a broader role for abnormal splicing showing clear differences in the extent of novel splice variants in the different translocation groups. We show that a high number of novel splice loci is associated with adverse survival and an ultra-high risk group. The enumeration of patterns of alternative splicing has the potential to refine MM classification and to aid in the risk stratification of patients.
Introduction
Multiple myeloma (MM) is a plasma cell disorder and is the second most common hematological malignancy diagnosed in the United States. MM is characterized by primary etiologic events involving the gain of odd numbered chromosomes seen in 50% of patients and structural variants involving rearrangement to the immunoglobulin loci. These structural variants result in the relocation of a super-enhancer in proximity to an oncogene, resulting in its over-expression. These events subdivide non-hyperdiploid MM into 5 main groups: t(4;14) (12%), t(6;14) (1%), t(11;14) (15%), t(14;16) (3%) and t(14;20) (2%).1,2 Despite extensive work to characterize the myeloma genome, sequencing studies have only identified 63 key driver genes.1 The median number of driver events per sample is five, but in a subset of samples none are detectable suggesting that we are missing drivers. Missing drivers may either be located in the non-coding genome or involve a mechanism that is difficult to demonstrate. Alternative splicing is one such mechanism that has the potential to be a significant driver of disease.3-7 It is estimated that 90% of protein-coding genes undergo alternative splicing to produce multiple transcripts.8 Disruption of the splicing mechanism has the potential to have a large impact on the transcriptome and ultimately key regulatory pathways.
The spliceosome comprises a multi-component enzyme system that facilitates the splicing of pre-mRNA. The spliceosome removes an intron and subsequently ligates the proximal 5’ and 3’ exons. An intron is identified by the spliceosome through the recognition of four consensus elements which include: the 5’ splice site; the 3’ splice site; a branch point located upstream of the 3’ splice site; and lastly a polypyrimidine tract located between the splice site and branch point, which aids the recruitments of splicing factors.9,10 SF3B1, a component of the spliceosome, is essential for correct binding and splicing of pre-mRNA.
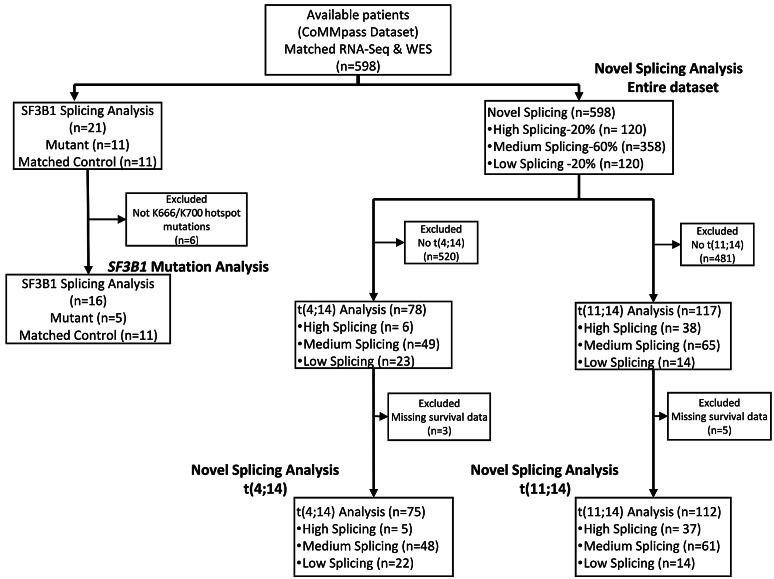
Figure 1.
CONSORT flow diagram of breakdown of sample subsets used for each analysis. Four subsets of the data were used, which included the SF3B1 mutation analysis, novel splicing in the entire dataset, as well as novel splicing in the multiple myeloma subgroups t(4;14) and t(11;14). Reasons for exclusion of samples for each analysis are provided. CoMMpass: Clinical Outcomes in Multiple Myeloma to Personal Assessment of Genetic Profile; n: number.
SF3B1 mutations causing alternative splicing are common in hematological malignancies, especially in chronic lymphocytic leukemia (CLL) and myelodysplastic syndromes (MDS), where they are mutated at a rate of 5-18% and 30%, respectively.11-14 Mutation in SF3B1 has also been shown to result in alternative splicing in uveal melanoma and breast cancer.15,16 In MM, SF3B1 is a driver gene and is mutated in 1.7% of patients. Hotspot mutations in SF3B1 at codons K700 and K666 result in a change-of-function, altering the preference for a cryptic 3’ splice site selection over the canonical 3’ splice site.17,18 The potential downstream effects include the production of transcripts that are either translated to abnormal proteins or undergo nonsense-mediated decay resulting in downregulation of the canonical transcript. In this work, we investigate the spectrum of mutations in SF3B1, their downstream impact, and the greater role alternative splicing plays in the pathogenesis of MM.
Methods
Ethics statement
The University of Arkansas for Medical Sciences Institutional Review Board determined that this project is exempt and is not classified as human subject research.
Samples and sequencing analysis
We analyzed 598 newly diagnosed MM (NDMM) samples from the CoMMpass dataset which contains whole exome sequencing and RNA-seq data that were uniformly processed. Figure 1 shows a CONSORT flow diagram of the breakdown of available samples for the four different analyses performed on the data. WES data were analyzed for mutations using a previously described pipeline.1,19 RNA-seq data was analyzed using a pipeline that included the transcript aligner STAR20 (v2.5.1b). Salmon21 (v0.7.2) was used to align reads to the transcriptome and quantify expression at the gene and transcript level.
Differential splicing analysis
We took a multifaceted approach to identify differential splicing and exon usage. Sequencing alignment and quality control (QC) metrics were determined using QoRTs22 (v1.2.42), including quantification of the number of known splice junctions (annotated splice junctions), novel splice junctions and read counts of different genomic features for downstream analysis. JunctionSeq23 (v1.10.0) was used to perform differential splicing and exon usage. Similarly, DEXSeq24 (v1.26.0) was used to identify differential exon usage. Finally, SUPPA225 (v2.2.2) was used to identify alternative splicing and the type of splicing event. lncScore26 (v1.0.2) was used to calculate the coding potential of transcripts with novel splice junctions and provides a call of non-coding or coding. A score closer to one is an indication of the confidence of it being protein coding.
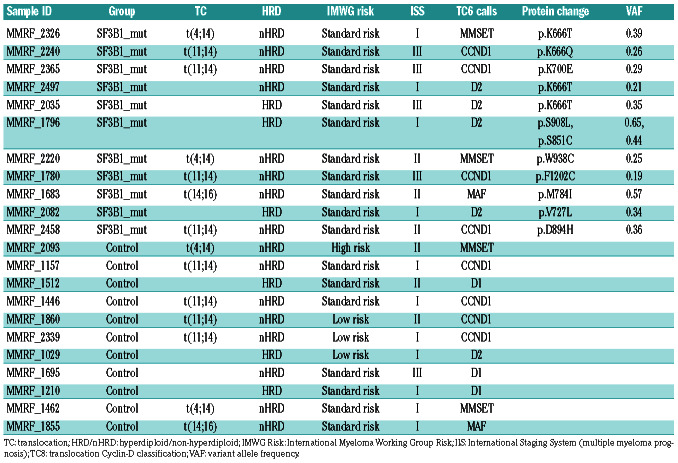
Table 1.
Multiple myeloma sample characteristics used in the comparison of controls versus SF3B1 mutants.
Additional details of the pipelines and software used for data analysis are available in the Online Supplementary Appendix.
Results
Hotspot mutations are associated with differential splicing
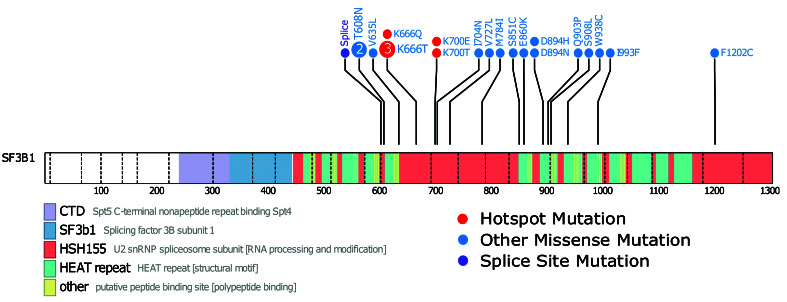
We identified non-synonymous SF3B1 mutations in 1.7% (n=21) of NDMM samples. The mutations consisted of 21 missense and one splice site mutation (one sample had 2 mutations) (Figure 2). Of the 21 samples with mutated SF3B1, 11 had accompanying RNA-seq data. Of the missense mutations, six were in known hotspots at codons K666 and K700. To confirm that only the hotspot mutation in SF3B1 contributed to aberrant splicing, the 11 SF3B1 mutants were compared against 11 wild-type SF3B1 samples for aberrant splicing patterns. The comparator group was matched for key MM molecular subtypes (Table 1) resulting in just four significantly differentially spliced genes.
We went on to analyze samples with hotspot mutations and the five (one did not have RNA-Seq data) samples with such mutations were compared to the original control group of 11 samples. This analysis showed a marked increase in the number of significant differentially spliced events after multiple testing correction (435 significant splicing events compared to just four using all SF3B1 mutants). The median variant allele frequency (VAF) for the SF3B1 missense mutations was 0.3 (range 0.1-0.64). There was no significant difference in the median VAF between hotspot and non-hotspot mutations in SF3B1, suggesting clonal versus sub-clonal mutations were not responsible for the lack of splicing in the non-hotspot samples (Online Supplementary Figure S1). Investigation of SF3B1 expression at both the gene and transcript level between groups showed no significant difference (Online Supplementary Figure S2), confirming that the detected difference in splicing was also not due to a change in the level of SF3B1 expression. There was no significant difference in any other recurrent non-synonymous gene mutations between the hotspot SF3B1 mutant and the control group.
Differential splicing analysis identifies a large number of significantly differentially spliced events in SF3B1 mutant samples
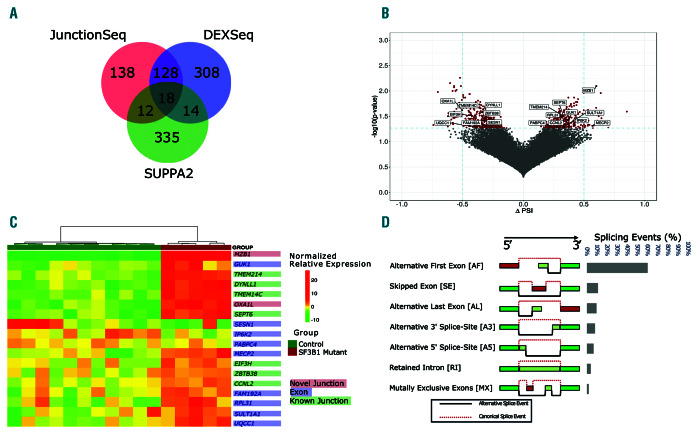
To assess the extent of differential splicing three tools were used each looking at different components of the splicing process. Comparing SF3B1 mutants with the controls showed that 953 genes were significantly differentially spliced (Online Supplementary Tables S1-S5). The intersection of these three methods identified 18 genes that had differentially spliced exons or splice junctions (Figure 3A). The change in proportion of spliced-in (PSI) events is the change in relative abundance between the groups (Figure 3B). It indicates the inclusion or exclusion of a particular splice junction or exon. Unsupervised hierarchical clustering on the normalized expression shows the use of an alternative exon or splice junction for the 18 genes in each sample (Figure 3C). The genes MZB1, DYNLL1, TMEM14C, OXA1L, SESN1, and UQCC1 have been identified in MDS and CLL samples. These genes show no difference in total gene expression (Online Supplementary Figure S3).
Figure 2.
SF3B1 mutations in multiple myeloma patient samples. A lollipop diagram of the location of non-silent SF3B1 mutations in the dataset. The hotspot mutations of K666 and K700 are marked in red, other non-silent mutations are marked in blue, and splice site mutations in purple. Key domains are labeled.
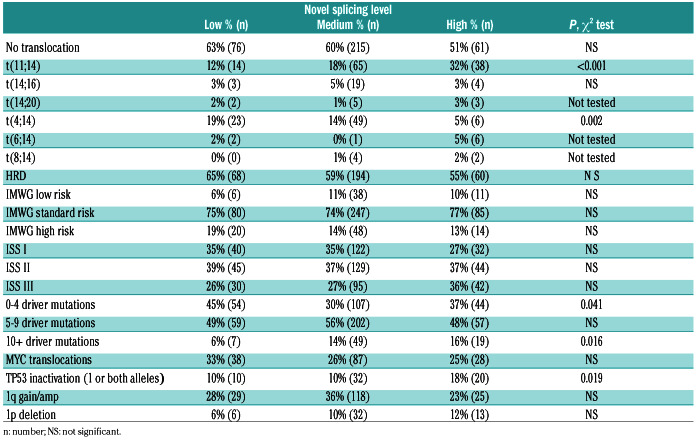
Table 2.
Significant clinical and genomic characteristics of multiple myeloma in relation to the low (20th), medium (20th-80th), and high (80th) novel splicing patient sample groups.
Differential splicing caused by hotspot mutations in SF3B1
In an analysis of splice site usage, we identified 39 (10%) novel splice sites, 153 (38%) known splice sites and 211 (52%) differentially used exons (P<0.05). The types of splicing events include: Skipped Exons (SE), Mutually Exclusive Exons (MX), Alternative 5’ Splice-sites (A5), Alternative 3’ Splice-sites (A3), Retained Introns (RI), Alternative First Exons (AF) and Alternative Last Exons (AL). Identified splice site variants were categorized as 418 (60%) AF exons, 76 (9%) SE, 55 (8%) A3, 45 (6%) A5, 26 (4%) RI and 12 (2%) MX (Figure 3D). The Leafcutter algorithm, which takes account of novel splice junctions, identified 373 cryptic 5’ splice site events and 527 cryptic 3’ splice site events consistent with the expected effect of mutation of SF3B1 where 3’ alternative splicing is the main mechanism of action (Online Supplementary Table S5).
Figure 3.
Hotspot mutations in SF3B1 results in a number of alternatively spliced genes. (A) Venn diagram of alternative splicing results from the three methods used. (B) A volcano plot of delta-PSI in relationship to significant splicing events between control and SF3B1 mutated samples. Red dots indicate significant events (P≤0.05). Differential splicing analysis was performed by SUPPA2. Genes that are labeled were found by all three differential splicing algorithms as statistically significant after multiple testing correction. Delta-PSI indicates a change in the inclusion or exclusion of a splice junction or exon in the mutated SF3B1 group versus the wild-type group. (C) Heatmap of the relative expression of significant alternative splicing features for the 18 genes found by all three differential splicing tools. Features include exon, known and novel splice junctions. (D) Types of significant splicing events identified.
To determine if these novel splice sites generated novel coding sequences, we analyzed the de novo assembled fulllength transcripts. Visual inspection of the novel splice sites allowed us to attribute 19 of the 39 novel splice sites to 20 novel transcripts. The coding potential for these assembled transcripts was determined and 16 of the novel splice junctions were categorized as protein coding and four were determined to be non-coding (CREBZF, MPC1, PKHD1L1, and TXNDC11) (Online Supplementary Table S6).
MZB1 differential splicing and transcript expression
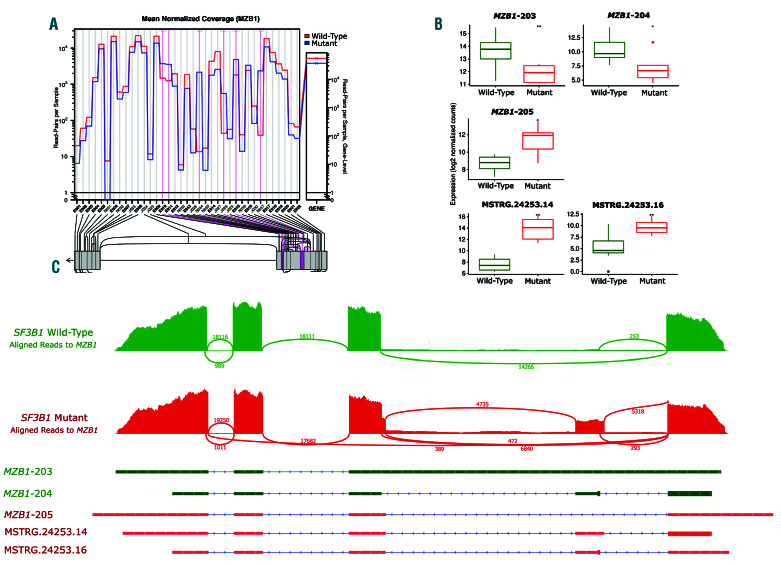
Marginal zone B and B1 cell specific protein (MZB1), is encoded by a gene that has eight potential transcripts. MZB1-201 is protein-coding transcript, MZB1-202, MZB1-204, MZB1-205, and MZB1-208 are removed via nonsense-medicated decay and MZB1-203, MZB1-206, and MZB1-207 have a retained intron. Differential splicing analysis between the mutated SF3B1 samples and the control group identified six significant splicing events which included two novel splice junctions, one known splice junction, and differential usage of two exons (Figure 4A). Three known transcripts, MZB1-203, MZB1-204 and MZB1-205 showed significant differences in the levels of expression between the two groups (Figure 4B and C). MZB1-205, which has been associated with apoptosis, was significantly higher in the SF3B1 mutant samples. Conversely, the transcripts MZB1-203 and MZB1-204 were significantly down-regulated in the SF3B1 mutant samples. Manual inspection of de novo-assembled transcripts identified two novel transcripts identified due to alternative splicing; designated MSTRG.24254.14 and MSTRG.24253.16. They had protein coding potential scores of 0.96 and 0.71 respectively and were both identified as coding. MSTRG.24253.14 and MSTRG.24253.16 share junctions with MZB1-204, which explains the reduced expression of MZB1-204, which is due to increased expression of these novel transcripts (Figure 4B and C).
Spliceosome complex and cell proliferation genes are differentially expressed in mutated samples
Differential gene and transcript analysis identified genes and transcripts not necessarily differentially spliced but altered in response to alternative splicing. We identified 234 significantly differentially expressed genes (adjusted P≤0.05) and 365 transcripts that were differentially expressed between SF3B1 mutants and the controls (adjusted P≤0.05) (Online Supplementary Tables S7-S10). Of the differentially expressed transcripts, 79 corresponded with a change at the gene level (22%). The differentially expressed genes at both the gene and transcript level included the protein coding genes EREG, IL1B, and MINA, which were found to be upregulated in the SF3B1mutants and have been associated with cell proliferation.27-29 Other transcripts that were significantly differentially upregulated included a number of RNA splicing and spliceosome genes including DHX9, CLASRP, SNRPE, BCAS2, and EIF4A3.30-32 These genes have significant changes at the transcript level only and indicate a change in isoform ratio without an effect on the overall gene expression level (Online Supplementary Tables S8 and S10).
Figure 4.
MZB1, an important prognostic gene in multiple myeloma, was significantly alternative spliced in SF3B1-mutated patient samples. (A) Screenshot from JunctionSeq identifying two significant novel splice junction usage in addition to a known splice junction and three differentially used exons in the SF3B1 mutants. (B) Sashimi plot showing differential exon and splice junction usage between a SF3B1 mutated and control sample. (Note that all SF3B1 mutated samples displayed the same differential splicing pattern.) (C) Box plots of MZB1 transcript expression levels. Two transcripts showed a significant switch in level of expression between the two groups.
Gene set enrichment analysis of differentially spliced genes
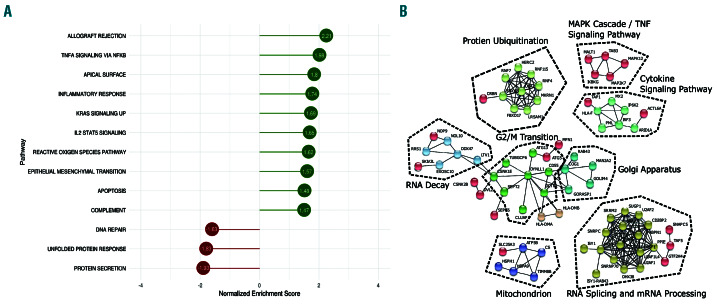
To identify the impact of mutated SF3B1 at a pathway level we carried out GSEA on the total set of differential gene expression results. The Hallmark pathways33 with significant (false discovery rate [FDR] <0.05) normalized enrichment scores (NES) between the two sample groups were identified (Figure 5A). This analysis showed decreased gene enrichment for protein secretion (P=0.01, NES= -1.93) and unfolded protein response (UPR) (P=0.01, NES=1.83) pathways. Conversely GSEA identified enrichment for TNFA signaling via NF-κB (P=0.01, NES=1.98), KRAS signaling (P=0.008, NES=1.69), and I2/STAT5 signaling (P=0.01, NES=0.65) pathways in SF3B1 mutant samples.
Significantly alternatively spliced genes are themselves involved in alternative splicing
We identified protein-protein interactions (PPI) using the list of significantly alternatively (JunctionSeq & DEXSeq) spliced genes as input (n=618) and only selected high confidence interactions (minimum interaction score of 0.700). The resulting PPI network (Figure 5B) identified a large cluster of differentially spliced genes associated with mRNA processing and splicing pathways. Genes identified in the mRNA processing pathway included SRRM2, SUGP1, and PPIE. Other pathways in the differentially spliced gene clusters included RNA decay and protein ubiquitination.
Identifying the full extent of splice variation as a potential driver mechanism in multiple myeloma
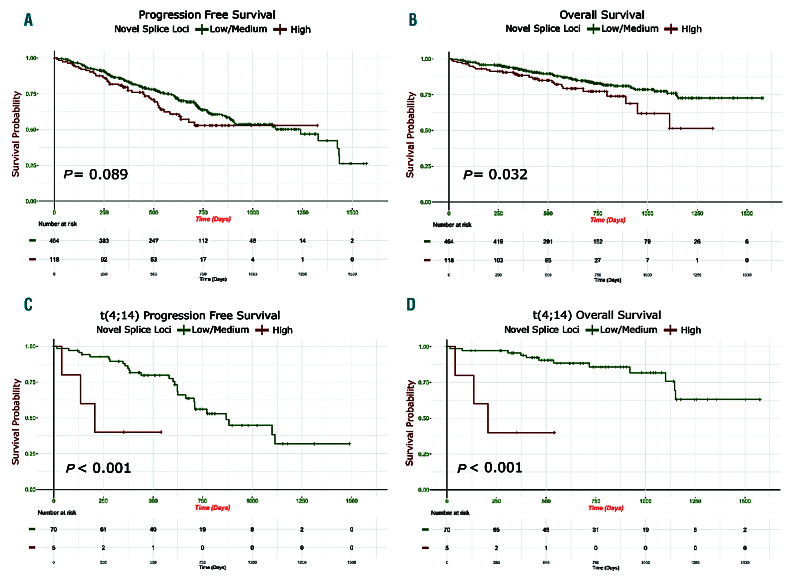
To determine the extent of alternative splicing in MM, irrespective of mutations in SF3B1, we split the dataset (n=598) into three groups. The groups consisted of the top and bottom 20% (both n=120) and middle 60% (n=358) in number of novel splice loci (Online Supplementary Figure S4). We compared the makeup of the groups based on key MM clinical and genomic characteristics. We first looked at the number of novel splice loci in each group defined by translocations and compared it to the group of samples without translocations. We included a group of four pooled normal donor samples derived from CD138 selected plasma cells in the analysis for comparison (Online Supplementary Figure S5). The t(4;14) group had significantly fewer novel splice loci than the group with no translocations and other translocation groups. The t(11;14) and t(6;14) group had significantly more novel splice loci. We identified significantly less novel splicing in the t(4;14) group and an increase in the t(11;14) group (vs. the no translocation group; P=0.002 and P=0.0001) (Table 2). There was no difference in the frequency of MYC translocations, International Myeloma Working Group (IMWG) or International Scoring System (ISS) risk scores but there was a significant difference in p53 inactivation (one or both alleles) in the high splice group (P=0.019). Survival analysis revealed a significant difference in progressionfree survival (PFS) and overall survival (OS) (P=0.03 and 0.013) with the high splice group having adverse outcome (Figure 6A and B).
Figure 5.
Analysis of differentially expressed and alternatively spliced genes in SF3B1 mutated samples identified enrichment in important pathways. (A) The normalized enrichment score (NES) results of the Gene Set Enrichment Analysis (GSEA). (B) A network diagram produced by STRING, which uses known and predicted protein-protein interactions. Using the genes that are the most significantly alternatively spliced by JunctionSeq or DEXSeq and setting the minimum required interaction score of 0.9, the resulting network diagram is shown with highly confident interactions. Sub clusters with fewer than three nodes were removed.
Effect of aberrant splicing on progression-free survival and overall survival in t(11;14) and t(4;14) subgroups
A survival analysis was performed on a subset of the data, splitting samples with t(11;14) and t(4;14) into the high, medium, and low number of novel splice junctions. Survival analysis for the t(11;14) group showed a non-significant difference in PFS in the t(11;14) with a high number of novel splice junctions versus low, but no difference in OS (Online Supplementary Figure S6). OS and PFS for the t(4;14) group showed a significant adverse survival in the high splice group within t(4;14) (P=0.009 and P<0.001, respectively) (Figure 6C and D). To determine additional features that may contribute to this ultra high-risk group, we performed a univariate and multivariate Cox regression analysis. Features in the univariate analysis included the number of driver mutations (0-4, 5-9 and 10+ mutations), ISS (I, II and III), novel splice site group (high, medium and low), bi-allelic inactivation of TP53, loss of heterozygosity (LOH) (>4.6%), and double-hit (being defined as amp1q on a background of ISS III or bi-allelic inactivation of TP53).34 Bi-allelic inactivation of TP53, double-hit, high novel splicing, having more than ten driver mutations, and LOH were associated with poorer PFS (P≤0.05). High novel splicing, LOH, double-hit and bi-allelic inactivation of TP53 were associated with poorer OS (P≤0.05). Next, we took the features found significant in the univariate analysis as co-variates in the multivariate analysis to see how they jointly impact PFS and OS. In the analysis for PFS, only double-hit remained significant, but for OS, only high splicing remained close to significant (P=0.051, hazard ratio 6.62 [95%CI: 0.99-44.14]) (Online Supplementary Figure S7).
Discussion
In this study, we have investigated the impact of mutations in SF3B1 on the transcriptome, observing a significant impact of hotspot mutations of SF3B1 in codons K666/700 resulting in abnormal splicing patterns, as well as the introduction of novel transcripts. We were able to show that not all mutations in SF3B1 result in abnormal splicing, and that the key hotspots are the drivers of this aberrant phenomenon. We identified a number of alternatively spliced genes in common with other cancers with hotspot mutations in SF3B1, TMEM14C, RPL31, DYNLL1, UQCC, and CRNDE, indicating a commonality in biology between them. Comparison of all of our alternatively spliced genes with those in uveal melanoma18 identified a similar number of alternatively spliced genes (935 vs. 1019), but only 165 (9%) genes overlapped. This low percentage overlap may indicate that hotspot mutations in SF3B1 affect a large set of genes that are specific to MM.
Figure 6.
Patients with high levels of novel splice loci are associated with poor outcome. (A and B) Kaplan-Meier curves in high novel splicing (top 20%) (n=117) versus low/medium novel splicing (bottom 60%) (n=464) patient samples: (A) progression-free survival; (B) overall survival. (C and D) Outcome of patients with a t(4;14) with low/medium (n=70), and high (n=5) novel splice groups: (C) progression-free survival; (D) overall survival.
We found that many of the genes undergoing alternative splicing in MM are genes related to mRNA processing and splicing such as PPIE, SUGP1 and the small nuclear ribonucleoproteins, SNRPN and SNRPC. We also detect a large number of genes related to protein ubiquitination and RNA decay. Implying that disruption to mRNA splicing, due to the hotspot mutations in SF3B1, activates these genes and pathways. Similar enrichment to protein ubiquitination and RNA decay pathways have been observed in myelodysplasia with mutations in splicing factors.35,36 We hypothesize that in an effort to remove aberrant proteins and transcripts they themselves are aberrantly spliced perpetuating the cellular dysregulation.
We detected significant disruption to the splicing and expression of MZB1, resulting in differential expression at the transcript level as well as differential splicing and the introduction of novel transcripts due to novel splice sites. MZB1 in B cells is an endoplasmic reticulum-localized protein and plays a role in protein folding and antibody secretion.37,38 MZB1 has been shown to have a prognostic value in many mature B-cell diseases such as CLL, follicular lymphoma, and diffuse large B-cell lymphoma, where higher expression is associated with poorer survival.39 Additional experiments will be needed to see if changes to MZB1 isoform ratios, as well as to the altered splicing of its transcripts, have similar prognostic value in MM.
The results of both GSEA identified common deregulated pathways in both the mutated SF3B1 and high splice groups, namely UPR and protein secretion pathways. The UPR is a key pathway in many cancers that is important in many secretory tissues such as plasma cells due to its protective role in avoiding endoplasmic reticulum (ER) stress induced apoptosis.40,41 The SF3B1 mutant group had increased splicing aberrations, but we identified signatures of decreased UPR activity. We would expect that there would be an enrichment in these pathways because these splicing aberrations have the potential to increase nonviable transcripts.
Based on the importance of splicing associated with SF3B1 mutations, we characterized abnormal splicing and potential association with clinically relevant features of MM. We observed a significant difference in novel splicing sites in the pooled normal samples compared to all other groups, suggesting that there is a general increase in aberrant splicing in MM. In addition, there were clear differences in aberrant or alternative splicing in the different translocation groups. In our ongoing quest to refine the classification of MM subgroups, the identification of an association of t(4;14) samples with less aberrant splicing and the t(11;14) subgroup being associated with more aberrant splicing was of particular interest.34,42 Patients that have the less aggressive t(11;14) and have high novel splicing had no change in their OS. In the t(4;14) with high novel splicing (top 20%), the OS is significantly poorer, suggesting that there is an ultra-high risk group of t(4;14) with increased alternative splicing which showed some association with high-risk features such as LOH and double- hit. However, in the case of OS, it was the increased splicing which was the most significant. Although increased splicing is not exclusively associated with aggressive disease, these results provide evidence that changes to a cell's splicing as either a mechanism or result of other adverse features may suggest a more aggressive phenotype that may need to be treated differently.11
We showed that alternative splicing might be a significant mechanism that has pathogenic relevance to MM. Hotspot mutations in the driver gene, SF3B1, result in a significant impact on the MM transcriptome. Although SF3B1 mutations represent a small percentage of driver mutations, it does present a promising target for splice modulating drugs. In addition to the hotspot SF3B1 mutations, we also show a general increase in novel splicing in MM, and at its extreme, this is strongly associated with decreased PFS and OS. There are a number of spliceosome modulators under investigation including spliceostatins A-G, E7107 and H3B-8800, that target SF3B1.43,44 Recent work has shown that these compounds are more effective in cells that have higher expression of SF3B1 and are, therefore, more dependent on SF3B1.45 Our observation of increased SF3B1 expression in the high splice group, which constitutes up to 20% of patients, may increase the number of patients that may benefit from spliceosome modulators, rather than just the patients who have mutated SF3B1.
The results of the study make it clear that only looking at gene, or even transcript expression, can obscure important changes in the transcriptome. Alternative splicing may be an important pathogenic disease mechanism in MM that affects a wide range of important pathways. Additional studies of the MM transcriptome may provide important insights into the disease pathogenesis.
Supplementary Material
Acknowledgments
Funding support for the CoMMpass dataset was provided by the Myeloma Genome Project. The CoMMpass dataset was generated by the Multiple Myeloma Research Foundation in collaboration with the Multiple Myeloma Research Consortium.
Funding Statement
Funding: Funding for data processing and storage was provided by Celgene Corporation. Other authors declare no competing interests.
References
- 1.Walker BA, Mavrommatis K, Wardell CP, et al. Identification of novel mutational drivers reveals oncogene dependencies in multiple myeloma. Blood. 2018;132(6):587-597. [DOI] [PMC free article] [PubMed] [Google Scholar]
- 2.Prideaux SM, O’Brien EC, Chevassut TJ. The genetic architecture of multiple myeloma. Adv Hematol. 2014;2014:864058. [DOI] [PMC free article] [PubMed] [Google Scholar]
- 3.Lee SC-W, Dvinge H, Kim E, et al. Modulation of splicing catalysis for therapeutic targeting of leukemia with mutations in genes encoding spliceosomal proteins. Nat Med. 2016;22(6):672-678. [DOI] [PMC free article] [PubMed] [Google Scholar]
- 4.Urbanski LM, Leclair N, Anczuków O. Alternative-splicing defects in cancer: splicing regulators and their downstream targets, guiding the way to novel cancer therapeutics. Wiley Interdiscip Rev RNA. 2018; 9(4):e1476. [DOI] [PMC free article] [PubMed] [Google Scholar]
- 5.Li YI, van de Geijn B, Raj A, et al. RNA splicing is a primary link between genetic variation and disease. Science. 2016; 352(6285): 600-604. [DOI] [PMC free article] [PubMed] [Google Scholar]
- 6.Climente-González H, Porta-Pardo E, Godzik A, Eyras E. The functional impact of alternative splicing in cancer. Cell Rep. 2017; 20(9):2215-2226. [DOI] [PubMed] [Google Scholar]
- 7.Sebestyén E, Singh B, Miñana B, et al. Largescale analysis of genome and transcriptome alterations in multiple tumors unveils novel cancer-relevant splicing networks. Genome Res. 2016;26(6):732-744. [DOI] [PMC free article] [PubMed] [Google Scholar]
- 8.Lee Y, Rio DC. Mechanisms and regulation of alternative pre-mRNA splicing. Annu Rev Biochem. 2015;84(1):291-323. [DOI] [PMC free article] [PubMed] [Google Scholar]
- 9.Corvelo A, Hallegger M, Smith CWJ, Eyras E. Genome-wide association between branch point properties and alternative splicing. PLoS Comput Biol. 2010; 6(11):e1001016. [DOI] [PMC free article] [PubMed] [Google Scholar]
- 10.Lin P-C, Xu R-M. Structure and assembly of the SF3a splicing factor complex of U2 snRNP. EMBO J. 2012;31(6):1579-1590. [DOI] [PMC free article] [PubMed] [Google Scholar]
- 11.Wang L, Brooks AN, Fan J, et al. Transcriptomic characterization of SF3B1 mutation reveals its pleiotropic effects in chronic lymphocytic leukemia. Cancer Cell. 2016;30(5):750-763. [DOI] [PMC free article] [PubMed] [Google Scholar]
- 12.DeBoever C, Ghia EM, Shepard PJ, et al. Transcriptome sequencing reveals potential mechanism of cryptic 3’ splice site selection in SF3B1-mutated cancers. PLOS Comput Biol. 2015;11(3):e1004105. [DOI] [PMC free article] [PubMed] [Google Scholar]
- 13.Dolatshad H, Pellagatti A, Fernandez- Mercado M, et al. Disruption of SF3B1 results in deregulated expression and splicing of key genes and pathways in myelodysplastic syndrome hematopoietic stem and progenitor cells. Leukemia. 2015;29(5): 1092-1103. [DOI] [PMC free article] [PubMed] [Google Scholar]
- 14.Inoue D, Abdel-Wahab O. Modeling SF3B1 mutations in cancer: advances, challenges, and opportunities. Cancer Cell. 2016;30(3): 371-373. [DOI] [PMC free article] [PubMed] [Google Scholar]
- 15.Furney SJ, Pedersen M, Gentien D, et al. SF3B1 mutations are associated with alternative splicing in uveal melanoma. Cancer Discov. 2013;3(10):1122-1129. [DOI] [PMC free article] [PubMed] [Google Scholar]
- 16.Maguire SL, Leonidou A, Wai P, et al. SF3B1 mutations constitute a novel therapeutic target in breast cancer. J Pathol. 2015; 235(4):571-580. [DOI] [PMC free article] [PubMed] [Google Scholar]
- 17.Kesarwani AK, Ramirez O, Gupta AK, et al. Cancer-associated SF3B1 mutants recognize otherwise inaccessible cryptic 3’ splice sites within RNA secondary structures. Oncogene. 2017;36(8):1123-1133. [DOI] [PMC free article] [PubMed] [Google Scholar]
- 18.Alsafadi S, Houy A, Battistella A, et al. Cancer-associated SF3B1 mutations affect alternative splicing by promoting alternative branchpoint usage. Nat Commun. 2016; 7:10615. [DOI] [PMC free article] [PubMed] [Google Scholar]
- 19.Walker BA, Mavrommatis K, Wardell CP, et al. A high-risk, double-hit, group of newly diagnosed myeloma identified by genomic analysis. Leukemia. 2019;33(1):159-170. [DOI] [PMC free article] [PubMed] [Google Scholar]
- 20.Dobin A, Davis CA, Schlesinger F, et al. STAR: ultrafast universal RNA-seq aligner. Bioinformatics. 2013;29(1):15-21. [DOI] [PMC free article] [PubMed] [Google Scholar]
- 21.Patro R, Duggal G, Kingsford C. Salmon: accurate, versatile and ultrafast quantification from RNA-seq data using lightweightalignment. bioRxiv. 2015;021592. [Google Scholar]
- 22.Hartley SW, Mullikin JC. QoRTs: a comprehensive toolset for quality control and data processing of RNA-Seq experiments. BMC Bioinformatics. 2015;16(1):224. [DOI] [PMC free article] [PubMed] [Google Scholar]
- 23.Hartley SW Mullikin JC.. Detection and visualization of differential splicing in RNASeq data with JunctionSeq. Nucleic Acids Res. 2016;44(15):e127. [DOI] [PMC free article] [PubMed] [Google Scholar]
- 24.Reyes A, Anders S, Huber W. Analyzing RNA-seq data for differential exon usage with the DEXSeq package. Gastroenterology. 2011;138(3):958-968. [Google Scholar]
- 25.Alamancos GP, Pagès A, Trincado JL, Bellora N, Eyras E. SUPPA: a super-fast pipeline for alternative splicing analysis from RNA-Seq. bioRxiv. 2014;008763. [Google Scholar]
- 26.Zhao J, Song X, Wang K. lncScore: alignment- free identification of long noncoding RNA from assembled novel transcripts. Sci Rep. 2016;6(1):34838. [DOI] [PMC free article] [PubMed] [Google Scholar]
- 27.Riese DJ, Cullum RL. Epiregulin: roles in normal physiology and cancer. Semin Cell Dev Biol. 2014;28:49-56. [DOI] [PMC free article] [PubMed] [Google Scholar]
- 28.Lewis AM, Varghese S, Xu H, Alexander HR. Interleukin-1 and cancer progression: the emerging role of interleukin-1 receptor antagonist as a novel therapeutic agent in cancer treatment. J Transl Med. 2006;4:48. [DOI] [PMC free article] [PubMed] [Google Scholar]
- 29.Huang M-Y, Xuan F, Liu W, Cui H-J. MINA controls proliferation and tumorigenesis of glioblastoma by epigenetically regulating cyclins and CDKs via H3K9me3 demethylation. Oncogene. 2017;36(3):387-396. [DOI] [PubMed] [Google Scholar]
- 30.Chen Y-IG, Moore RE, Ge HY, Young MK, Lee TD, Stevens SW. Proteomic analysis of in vivo-assembled pre-mRNA splicing complexes expands the catalog of participating factors. Nucleic Acids Res. 2007;35(12): 3928-3944. [DOI] [PMC free article] [PubMed] [Google Scholar]
- 31.Hagiwara M. Alternative splicing: A new drug target of the post-genome era. Biochim Biophys Acta. 2005;1754(1-2):324-331. [DOI] [PubMed] [Google Scholar]
- 32.Chan CC, Dostie J, Diem MD, et al. eIF4A3 is a novel component of the exon junction complex. RNA. 2004;10(2):200-209. [DOI] [PMC free article] [PubMed] [Google Scholar]
- 33.Liberzon A, Birger C, Thorvaldsdóttir H, Ghandi M, Mesirov JP, Tamayo P. The Molecular Signatures Database Hallmark Gene Set Collection. Cell Syst. 2015; 1(6):417-425. [DOI] [PMC free article] [PubMed] [Google Scholar]
- 34.Walker BA, Mavrommatis K, Wardell CP, et al. A high-risk, double-Hit, group of newly diagnosed myeloma identified by genomic analysis. Leukemia. 2019;33(1):159-170. [DOI] [PMC free article] [PubMed] [Google Scholar]
- 35.Pellagatti A, Armstrong RN, Steeples V, et al. Impact of spliceosome mutations on RNA splicing in myelodysplasia: dysregulated genes/pathways and clinical associations. Blood. 2018;132(12):1225-1240. [DOI] [PMC free article] [PubMed] [Google Scholar]
- 36.Yoshida K, Sanada M, Shiraishi Y, et al. Frequent pathway mutations of splicing machinery in myelodysplasia. Nature. 2011;478(7367):64-69. [DOI] [PubMed] [Google Scholar]
- 37.Flach H, Rosenbaum M, Duchniewicz M, et al. Mzb1 protein regulates calcium homeostasis, antibody secretion, and integrin activation in innate-like B cells. Immunity. 2010; 33(5):723-735. [DOI] [PMC free article] [PubMed] [Google Scholar]
- 38.Rosenbaum M, Andreani V, Kapoor T, et al. MZB1 is a GRP94 cochaperone that enables proper immunoglobulin heavy chain biosynthesis upon ER stress. Genes Dev. 2014;28(11):1165-1178. [DOI] [PMC free article] [PubMed] [Google Scholar]
- 39.Herold T, Mulaw MA, Jurinovic V, et al. High expression of MZB1 predicts adverse prognosis in chronic lymphocytic leukemia, follicular lymphoma and diffuse large B-cell lymphoma and is associated with a unique gene expression signature. Leuk Lymphoma. 2013;54(8):1652-1657. [DOI] [PubMed] [Google Scholar]
- 40.Walter P, Ron D. The unfolded protein response: from stress pathway to homeostatic regulation. Science. 2011;334(6059):1081-1086. [DOI] [PubMed] [Google Scholar]
- 41.Lin JH, Li H, Yasumura D, et al. IRE1 Signaling affects cell fate during the unfolded protein response. Science. 2007; 318(5852):944-949. [DOI] [PMC free article] [PubMed] [Google Scholar]
- 42.Walker BA, Mavrommatis K, Wardell CP, et al. Identification of novel mutational drivers reveals oncogene dependencies in multiple myeloma. Blood. 2018;132(6):587-597. [DOI] [PMC free article] [PubMed] [Google Scholar]
- 43.Obeng EA, Chappell RJ, Seiler M, et al. Physiologic expression of Sf3b1K700E causes impaired erythropoiesis, aberrant splicing, and sensitivity to therapeutic spliceosome modulation. Cancer Cell. 2016; 30(3):404-417. [DOI] [PMC free article] [PubMed] [Google Scholar]
- 44.Seiler M, Yoshimi A, Darman R, et al. H3B- 8800, an orally available small-molecule splicing modulator, induces lethality in spliceosome-mutant cancers. Nat Med. 2018;24(4):497-504. [DOI] [PMC free article] [PubMed] [Google Scholar]
- 45.Huang HH-L, Ferguson ID, Thornton AM, et al. Proteasome inhibitor-induced modulation reveals the spliceosome as a specific therapeutic vulnerability in multiple myeloma. bioRxiv. 2018;508549. [DOI] [PMC free article] [PubMed] [Google Scholar]
Associated Data
This section collects any data citations, data availability statements, or supplementary materials included in this article.


