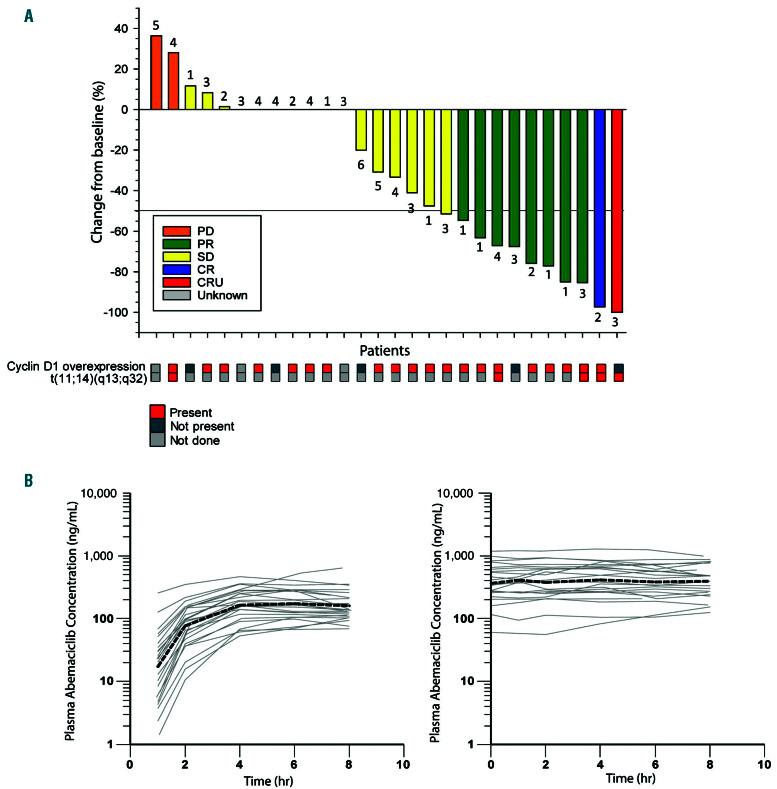
Figure 1.
Anti-tumor activity and pharmacokinetics of abemaciclib. (A) Change in tumor size at best response. Best overall response was based on investigator assessment. Number above or below each bar is the number of treatment regimens prior to study entry. Cyclin D1 expression and t(11;14)(q13;q32) translocation in each patient is shown below the response. (B) Abemaciclib plasma concentration-time profiles following oral administration of single (left panel) and multiple (right panel) doses of 200 mg abemaciclib every 12 hours, depicted as individual (gray continuous lines) and geometric mean (black broken line).

