Abstract
Background
Widespread social distancing and lockdowns of everyday activity have been the primary policy prescription across many countries throughout the coronavirus disease 2019 (COVID-19) pandemic. Despite their uniformity, these measures may be differentially valuable for different countries.
Methods
We use a compartmental epidemiological model to project the spread of COVID-19 across policy scenarios in high- and low-income countries. We embed estimates of the welfare value of disease avoidance into the epidemiological projections to estimate the return to more stringent lockdown policies.
Results
Social distancing measures that ‘flatten the curve’ of the disease provide immense welfare value in upper-income countries. However, social distancing policies deliver significantly less value in lower-income countries that have younger populations, which are less vulnerable to COVID-19. Equally important, social distancing mandates a trade-off between disease risk and economic activity. Poorer people are less able to make those economic sacrifices.
Conclusions
The epidemiological and welfare value of social distancing is smaller in lower-income countries and such policies may exact a heavy toll on the poorest and most vulnerable. Workers in the informal sector often lack the resources and social protections that enable them to isolate themselves until the virus passes. By limiting these households’ ability to earn a living, social distancing can lead to an increase in hunger, deprivation, and related mortality and morbidity.
Keywords: COVID-19, global health, pandemics, social distancing, VSL, welfare economics
Introduction
The coronavirus disease 2019 (COVID-19) pandemic has generated furious debate about what public health measures will prove most effective at controlling the spread of the disease. Without a vaccine for the novel coronavirus, governments across the world implemented social distancing and lockdown measures designed to ‘flatten the curve’ of the pandemic. The goal of shutting down a country is to minimize transmission rates for a sufficient duration so as to allow more targeted testing and tracking measures to be effective in slowing the spread of the virus and minimizing pressure on healthcare systems. In parallel with the implementation of these public health measures, a conversation has emerged about the economic consequences of lockdown and suppression, especially in low-income countries. With social distancing having become the universal strategy against COVID-19, a question emerges: was shuttering the economy for months a reasonable cost to pay?
The answer for the USA and other high-income countries with significant mortality risk from the coronavirus appears to be yes. By assigning an economic value to the mortality risk of COVID-19, it becomes clear that the cost of not intervening in high-income countries would be enormous.1 In other words, according to any reasonable benefit–cost metric, social distancing interventions and aggressive suppression are overwhelmingly justified.
The purpose of this article is to quantitatively explore the value of varying suppression strategies in lower- and middle-income countries. There are a number of demographic and infrastructural reasons why the benefits of lockdowns to suppress COVID-19 may co-vary with the income level of a country. Lower-income countries have relatively younger populations, and the predicted mortality of COVID-19 increases sharply with age.2 Therefore the majority of the population in low-income countries is predicted to face a relatively low mortality risk from the coronavirus. Conversely, the infrastructural limitations of the healthcare systems in low-income countries means that they are comparatively less capable of absorbing a rapid influx of COVID-19 patients, such that it may be infeasible to flatten the curve of the disease to fall within capacity without more significant lockdown or mitigation efforts.
The economic welfare value of reducing mortality risk from COVID-19 may also be less in lower-income countries. Because the poorest individuals and households live close to subsistence levels, they must necessarily accept higher risks to earn a living than richer people who may enjoy savings or access social welfare systems to sustain them through a prolonged lockdown. Many more workers in low-income countries are self-employed or in the informal sector and depend on daily wages to feed their families. In the absence of strong social protection and insurance, the cost imposed by social and economic distancing may be large in terms of immediate deprivation and hunger. This difference in risk valuation reflects a necessary determination by people who are less able to trade their livelihoods for a reduction in probabilistic risk. Poorer households may not be able to comply with lockdown orders, and countries with relatively weak enforcement capacity may end up with the worst of both worlds, a shuttered formal economy but continued informal economic activity, leading to the continued spread of COVID-19.
Materials and methods
We generate mortality predictions for severe acute respiratory syndrome coronavirus 2 (SARS-CoV-2) epidemic trajectories across five non-pharmacological intervention scenarios using squire, an age-structured compartmental Susceptible-Exposed-Infected-Recovered (SEIR) model designed by the Imperial College London COVID-19 Response Team.3 The model simulates the spread of the novel coronavirus in each country and resultant hospitalizations and fatalities according to that country's demographic structure and healthcare capacity. We model each country's population at the start of the pandemic, where everyone is initially susceptible. As the virus spreads, more of the population becomes exposed, then infected, then recovers. Infected individuals either experience a mild infection or a more severe form that requires some form of hospitalization. Hospitalized cases are further split between those requiring intensive treatment and those requiring routine hospital care. The model assigns an age-specific mortality probability to individuals that receive hospital care and a higher mortality likelihood to individuals that require but cannot receive hospital care due to capacity constraints. The speed with which the virus spreads, and the fraction of the population that is ultimately infected, is defined by the estimated infectivity (R0) of the virus. The infectivity of the virus is determined by both its biological parameters and the density and pattern of interactions of people of different ages within each country. Estimates of the R0 value of the virus in each country at the start of the pandemic are sourced from a previously published method using the squire model.4 Using the base estimates of the infectivity for COVID-19 in each country, we estimate mortality rates under different scenarios where we temporarily modify the infectivity of the virus to represent the implementation of a social distancing policy in each country. We consider five scenarios:
the unmitigated spread of COVID-19, where the virus progresses through each country at a high level of infectivity;
the implementation of an ‘individual’ distancing policy, similar to the case of a country like Sweden where workplaces, schools and restaurants mostly remain open but large gatherings are discouraged, reducing infectivity by 15%;
a broad social distancing policy, equivalent to the closure of schools and workplaces, that reduces infectivity by 35%;
an even more intensive social distancing policy with targeted stay-at-home orders (‘social distancing+) that reduces infectivity by 50% and
full lockdown policies designed to entirely suppress social contact, closing transit and stay-at-home orders for the entire population, reducing infectivity by 60%.
In each of these scenarios we allow the policy to remain in effect for a duration of 40 days, representing the average duration of most lockdown and social distancing policies around the world, with Google mobility data indicating that mobility was significantly increased after 40 d from lockdown.5 After 40 d the simulated policy is lifted and the R0 of the virus returns to the country-specific estimated base level of infectivity it presented at the start of the pandemic. We have chosen a one-shot policy due to its relative simplicity. While rolling lockdowns have been proposed as an effective way of combating the spread of the coronavirus, we are sceptical as to the capacity of governments to repeatedly implement and terminate lockdown orders. In countries with limited state capacity, and the majority of the workforce in the informal sector, there are few policy tools to implement sophisticated partial lockdowns.
Our analysis includes 178 countries, which we aggregate according to their 2020 World Bank income classification: high-, upper-middle-, lower-middle- and low-income economies.6 Data on life expectancy for each age group is given by the World Health Organization Global Health Observatory.7 We run a grid search at a 5-d resolution to find the optimal timing for each social distancing and lockdown policy in each country. In this way we only consider the impact of optimally timed policies, as though a government could have foresight over the exact date on which to implement a policy and, as such, these represent a best-case scenario for policies designed to mitigate COVID-19.
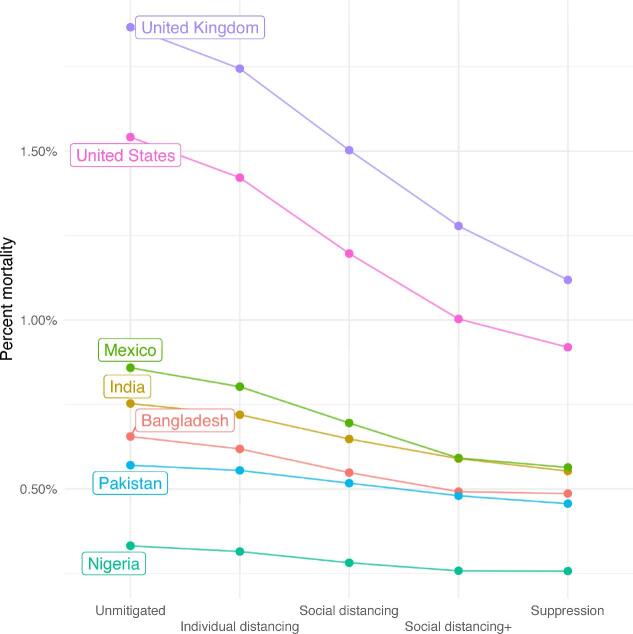
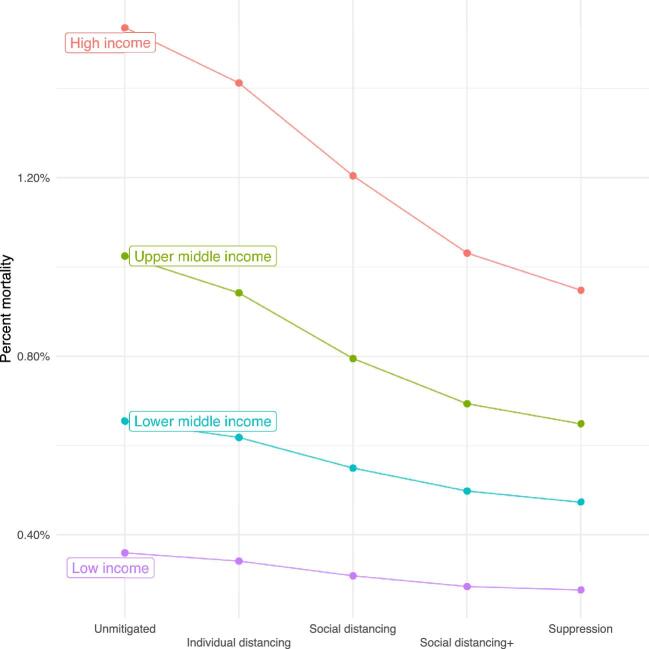
Figure 1 shows predicted mortality from the spread of COVID-19 for a set of countries. For higher-income countries like the UK and USA, the model predicts that the unmitigated spread of COVID-19 would lead to >1.5% of the population dying. In the same scenario in lower-income countries, such as Nigeria, Pakistan and Bangladesh, predicted mortality is approximately half that. Moreover, while mortality falls sharply in the USA and UK when social distancing measures are imposed, the change in mortality is far less responsive in lower-income countries. We aggregate total predicted mortality under each scenario by total population across all four income groups in Figure 2, finding that expected mortality is lower in lower-income countries despite their comparatively more limited healthcare systems.
Figure 1.
The total mortality risk from COVID-19 by country. Note: Point estimates of total COVID-19 population mortality in each country are derived from the squire model under increasing levels of policy intervention.
Figure 2.
Mortality risk by income group and intervention. Note: Point estimates of total COVID-19 population mortality are derived from the squire model under increasing levels of policy intervention, aggregated by World Bank income classification.
Demographic risk profiles
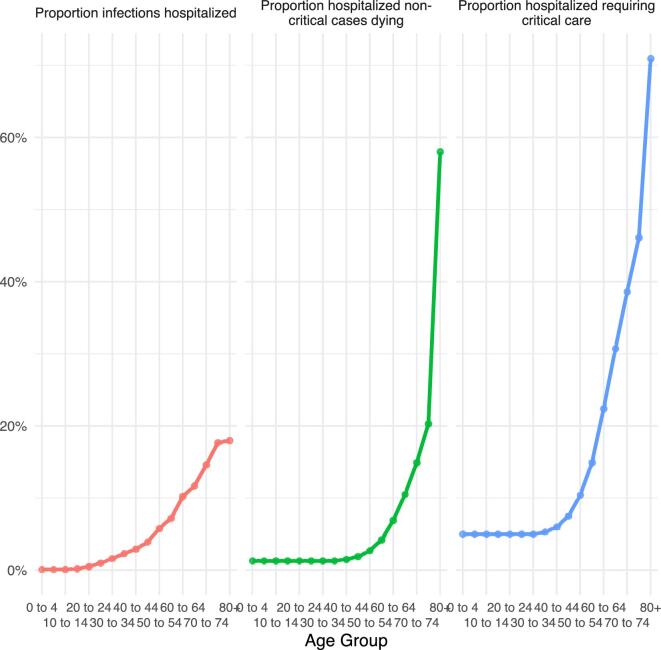
The primary cause of the divergent mortality risk from COVID-19 between countries of higher and lower income levels is their demographic structure. High-income countries tend to have lower fertility rates and older populations, while low-income countries tend to have higher fertility rates and younger populations. This is important because the mortality risk of COVID-19 varies considerably by age. Younger people appear to face relatively low mortality risk from the virus, and the mortality rate increases sharply among the elderly. Age-specific mortality parameter estimates are given in Figure 3. The proportion of cases requiring hospitalization increases with age, up to nearly 20% of the elderly, those ≥75 y of age. Of the patients hospitalized, a subset will require critical care, such as mechanical ventilation. We set a mortality rate of 50% across all ages for those requiring and receiving critical care and a mortality rate of 95% for those requiring but not receiving critical care. For patients hospitalized but not requiring critical care, the mortality rate is low for those <60 y of age, reaching nearly 60% among the elderly. For people who would require but cannot receive hospital care due to capacity constraints, their likelihood of dying doubles, up to a maximum of 90%.2,3
Figure 3.
Estimated risks of COVID-19 by age group. Note: Estimated risk of COVID-19 hospitalization and conditional mortality as given in Verity et al.2 The risk of hospitalization climbs dramatically with age and cases requiring hospitalization are assigned a separate mortality likelihood based on whether they require critical care.
A question that we cannot fully answer at this time is the likelihood of death for an infection that would require but does not receive hospital care. As there are currently no effective treatments for COVID-19, it is unclear whether non-critical cases are receiving lifesaving care in hospitals or whether the support they receive only increases their comfort without significantly modifying their likelihood of dying.1 We consider a range of parameters for excess mortality in the appendix, ‘Alternative excess mortality demand parameters’. A second concern is that the epidemiological model does not account for the higher burden of infectious diseases and chronic illness in low-income countries, particularly in children. If these factors negatively interact with COVID-19 this could lead to an underestimate of mortality in low-income countries.3,8
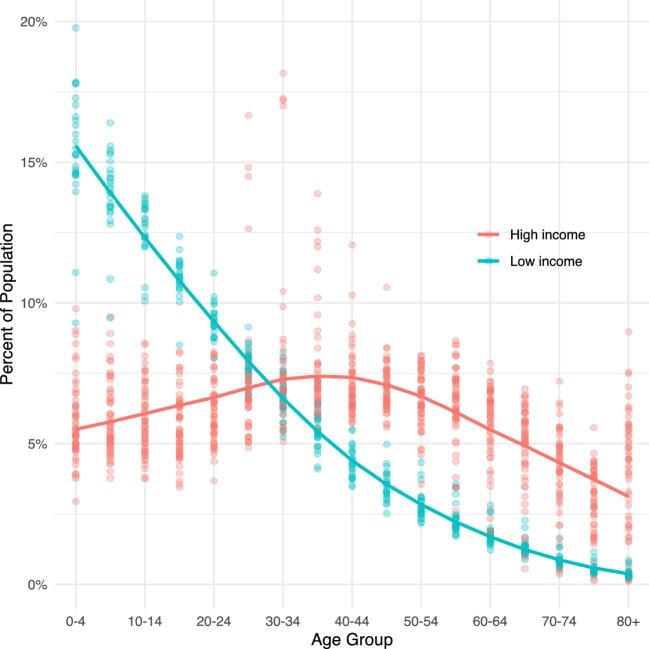
In Figure 4 we show the distribution of age groups in each population across countries that are classified as either high or low income. Each point represents the fraction of the population within that age range in a country. While the population structure in higher-income countries is more evenly distributed across the entire age range, the population in lower-income countries is heavily skewed younger. This skewness means that lower-income countries have a much smaller fraction of their population that is predicted to be hospitalized or die from COVID-19 if they contract the virus.
Figure 4.
Population distribution of high- and low-income countries. Note: Each point represents the fraction of the population in that age range for one country, with a smoothed line showing averages for countries that are classified as high or low income.
Medical system capacity
The spread of COVID-19 has threatened to overwhelm the medical system of many countries. One benefit of social distancing policies that reduce infectivity, flattening the curve of the disease's trajectory, is to spread the number of infections across a longer period of time, allowing more patients to be accommodated by existing infrastructure. In lower-income countries with more limited healthcare capacity—proxied by the number of hospital and intensive care unit (ICU) beds—it may be impossible to flatten the curve of COVID-19 sufficiently so that patient demand can be met.
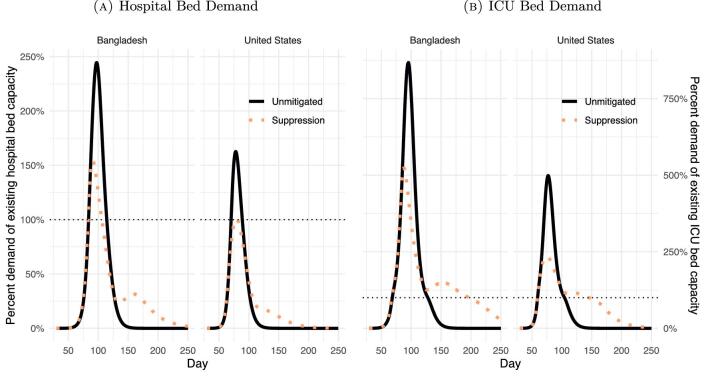
In Figure 5 we plot the estimated demand for healthcare under two scenarios as a percentage of existing capacity in a high- and low-income country, Bangladesh and the USA, respectively. The first scenario involves the unmitigated spread
Figure 5.
Healthcare demand in Bangladesh and the USA. Note: Hospital and ICU bed demand and capacity estimated using the squire model. The plots compare demand for healthcare resources in a scenario where there are no policy interventions and a scenario in which lockdown and suppression measures are enacted for a 40-d period.
of COVID-19 in both countries and the second involves the suppression scenario: intensive lockdown policies that reduce the virus infectivity by 60% for a period of 40 d. Assuming identically implemented and effective policies in both countries, suppression is effective at allowing existing US healthcare infrastructure to accommodate demand, while the healthcare infrastructure in Bangladesh is overwhelmed in either case. In Bangladesh, the unmitigated spread of COVID-19 leads to excess demand that peaks at nearly 250% of hospital bed capacity; under an intensive social distancing policy excess demand peaks at approximately 160%. In the USA, an identical policy would drop peak demand from 160% of capacity to approximately 100%. Suppression effectively brings hospital demand down to capacity in the USA, while in Bangladesh, demand would still exceed capacity by nearly 50% in the most stringent lockdown.
Increasing social distancing measures save an increasing number of lives, as shown in the projected mortality rates in Figures 1 and 2.9 We are interested in determining the relative value of distancing and lockdown measures in different countries. To do so we embed country-specific estimates of the welfare value of risk reduction, the value of a statistical life (VSL) and the value of a statistical life-year (VSLY), into our mortality predictions.10,11 This allows us to translate between the change in predicted mortality and the social welfare benefit this would provide each country.
It is important to emphasize that social distancing policies are a form of risk reduction. We can predict in expectation how many lives each policy may save, but we cannot know exactly which person will benefit. Social distancing is designed to limit the extent and rate of the spread of COVID-19 in each country, reducing aggregate mortality from the disease. To provide a valuation for this probabilistic reduction we use the VSL, a metric of the economic value of risk. The VSL is derived from studies of how individuals accept mortality risks, whether as a result of their occupation or from external environmental sources or disease, on a regular basis when appropriately compensated. Adding up the value that people assign to small changes in probabilistic risk provides an estimate of the monetary welfare value that people assign to saving one such statistical life. The VSL is in no way a measurement of the economic productivity that a person provides, but rather is based on how individuals themselves assign value to the risks they face.2
Results
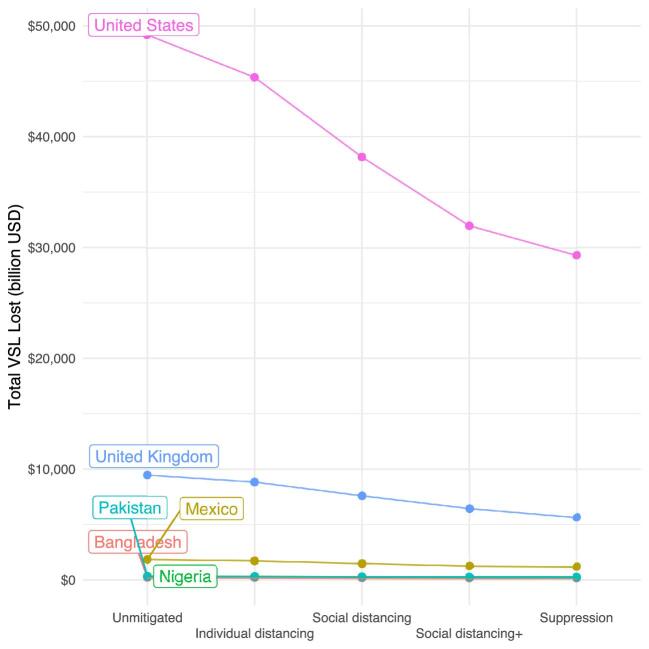
Figure 6 shows the estimated dollar value of total losses from deaths under each intervention scenario when the VSL estimates are embedded in the mortality predictions.10 The cost of leaving COVID-19 uncontrolled in the USA is unambiguously large. This is due to higher predicted mortality rates in the USA relative to other countries and the higher base VSL. In comparison with US losses, the dollar costs of uncontrolled COVID-19 in large countries such as Pakistan or Nigeria look minuscule. A more relevant question for any country-specific policy is the total cost of COVID-19 mortality under each scenario relative to that country's own gross domestic product (GDP).
Figure 6.
Value of the total statistical life (VSL) lost for each country. Note: Point estimates of total VSL lost for each country are derived by embedding the VSL from Viscusi and Masterman into the mortality predictions of the squire model under increasing levels of policy intervention. Data on GDP is given by the World Bank. The magnitude of the loss in the US reflects the high level of mortality as well as the high VSL.
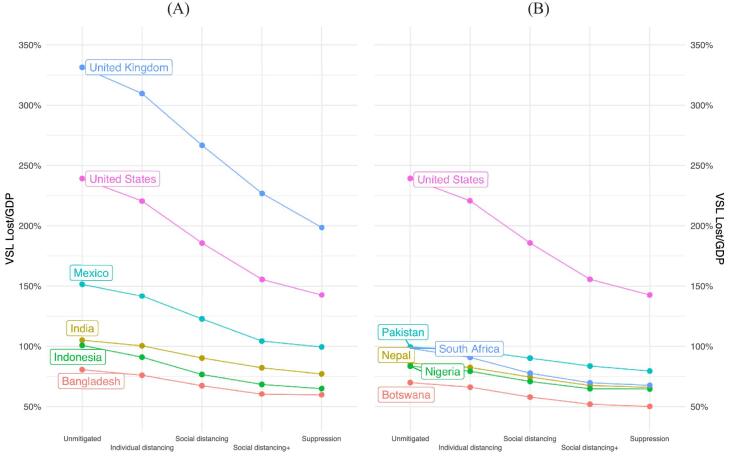
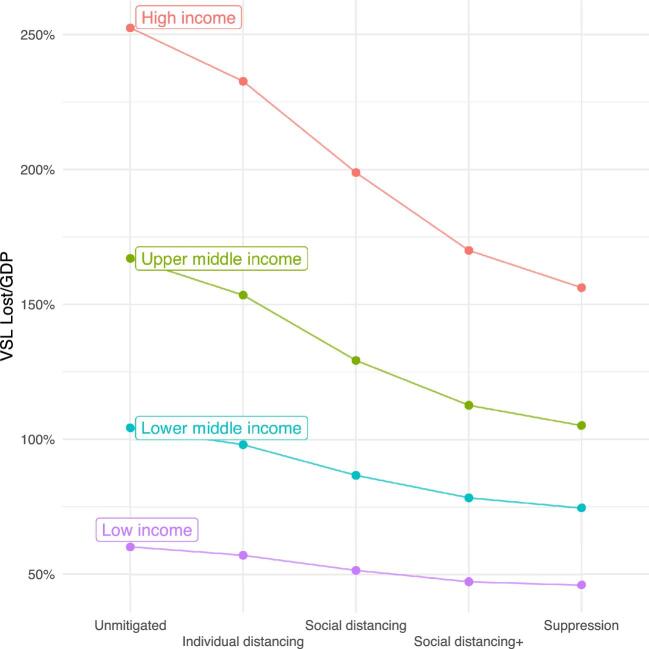
Figure 7 shows a comparison of the VSL lost by scenario and country as a fraction of GDP, with the USA benchmarking losses in high-income countries. Without mitigation efforts, COVID-19 imposes a large relative welfare cost in high-income countries—nearly 250% of the GDP of the USA. In contrast, in the unmitigated scenario, the losses in India, Bangladesh, Pakistan, Nigeria and Nepal are less than half as large in comparison, even when scaled against their own GDP. This pattern holds when total VSL lost over total GDP is aggregated by World Bank income group, shown in Figure 8.
Figure 7.
Relative value of statistical life (VSL) lost for each country. Note: Point estimates of relative VSL lost for each country are derived by embedding the VSL from Viscusi and Masterman into the mortality predictions of the squire model under increasing levels of policy intervention. Data on GDP is given by the World Bank. The USA is used as a benchmark for relative losses.
Figure 8.
Estimated value of COVID-19 intervention by income group. Note: Point estimates of the relative VSL lost for each country are derived by embedding the VSL from Viscusi and Masterman into the mortality predictions of the squire model under increasing levels of policy intervention. Data on GDP is given by the World Bank. These are totalled by World Bank income group designation over the combined World Bank estimate for that income group's total GDP.
The other lesson from Figure 7 is that moving from a policy of doing nothing to imposing social distancing yields a large welfare improvement in high-income countries. We show the estimated marginal value of an increasing social distancing policy in Table 1. The marginal value of imposing even minor individual distancing measures in high-income countries is large, approximately 22% and 19% of GDP in the UK and USA, respectively. An identical policy in Mexico yields a welfare benefit of approximately 10% of its GDP and 4.5% of GDP in Bangladesh. Moving from a policy of individual distancing to one of full social distancing policy, decreasing the infectivity of COVID-19 to 35% of its base value for a period of 40 d, yields a welfare value increase equivalent to 43% of the UK's annual GDP and 35% in the USA. The same increase in policy stance in India yields a welfare increase equivalent to 10% of its GDP and 9% of its GDP in Bangladesh. Increasing social distancing measures yield significant welfare improvement in higher-income countries; in lower-income countries this value declines quickly. The non-monotonicity in welfare improvement for some countries moving from social distancing+ to suppression is due to a larger second wave of the virus: reducing transmission by too much too quickly can lead to even more deaths than a less stringent policy. A strict lockdown may merely end up shifting the peak of the virus a month into the future without significantly reducing overall mortality.
Table 1.
Marginal value of COVID-19 interventions (ΔVSL/GDP)
| Income group | |||||||||
|---|---|---|---|---|---|---|---|---|---|
| High | Upper-middle | Lower-middle | Low | ||||||
| Strategy | UK | USA | Mexico | South Africa | India | Bangladesh | Pakistan | Nigeria | Nepal |
| Unmitigated | – | – | – | – | – | – | – | – | – |
| Individual distancing | 21.7 | 18.6 | 9.8 | 7.5 | 4.6 | 4.5 | 2.7 | 4.2 | 3.7 |
| Social distancing | 42.9 | 34.8 | 19.0 | 13.0 | 10.0 | 8.6 | 6.6 | 8.4 | 7.9 |
| Social distancing+ | 39.8 | 30.1 | 18.3 | 7.9 | 8.1 | 7.0 | 6.5 | 6.0 | 7.0 |
| Suppression | 28.3 | 13.0 | 4.9 | 2.1 | 5.2 | 0.7 | 4.1 | 0.2 | 1.5 |
VSLY
The VSL is most appropriately used to assign value to mortality risk reduction when the benefits are spread across a population. In the case of COVID-19, however, the majority of risk reduction is concentrated among the elderly. As shown in Figure 3, the risk of hospitalization and dying from coronavirus increases sharply with age. If social distancing and lockdown policies reduce mortality risk differentially across age groups, we may wish to account for the number of expected life years saved under any policy. This is not to privilege saving young versus old lives, but rather to provide a more granular metric by which to estimate the welfare value of risk reduction.
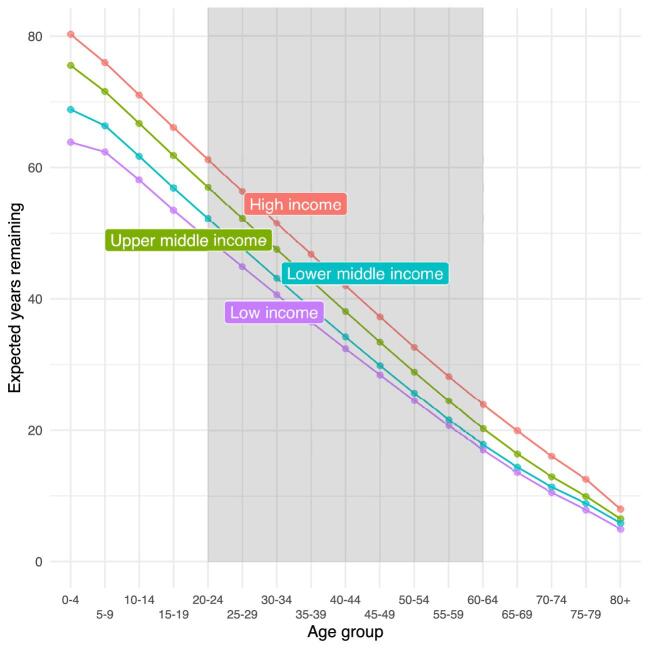
The VSLY is derived by dividing the country-specific population-averaged VSL by the life expectancy of a working-age person, someone between the ages of 20 and 64 y.11 Population averaged life expectancy for each income group is shown in Figure 9, with working ages of 20–64 y shaded in grey. We see that life expectancy declines linearly with age and there is a clear separation in life expectancy at all ages between income groups.
Figure 9.
Population averaged life expectancy by income group classification. Note: Population-weighted average life expectancy at each age by World Bank income classification. Data on life expectancy for each age group are provided by the World Health Organization Global Health Observatory. Working ages for VSLY are 20–60 y (shaded in grey). Expected years remaining is higher in higher-income countries at all ages, although the difference narrows for the elderly.
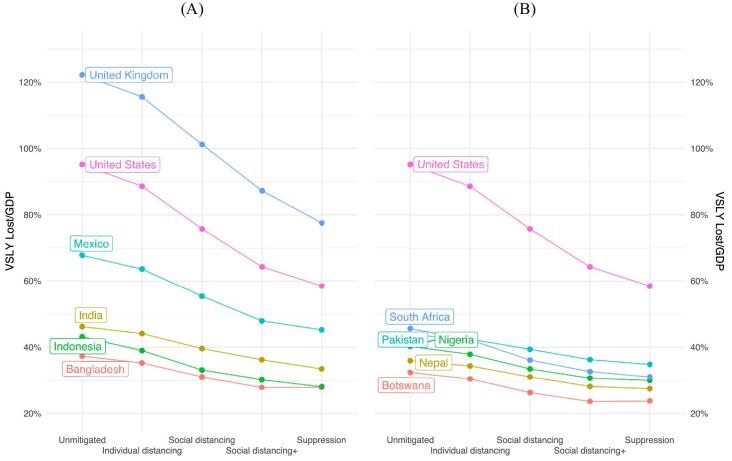
In Figure 10 we reproduce our analysis of the relative VSL lost in each country given in Figure 7 using VSLY. Continuing to use the USA as the benchmark for high-income countries, we see that the value of social distancing remains significantly higher in higher-income countries. However, there is a pronounced shift in the welfare value of social distancing when the mortality risk reduction is measured using the VSL (Figure 7) or the VSLY (Figure 10). Accounting for the risk profile of COVID-19—where the majority of risk reduction is accrued by the elderly—means that there are relatively few years saved in expectation by lockdown and suppression policies. Accordingly, this metric provides a significantly lower estimation of the welfare value of interventions that reduce the risk of COVID-19.
Figure 10.
Relative value of statistical life years (VSLY) lost for each country. Note: Point estimates of the relative VSLY lost for each country are derived by embedding the VSL from Viscusi and Masterman and estimates of life expectancy from the World Health Organization into the mortality predictions of the squire model under increasing levels of policy intervention. Data on GDP is given by the World Bank. The USA is used as a benchmark for relative losses.
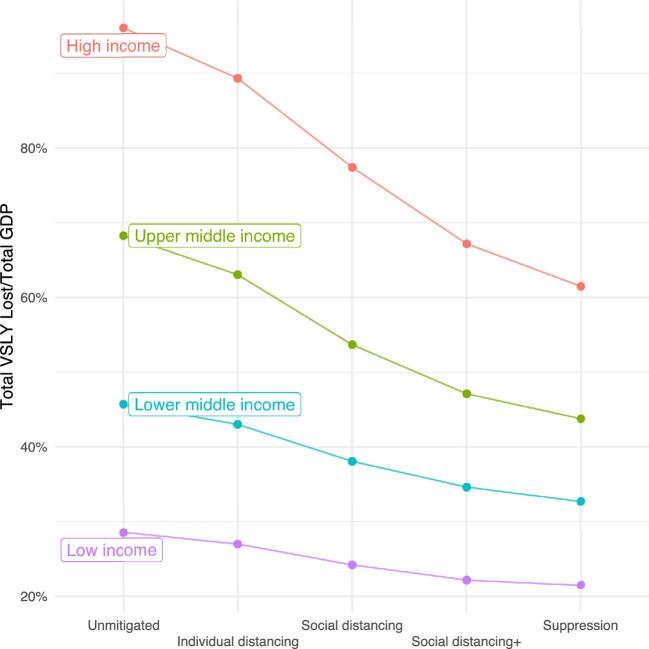
The marginal value of an increasing policy stance remains small in lower-income countries. While we estimate social distancing to provide a welfare value equivalent to approximately 20% of GDP in countries like the UK and USA, an identical policy produces a welfare gain of <10% in lower-middle- and low-income countries, as shown in Figure 11 and Table 2. Using the VSLY instead of the VSL corroborates our conclusion that the value of social distancing and other measures to suppress COVID-19 is unequally distributed between higher- and lower-income countries.
Figure 11.
Relative value of statistical life years (VSLY) lost by income group. Note: Point estimates of the relative VSLY lost for each country are derived by embedding the VSL from Viscusi and Masterman and estimates of life expectancy from the World Health Organization into the mortality predictions of the squire model under increasing levels of policy intervention. Data on GDP is given by the World Bank. These are totalled by the World Bank income group designation over the combined World Bank estimate for that income group's total GDP.
Table 2.
Marginal value of COVID-19 Interventions (ΔVSLY/GDP)
| Income group | |||||||||
|---|---|---|---|---|---|---|---|---|---|
| High | Upper-middle | Lower-middle | Low | ||||||
| Strategy | UK | USA | Mexico | South Africa | India | Bangladesh | Pakistan | Nigeria | Nepal |
| Unmitigated | – | – | – | – | – | – | – | – | – |
| Individual distancing | 6.7 | 6.6 | 4.2 | 3.4 | 2.1 | 2.1 | 1.2 | 2.4 | 1.6 |
| Social distancing | 14.3 | 12.8 | 8.3 | 6.1 | 4.5 | 4.2 | 3.1 | 4.4 | 3.3 |
| Social distancing+ | 13.9 | 11.4 | 7.5 | 3.5 | 3.4 | 3.1 | 3.1 | 2.8 | 2.9 |
| Suppression | 9.7 | 5.8 | 2.7 | 1.6 | 2.8 | 0.0 | 1.5 | 0.7 | 0.7 |
Beyond the level shift when evaluating the value of social distancing policies in high- and low- income countries, our conclusion about the relative value of these interventions remains the same. There is a steep welfare gradient for high-income countries implementing increasingly suppressive measures. We estimate a much smaller marginal value for each intervention for lower-income countries, where lower life expectancies mean that identical measures save fewer years.
Discussion
Underpinning the relatively modest estimated value of mitigation and suppression policies in lower- income countries are three critical factors. First, in low-income countries there are proportionally more young people, who face lower risks from COVID-19. Second, the relatively low hospital and ICU capacity at baseline in lower-income countries means that flattening the mortality curve is unlikely to be sufficient to prevent hospitals from being overwhelmed. Third, the economic opportunity cost of social distancing is larger in lower-income countries and therefore the VSL is lower. Simply put, rich people can more easily meet their basic needs while social distancing, while a poor person may need to prioritize income-generating opportunities to put food on the family's table.
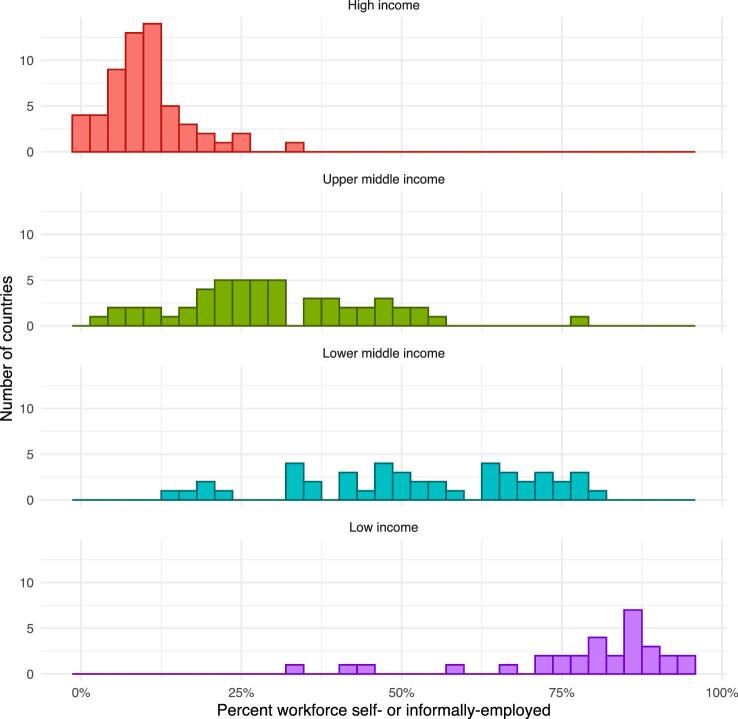
Workers in low-income countries are also more vulnerable to disruption of the economy. These workers are more likely to rely on a daily cash wage and work in occupations that cannot be done while social distancing. Figure 12 shows the distribution of the percentage of workers either self- or informally employed. Such workers do not always appear in government and bureaucratic records. So even if a social insurance policy were implemented in these countries, it is uncertain how quickly such people could be located, if at all, to deliver relief benefits to them.
Figure 12.
Distribution of self- or informally employed workforce by income group. Note: Estimated fraction of workforce in each country that is either self-employed or employed in the informal sector. The fraction of the workforce in the formal sector increases with income level. Data are given by the World Bank indicator SL.EMP.VULN.ZS.
The social distancing and suppression interventions pioneered in Wuhan, China and enacted throughout Europe and the USA have relied on government support systems. Many workers throughout Europe received their salaries and many US taxpayers received stimulus checks. In contrast, efforts by the Indian government to impose a lock-down appear to have had significant negative consequences for the most vulnerable members of its population. Interviews with workers from the informal sector tell a story of impending poverty, evictions and hunger, as their incomes and work opportunities have been curtailed. Migrant labourers in India's largest cities having lost access to employment due to the lockdown, were without food or shelter. Many were forced to walk back to their homes with deaths reported along the way.3
The COVID-19 pandemic represents a serious threat in every country. A policy response is necessary, but the benefits of each policy must be carefully weighed against the economic cost and risks imposed on that society. The most widely cited model of COVID-19 transmission and mortality indicates that based on our present understanding of the disease, we should expect fewer deaths in low-income countries under a range of policy scenarios.8 Much of this result is based on differences in the age distribution across countries, because our present understanding is that COVID-19 mortality risk increases dramatically with age. It is uncertain whether this relationship will remain robust in lower-income countries where younger people have higher rates of certain chronic illnesses and endemic diseases. Given the later start date of epidemics in lower-income countries, extensive data characterising the interaction between COVID-19 and these comorbidities is lacking. Current research suggests that comorbidities such as obesity, diabetes and chronic obstructive pulmonary disease may lead to increased severity of the coronavirus.17–19 Equally concerning is the disruption to the routine care that lockdown orders present to the management of these other diseases in lower-income countries; childhood immunizations, malaria and human immunodeficiency virus programmes have all been substantially disrupted.20–22 Therefore, lower-income countries may see higher levels of mortality from the lack of treatment and management of other endemic diseases in the case of widespread social distancing and lockdowns. Given the deeper concerns about the risks that economic shutdowns pose on the most vulnerable members of low-income societies,23 it remains unclear whether the value of the most stringent suppression policies in low-income countries outweighs the uncertain economic costs.
We know that workers in low-income countries are younger and less likely to develop a severe infection due to COVID-19. We know that workers are also more vulnerable to economic disruption and may be unable to adhere to lockdown orders. Various government and non-governmental organizations are currently playing an important role to avert outright starvation during the pandemic by providing free meals, food supplies and fuel to poor households. Supply chains within countries have been disrupted by lockdown measures, making it increasingly difficult to deliver food.24 Indeed, the example of the severe but ineffective lockdown in India demonstrates our concern about the capacity of states to enforce suppression strategies and that imperfect compliance may lead to an increase in transmission to other vulnerable populations.25
Supplementary Material
Acknowledgements
This work has benefited from the comments and suggestions of two anonymous reviewers. All errors are our own.
Footnotes
1We discussed the change in mortality for severe cases of COVID-19 conditional on the availability of hospital resources extensively with doctors working in hospitals in the UK, USA, Brazil, Ethiopia, Nigeria and Bangladesh. The doctors emphasized the difficulty of even defining which cases needed to be hospitalized, as well as the difficulty of understanding how hospital treatment improved survival.
2One way of understanding the VSL is through a recent strike by Instacart workers in the USA during this pandemic, who were demanding an additional $5 in hazard pay per order as compensation for their increased exposure to the disease.12
3See Abi-Habib and Yasir,13,14 BBC15 and Tewari.16 Abi-Habib and Yasir14 quote one migrant labourer saying: ‘You fear the disease, living on the streets. But I fear hunger more, not corona’. Another migrant construction worker is quoted as saying: ‘I earn 600 rupees every day and I have five people to feed. We will run out of food in a few days. I know the risk of coronavirus, but I can't see my children hungry’.15
Contributor Information
Zachary Barnett-Howell, Yale University and Y-RISE, New Haven, CT, USA.
Oliver John Watson, MRC Centre for Global Infectious Disease Analysis, Department of Infectious Disease Epidemiology, School of Public Health, Imperial College London, London, UK.
Ahmed Mushfiq Mobarak, Yale University, Deakin University, Y-RISE, NBER, CEPR, and IGC.
Authors’ contributions
ZBH and AMM conceived and designed the study. ZBH and OJW were responsible for formal analysis and interpretation of data. ZBH was responsible for writing the original draft. All authors have read and agreed to the published version of the article.
Funding
OJW received funding from the UK Foreign Commonwealth and Development Office.
Competing interests
None declared.
Ethical approval
Not required. No human subjects data was used.
Data availability
The data underlying this article are available from the listed sources. Code is available upon request.
References
- 1. Ferguson NM, Laydon D, Nedjati-Gilani G et al. Impact of non-pharmaceutical interventions (NPIs) to reduce COVID-19 mortality and healthcare demand. London: Imperial College London, 2020. Available from 10.25561/77482 (accessed 17 December 2020). [DOI] [PMC free article] [PubMed] [Google Scholar]
- 2. Verity R, Okell LC, Dorigatti I et al. Estimates of the severity of coronavirus disease 2019: a model-based analysis. Lancet Infect Dis. 2020;20(6):669–77. [DOI] [PMC free article] [PubMed] [Google Scholar]
- 3. Watson OJ, Walker P, Whittaker C et al. squire version 0.4.34. Available from: https://mrc-ide.github.io/squire/index.html (accessed 17 December 2020).
- 4. Tan-Torres Edejer T, Hanssen O, Mirelman A et al. Projected health-care resource needs for an effective response to COVID-19 in 73 low-income and middle-income countries: a modelling study. Lancet Global Health. 2020;8(11):E1372–9. [DOI] [PMC free article] [PubMed] [Google Scholar]
- 5. COVID-19 community mobility reports. Available from: https://www.google.com/covid19/mobility/ (accessed 17 December 2020).
- 6. World Bank . World Bank country and lending groups. Available from: https://datahelpdesk.worldbank.org/knowledgebase/articles/906519-world-bank-country-and-lending- groups (accessed 19 May 2020).
- 7. World Health Organization . Life tables by country. Available from: https://apps.who.int/gho/data/node.main.LIFECOUNTRY?lang=en (accessed 19 May 2020). [Google Scholar]
- 8. Walker PGT, Whittaker C, Watson OJ et al. The impact of COVID-19 and strategies for mitigation and suppression in low- and middle-income countries. Science 2020;369(6502):413–22. [DOI] [PMC free article] [PubMed] [Google Scholar]
- 9. Flaxman S, Mishra S, Gandy A et al. Estimating the number of infections and the impact of non-pharmaceutical interventions on COVID-19 in European countries: technical description update. arXiv:2004.11342. Available from: https://arxiv.org/abs/2004.11342 (accessed 17 December 2020).
- 10. Kip Viscusi W, Masterman CJ. Income elasticities and global values of a statistical life. J Benefit Cost Anal. 2017;8(2):226–50. [Google Scholar]
- 11. Robinson LA, Hammitt JK, O'Keeffe L. Valuing mortality risk reductions in global benefit-cost analysis. J Benefit Cost Anal. 2019;10(S1):15–50. [DOI] [PMC free article] [PubMed] [Google Scholar]
- 12. Olson A, Anderson M. Some Instacart, Amazon workers strike as jobs get riskier. Washington Post, 31 March 2020. Available from: https://apnews.com/article/cf27e9bec86d846447aad7e632484bea (accessed 3 April 2020). [Google Scholar]
- 13. Abi-Habib M, Yasir S. For India's laborers, coronavirus lockdown is an order to starve. New York Times, 30 March 2020. Available from: https://nyti.ms/2JrIPEU (accessed 31 March 2020).
- 14. Abi-Habib M, Yasir S. India's coronavirus lockdown leaves vast numbers stranded and hungry. New York Times, 29 March 2020. Available from: https://www.nytimes.com/2020/03/29/world/asia/coronavirus-india-migrants.html (accessed 31 March 2020).
- 15. BBC . India's poorest ‘fear hunger may kill us before coronavirus’. BBC News, 25 March 2020. Available from: https://www.bbc.com/news/world-asia-india-52002734 (accessed 2 April 2020).
- 16. Tewari A. The Delhi exodus: what we failed to learn from 1889 and 1900. The Indian Express, 31 March 2020. Available from: https://indianexpress.com/article/opinion/the-delhi-exodus-what-we-failed-to-learn-from-1889-and-1900-coronavirus-india-lockdown-6340334/ (accessed 31 March 2020).
- 17. Alqahtani JS, Oyelade T, Aldhahir AM et al. Prevalence, severity and mortality associated with COPD and smoking in patients with COVID-19: a rapid systematic review and meta-analysis. PLoS One. 2020;15(5):e0233147. [DOI] [PMC free article] [PubMed] [Google Scholar]
- 18. Richardson S, Hirsch JS, Narasimhan M et al. Presenting characteristics, comorbidities, and outcomes among 5700 patients hospitalized with COVID-19 in the New York City area. JAMA. 2020;323(20):2052–9. [DOI] [PMC free article] [PubMed] [Google Scholar]
- 19. Tartof SY, Qian L, Hong V et al. Obesity and mortality among patients diagnosed with COVID-19: results from an integrated health care organization. Ann Intern Med. 2020;173(10):773–81. [DOI] [PMC free article] [PubMed] [Google Scholar]
- 20. Abbas K, Procter SR, van Zandvoort K et al. Routine childhood immunisation during the COVID-19 pandemic in Africa: a benefit–risk analysis of health benefits versus excess risk of SARS-CoV-2 infection. Lancet Global Health. 2020;8(10):e1264–72. [DOI] [PMC free article] [PubMed] [Google Scholar]
- 21. Hogan AB, Jewell BL, Sherrard-Smith E et al. Potential impact of the COVID-19 pandemic on HIV, tuberculosis, and malaria in low-income and middle-income countries: a modelling study. Lancet Global Health. 2020;8(9):e1132–41. [DOI] [PMC free article] [PubMed] [Google Scholar]
- 22. Sherrard-Smith E, Hogan AB, Hamlet A et al. The potential public health consequences of COVID-19 on malaria in Africa. Nat Med. 2020;26(9):1411–6. [DOI] [PMC free article] [PubMed] [Google Scholar]
- 23. Saleh A, Cash RA. Masks and handwashing vs. physical distancing: do we really have evidence-based answers for policymakers in resource-limited settings? Available from: https://www.cgdev.org/blog/masks-handwashing-vs-physical-distancing-do-we-really-have-evidence-based-answers (accessed 17 December 2020).
- 24. Purohit K. India COVID-19 lockdown means no food or work for rural poor. Available from: https://www.aljazeera.com/news/2020/04/india-covid-19-lockdown-means-food-work-rural-poor-200402052048439.html (accessed 5 April 2020).
- 25. Agrawal P. COVID-19 lockdown: Bihar migrants who fled cities face ostracism at home. Available from: https://scroll.in/article/958010/covid-19-lockdown-bihar-migrants-who-fled-cities-face-ostracism-at-home (accessed 3 April 2020).
Associated Data
This section collects any data citations, data availability statements, or supplementary materials included in this article.
Supplementary Materials
Data Availability Statement
The data underlying this article are available from the listed sources. Code is available upon request.


