Abstract
Aims
Cardiovascular diseases (CVDs) increase mortality risk from coronavirus infection (COVID-19). There are also concerns that the pandemic has affected supply and demand of acute cardiovascular care. We estimated excess mortality in specific CVDs, both ‘direct’, through infection, and ‘indirect’, through changes in healthcare.
Methods and results
We used (i) national mortality data for England and Wales to investigate trends in non-COVID-19 and CVD excess deaths; (ii) routine data from hospitals in England (n = 2), Italy (n = 1), and China (n = 5) to assess indirect pandemic effects on referral, diagnosis, and treatment services for CVD; and (iii) population-based electronic health records from 3 862 012 individuals in England to investigate pre- and post-COVID-19 mortality for people with incident and prevalent CVD. We incorporated pre-COVID-19 risk (by age, sex, and comorbidities), estimated population COVID-19 prevalence, and estimated relative risk (RR) of mortality in those with CVD and COVID-19 compared with CVD and non-infected (RR: 1.2, 1.5, 2.0, and 3.0).
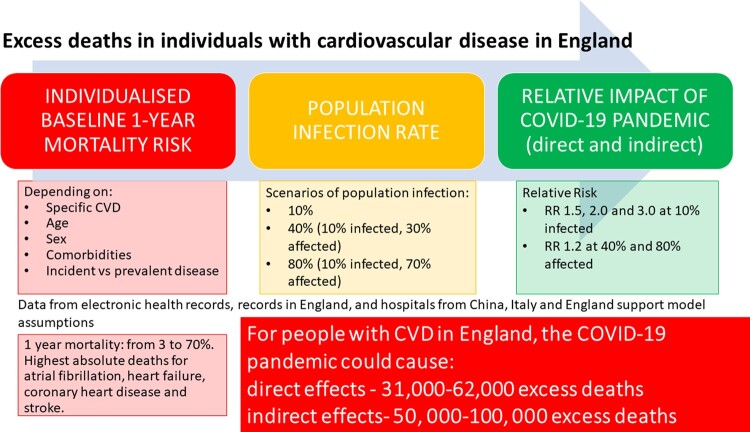
Mortality data suggest indirect effects on CVD will be delayed rather than contemporaneous (peak RR 1.14). CVD service activity decreased by 60–100% compared with pre-pandemic levels in eight hospitals across China, Italy, and England. In China, activity remained below pre-COVID-19 levels for 2–3 months even after easing lockdown and is still reduced in Italy and England. For total CVD (incident and prevalent), at 10% COVID-19 prevalence, we estimated direct impact of 31 205 and 62 410 excess deaths in England (RR 1.5 and 2.0, respectively), and indirect effect of 49 932 to 99 865 deaths.
Conclusion
Supply and demand for CVD services have dramatically reduced across countries with potential for substantial, but avoidable, excess mortality during and after the pandemic.
Keywords: Cardiovascular disease, Coronavirus-2019, Public health, Global health, Health policy
Graphical Abstract
Graphical Abstract.
Introduction
Coronavirus disease 2019 (COVID-19) has had unplanned consequences for non-COVID-19 health services. We described reductions in urgent cancer referrals and chemotherapy compared to pre-COVID-19 levels.1 Decreases in presentation and treatment of myocardial infarction (MI)2–4 in Italy and the USA suggest effects on care, but services have not been studied across specific Cardiovascular diseases (CVDs), countries or different phases of the pandemic.
Early reports from Wuhan, China, demonstrated high prevalence of and mortality from COVID-19 in individuals with CVD; confirmed across countries, particularly with coronary heart disease (CHD) and heart failure (HF).5–8 UK government policy for ‘physical distancing’ in high-risk subgroups for COVID-19, announced on 16 March 2020, included CVD, especially HF.9 On 22 March 2020, a further 1.5 million people in England (with ‘extremely vulnerable’ conditions) were recommended at least 12 weeks of ‘shielding’,10 excluding those with CVD, prior to UK lockdown on 23 March.11 Better understanding of pre- and post-COVID-19 mortality risk across specific CVDs may help decisions and policies regarding physical isolation.
Therefore, effects of COVID-19 on individuals and health systems are: (i) direct due to infection, and (ii) indirect due to unprecedented system strain and associated behaviour changes.12 Those with CVD, carrying the greatest burden of global morbidity and mortality,13 are likely to be particularly affected. Beyond direct effects, systematic examination of recent and longer-term trends for CVD services may help in planning the timing and nature of exit from lockdown and strategies for any subsequent infection peaks. Moreover, reductions in rates of referral, diagnosis, and treatment, may have fatal long-term consequences, caused by ‘supply’ (e.g. lower healthcare availability) and/or ‘demand’ (e.g. delayed presentation), but have not been investigated. Electronic health records (EHRs) have been used in studies across different specific CVDs,14 and enable novel insights regarding direct and indirect COVID-19-related excess deaths, across incident and prevalent CVD, and the spectrum of care.
Objective
We used: (i) national mortality data for England and Wales to investigate trends in non-COVID-19 and CVD excess deaths; (ii) routine data from hospitals in England, Italy, and China to assess indirect effects on services for referral, diagnosis, and treatment of CVD during the pandemic; and (iii) population-based EHR in England to investigate pre- and post-COVID-19 mortality by underlying risk factors for people with incident and prevalent CVD.
Methods
Weekly information on CVD mortality and emergency attendances in England and Wales
We obtained weekly cause-specific mortality data (all-cause, COVID, non-COVID, CVD) for England and Wales from ONS15 and cardiac-related attendance data from the Emergency Department (ED) Syndromic Surveillance System for England.16
Monthly referral, diagnosis, and treatment data for CVD across countries
We obtained data from hospitals in the UK (n = 2; University College London NHS Trust, and King’s College Hospital London NHS Foundation Trust); China (n = 5; Wuhan Union Hospital, Zaoyang First Hospital, Xiangyang First Hospital, Xiantao People’s Hospital, Tianmen First Hospital); and Italy (n = 1; Ospedale Santa Maria delle Croci, Ravenna). For all data, weekly or monthly relative risks (RRs) were calculated, compared with pre-lockdown (3 January). Further details of data and RR calculations are given in the Supplementary material online, Methods.
Population-based EHR in England to estimate pre- and post-COVID mortality
To estimate pre-COVID-19 incidence and mortality in individuals with CVD and comorbidities, we used EHR across primary care (Clinical Practice Research Datalink, CPRD-GOLD), hospital care (Hospital Episodes Statistics, HES), and death registry (Office of National Statistics, ONS) with prospective recording and follow-up; linked by CPRD and NHS Digital using unique healthcare identifiers.17 Over 99% of England’s population is registered with general practice (GP). CPRD is representative by socio-demography, ethnicity, and overall mortality.18 Eligible individuals were aged ≥30 years, registered with a GP between 1 January 1997 and 1 January 2017 with ≥1 year of follow-up. Study entry was 1 year following latest GP registration for each individual, to more completely capture past medical history. The baseline date for each patient was the latest of the following: their registration at their general practice, their general practice ‘up-to-standard’ (UTS) date or their 30th birthday.
Open-access electronic health record phenotypes
We defined non-fatal (alive for ≥30 days post-diagnosis) CVD using 16 previously validated CALIBER phenotypes: stable angina, unstable angina, MI, CHD unspecified, HF, cardiac arrest, transient ischaemic attack, ischaemic stroke, stroke unspecified, intracerebral haemorrhage, subarachnoid haemorrhage, peripheral arterial disease, atrial fibrillation (AF), abdominal aortic aneurysm, deep vein thrombosis (DVT), and pulmonary embolism (PE), as per prior studies.14,17,18 We included DVT and PE due to clinical importance of venous thromboembolism in COVID-19.19 CVD was defined by first CVD record in the study period. Incident and prevalent disease were with no prior CVD history, and first CVD history, respectively. Validated phenotype definitions of diseases and COVID-19-relevant conditions (https://caliberresearch.org/portal)14,17,18 were generated from hospital and primary care data, using Read clinical terminology (version 2).
We defined 15 comorbidities or comorbidity clusters involving 40 individual conditions associated with poor COVID-19 outcomes by UK government guidance.9,10 Further details are in Supplementary material online, Methods. Multimorbidity was co-occurrence of ≥2 of these conditions.20
Estimating incidence rates and pre-COVID-19 1-year mortality
We estimated incidence rates per 100 000 person-years and pre-COVID-19 1-year mortality risk for incident and prevalent CVD using Kaplan–Meier analyses stratified by specific CVD and number of (non-CVD) comorbidities (0, 1, 2, and 3+), scaling up from CALIBER (3.8 million individuals) to the whole population of England aged 30+, consisting of 35 407 313 individuals (using 2018 estimates of overall population size and mortality21).
Estimating 1-year direct and indirect excess COVID-19 deaths
Excess deaths were considered direct (due to or with COVID-19 infection) or indirect (due to changes in health services). Direct excess deaths were estimated by applying RRs of 1.2, 1.5, 2, and 3 (compared with pre-COVID-19 mortality rate), based on published hazard ratios for CVD and COVID-19 deaths,8,22,23 in the absence of CVD cohort studies investigating all-cause mortality in those with and without infection. We modelled 10% infection rate based on recent seroprevalence estimates,24–25 and included 40% and 80% infection rates, to reflect possible future scenarios as the pandemic progresses. Although infection rate will change depending on pandemic phase, we assumed infection rate over 1 year in line with the first wave.
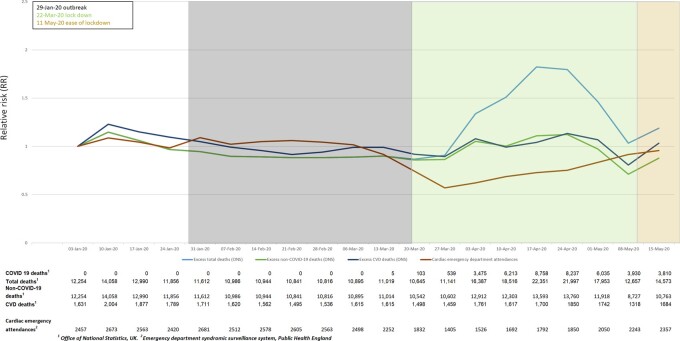
Based on RRs from ONS data, comparing with the same week average over the last 5 years [peak RR 1.14, 95% confidence interval (CI) 1.12–1.16 for excess CVD deaths and 1.32, 95% CI 1.31–1.33 for excess non-COVID-19 deaths; Figure 1] and likely longer-term effects on CVD mortality, we estimated direct and indirect excess deaths together by applying RR 1.2–40% (10% infected, 30% affected) and 80% (10% infected, 70% affected) of the population, respectively. These indirect effects are plausible, given service changes in CVD observed across countries,2–4 Thus, we provide low (infection rate 10% and no indirect effect at RR 1.5, 2.0 and 3.0), medium (infection rate 10% and 30% indirectly affected at RR 1.2), and high estimates (infection rate 10% and 70% indirectly affected at RR 1.2) of excess deaths, projecting to the whole English population (2018: 35 407 313 individuals aged ≥30).21 All analyses were performed using R (version 3.4.3).
Figure 1.
Weekly national data for excess total, non-COVID and cardiovascular deaths in England and Wales, and emergency department cardiac attendances for England: relative risks.
Results
Weekly information on CVD mortality and emergency attendances in England and Wales
Non-COVID-19 and CVD-related deaths in England and Wales increased in the same chronology as total (including COVID-19) deaths until mid-May 2020 (compared with the same week over the last 5 years). The peak observed RR for CVD deaths was in the week ending 24 April (1850 vs. 1626 deaths, RR 1.14) and the lowest in the week ending 8 May 2020 (1318 vs. 1487 deaths, RR 0.89). The same trend was present regardless of whether the RR was calculated compared to the average of previous years, or pre-COVID-19 (3 January 2020). Between 6 and 27 March, cardiac ED attendances decreased in England (minimum RR 0.57) and were had not fully recovered on 15 May, which was after easing of lockdown (Figure 1).
Monthly referral, diagnosis, and treatment data for CVD across countries
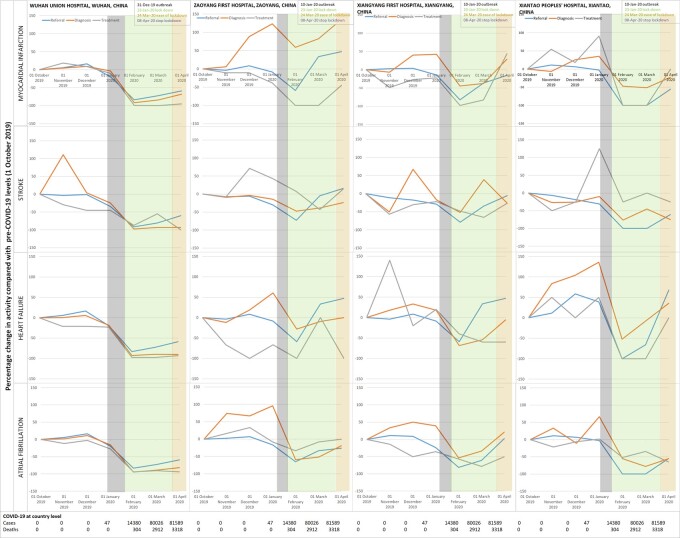
In China (both Wuhan and other hospitals) and Italy, activity (referral, diagnosis, and treatment) was significantly reduced compared with pre-COVID levels. In Wuhan, there was 83.4% reduction in referral, 92% in diagnosis and 99% in treatment levels of MI by the 1 February, a month after the outbreak started. Corresponding decreases were 92%, 97%, and 87% for stroke; 83%, 93%, and 98% for HF; and 83%, 95%, and 94% for AF. Tianmen and Xiantao demonstrated equivalent decreases across all four disease services. Although decreases were relatively less in Zaoyang and Xiangtang, there were 40–80% reductions across services, except for diagnosis of MI which increased in Zaoyang between January and March.
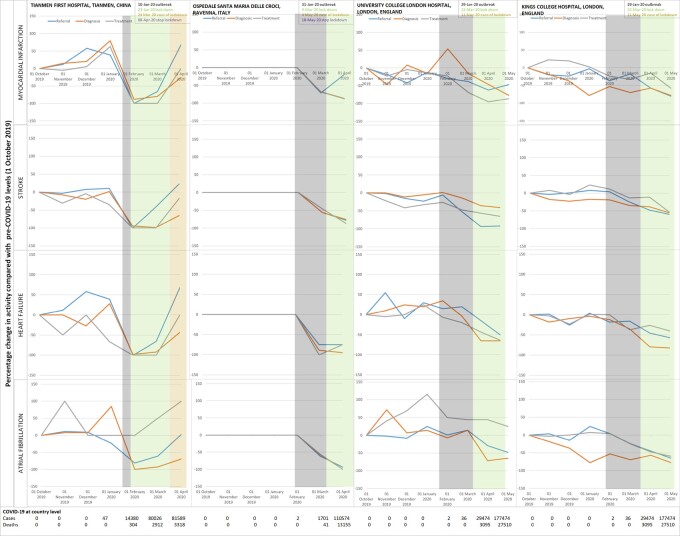
Even after easing and stopping of lockdown, Wuhan reported 50–100% decreases in services for MI, stroke, HF, and AF. In other Chinese hospitals, activity had mostly returned to pre-COVID levels by April 2020. Recovery of activity began to occur during the lockdown period and differed across Chinese hospitals, suggesting possible differences in infection rates, patient presentation and behaviour, clinician behaviour and COVID-19-related system strain. In Italy, decreases ranged from 45% for stroke treatment to 94% for HF treatment and 100% for AF diagnosis. In England, there was reduced activity across CVDs during the pandemic. Services in Italy and England had not reached pre-COVID levels even by the easing of lockdown. Across countries, referral rates for all diseases and treatment of MI were particularly affected and declines in activity occurred before the peak of cases or deaths (Figure 2).
Figure 2.
Hospital activity before and during the COVID-19 pandemic for referral, diagnosis, and treatment of cardiovascular disease in China, Italy and England.
Figure 2.
Continued.
Population-based EHR in England to estimate pre- and post-COVID mortality
Estimating incidence rates and pre-COVID-19 1-year mortality
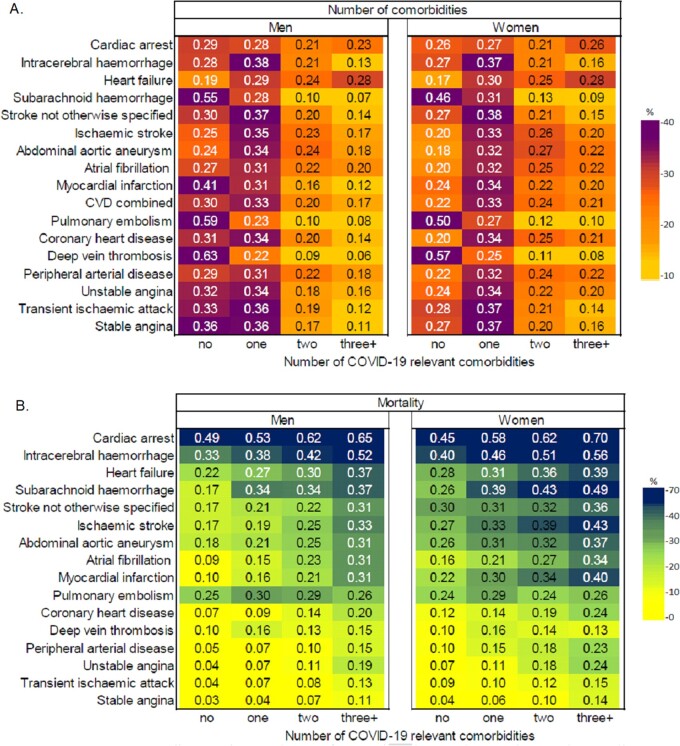
Of 3 862 012 individuals in our English cohort, 538 037 had incident CVD and 580 437 had prevalent CVD. Age-adjusted incidence rates (per 100 000 population) were highest for AF (330), CHD (261), HF (168), stable angina (140), and DVT (139) (Supplementary material online, Figure S1). For incident CVDs, 1-mortality rates varied by specific CVD: 58.4% for cardiac arrest, 42.1% for intracerebral haemorrhage, 30.3% for HF, 20.1% for MI, 12.1% for CHD, and 4.8% for stable angina. Absolute 1-year mortality was highest for AF (234 778), HF (173 955), CHD (114 383), and stroke (63 276). Mortality rates were relatively lower for prevalent CVDs (Supplementary material online, Figure S2, Results).
Across incident and prevalent CVDs, prevalence of 0, 1, 2, and 3+ co-morbidities was 26.2% and 27.1%, 33.2%, and 36.3%, 21.9%, and 20.5%, 18.6%, and 16.2%, respectively. Across CVDs, hypertension, chronic kidney disease (CKD), cancer, chronic obstructive pulmonary disease (COPD), and diabetes were commonest (Supplementary material online, Table S1, Figure S3). Comorbidity profiles were similar in those with prevalent CVD (Supplementary material online, Figure S4). Multimorbidity was associated with increased 1-year mortality, e.g. in incident AF, 1-year mortality was 31% vs. 9% in men and 34% vs. 16% in women for ≥3 vs. 0 conditions. One-year mortality risks were >50% in those with incident cardiac arrest or intracerebral haemorrhage and ≥3 conditions (Figures 3B and Supplementary material online, Figure S5B).
Figure 3.
COVID-19 relevant comorbidities in incident cardiovascular diseases in England. (A) Proportion of individuals with 0, 1, 2, and 3+ comorbidities by specific CVD. (B) One-year mortality in individuals with 0, 1, 2, and 3+ comorbidities by specific CVD.
Estimating 1-year direct and indirect excess COVID-19 deaths
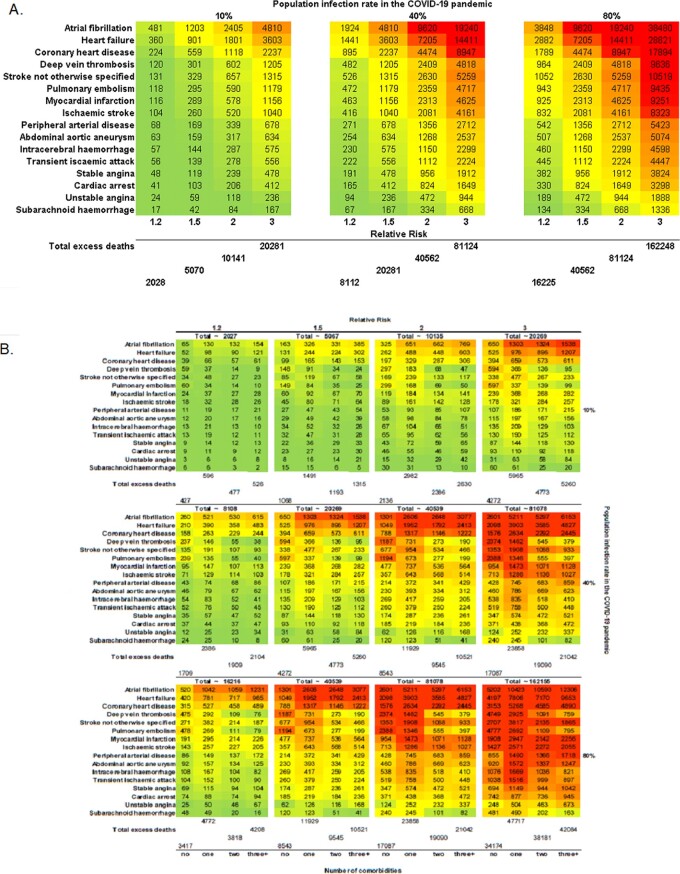
For incident CVD, at 10% infection rate, there would be 5067, 10 135, and 20 269 excess deaths at RR 1.5, 2.0, and 3.0, respectively. The medium (10% infected, 30% affected) and high (10% infected, 70% affected) estimates were 8112 and 16 225 excess deaths (Figure 4A).
Figure 4.
Estimated number excess deaths at 1 year due to COVID-19 pandemic by CVD type for: (A) incident cases; and (B) number of comorbidities for incident cases.
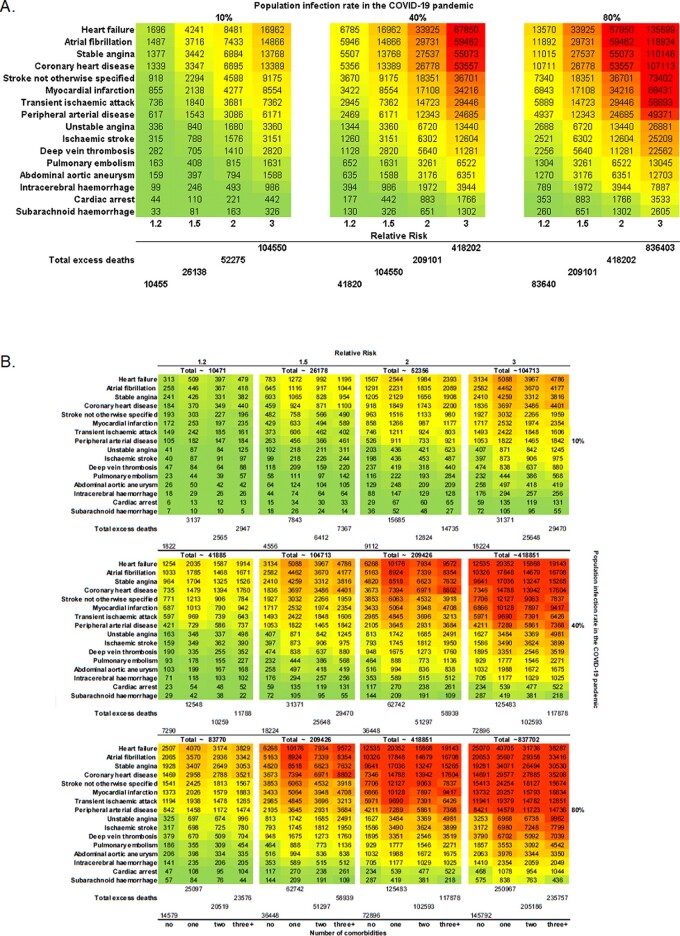
For prevalent CVD, at 10% infection rate, there would be 26 138, 52 275, and 104 550 excess deaths at RR 1.5, 2.0 and 3.0, respectively. The medium and high estimates were 41 820 and 83 640 excess deaths (Figure 5A).
Figure 5.
Estimated number excess deaths at 1 year due to COVID-19 pandemic by CVD type for: (A) prevalent cases; and (B) number of comorbidities for prevalent cases.
For total CVD (incident and prevalent combined), at 10% infection rate, we estimated a direct effect of 31 205, 62 410, and 124 819 excess deaths at RR, 1.5, 2.0, and 3.0, respectively. For total CVD, the medium and high estimates were 49 932 and 99 865 excess deaths.
For incident CVD, at 10% COVID-19 rate, we estimated 2508 vs. 1068, 5016 vs. 2136, and 10 033 vs. 4272 excess deaths in multimorbidity compared with no comorbidities at RR 1.5, 2.0, and 3.0, respectively. At medium levels (10% infected, 30% affected), we estimated 4013 vs. 1709 excess deaths; and at high levels (10% infected, 70% affected), we estimated 8026 vs. 3417 excess deaths in multimorbidity compared with no comorbidities at corresponding RRs (Figure 4B). Among those with prevalent CVDs, we estimated higher excess deaths at 1 year than for incident CVDs with similar associations with number of comorbidities (Figure 5B).
Discussion
This first analysis from large-scale population-based EHR across 16 specific CVDs and multimorbidity in the COVID-19 context has four findings. First, profound disruption of CVD services across referral, diagnosis, and treatment (seen in UK, Italy, and China) may contribute to excess deaths. Second, there are high rates of ‘high-risk’ and ‘extremely vulnerable’ conditions among people with CVD, often in combination, varying by specific CVD. Third, we predict significant excess deaths in individuals with CVD, over a 1-year time horizon partly because indirect effects may be delayed. Fourth, excess deaths in prevalent and incident CVD, by direct and indirect effects, suggest that access to acute and chronic CVD care should be prioritized during future pandemic waves.
Professional organizations quickly produced evidence-based CVD management guidelines in the COVID-19 context.26 Our analysis highlights the pandemic’s real and potential impact on CVD healthcare provision in different countries at different stages in their responses. At peak, almost all CVD healthcare activity collapsed in Wuhan. Although Italy and the UK were affected later, CVD services were, and still are, compromised in pre-lockdown and lockdown phases. Changes in CVD excess deaths have not yet been observed in ONS data, suggesting that indirect effects may manifest over at least a year, rather than contemporaneously with activity reductions observed across countries. Overall, these data emphasize indirect effects of COVID-19, helping to quantify and model true ‘relative impact’, and relative contributions of pandemic vs. lockdown on CVD services. We believe countries should monitor near real-time service activity, and COVID-19 and non-COVID-19 deaths27 over the coming year to understand and mitigate excess deaths in individuals with CVD, especially in those countries still at earlier phases, such as Brazil.
There is debate about which conditions should be on ‘high-risk’ and ‘extremely vulnerable’ lists of conditions for physical isolation policies, which should include some CVDs and combinations of comorbidities, based on our risk estimates and COVID-death data to-date.6,12 CVD is known to have high prevalence, incidence and mortality, varying by arterial territory. We now show that AF, CHD, HF, stable angina, and DVT have the highest pre-COVID-19 incidence rates. Prognosis varies by incident vs. prevalent disease, specific CVD and number and combination of comorbidities, highlighting need for individualized risk prediction across CVD. On a different note, our findings also bring into question the rationale for looking at composite endpoints such as ‘MACE’ (major adverse cardiovascular events) in trials and other studies due to highly variable risk across specific CVD.28
In individuals with CVD at 10% population infection rate, there would be 50 937 excess deaths at RR 1.5, with higher rates at higher infection rates. An earlier lockdown, as in New Zealand or the Indian state of Kerala, minimizes overall deaths. Conversely, in countries such as the UK and USA, delayed lockdown may exacerbate direct and indirect effects of COVID-19, supported by rising non-COVID-19 deaths in ONS data. COVID-19 and non-COVID-19 deaths can be avoided by: (i) acting early and reducing infection rates by widespread testing, stringent physical isolation and suppression policies, and (ii) focusing on the preventable CVD burden. For example, HF, MI, ischaemic stroke, and AF are prevalent conditions with highest mortality rates; all with evidence-based therapies. The same is true for common CVD comorbidities, which often occur in clusters: hypertension, CKD, cancer, COPD, and diabetes, underlining importance of integrated CVD and risk factor management pre- and post-COVID-19.
Our findings may have implications for which aspects of health services (acute vs. chronic, treatment vs. prevention, across specific CVDs) require attention at different pandemic phases.28 Demand for NCD care is documented in humanitarian emergencies,29 but NCD surveillance is absent in pandemic preparedness, planning and responses, particularly in low- to middle-income countries,13 where our findings will be magnified. The learning health system concept,30 where near real-time data inform science, evidence and care, has not been used optimally during the COVID-19 pandemic, but our CVD referral, diagnosis, and treatment data show that data need not be complex.
Strengths and limitations
Our study uses large-scale, nationally representative EHR with validated definitions across a comprehensive list of specific CVDs and comorbidities. We present real-time service data from three countries. There are several limitations. In the UK, our study population was 5% of the overall population. We do not have country-level data outside the UK. Our analyses of risk and excess deaths use retrospective EHR data. Our model assumes static infection rate and RR, does not include changes over time, and uses peak RR estimates. The estimated impact of COVID-19 may vary depending on the assumed RR (Supplementary material online, Discussion). We used service data from limited hospitals and only UK (ONS) administrative data was available. We do not report primary care or community level data regarding CVD services. We modelled using limited comorbidities and simple multimorbidity counts, and did not study impact of ethnicity. We assumed the same effect across all specific CVDs.
Conclusion
There is a substantial avoidable burden of excess mortality in people with CVD during the COVID-19 pandemic. Excess CVD deaths can be reduced in more integrated approaches, focused on reducing COVID-19 infection rates, as well as managing CVD and comorbidities.
Ethical approval
This study was approved by the Independent Scientific Advisory Committee of the CPRD (20_074R) under Section 251 (NHS Social Care Act 2006) of the UK Medicines and Healthcare products Regulatory Agency. Hospital data was obtained with approval of the relevant hospital institutional review boards.
Supplementary material
Supplementary material is available at European Journal of Preventive Cardiology online.
Funding
A.B. has received research funding from NIHR, UKRI, British Medical Association and Astra Zeneca. B.W. and H.H. are funded by the National Institute for Health Research (NIHR) University College London Hospitals Biomedical Research Centre. H.H. is supported by Health Data Research UK (HDR-UK; grant no LOND1), which is funded by the UK Medical Research Council, Engineering and Physical Sciences Research Council, Economic and Social Research Council, Department of Health and Social Care (England), Chief Scientist Office of the Scottish Government Health and Social Care Directorates, Health and Social Care Research and Development Division (Welsh Government), Public Health Agency (Northern Ireland), British Heart Foundation, and Wellcome Trust. A.B., S.C., S.D., and H.H. is also supported by the BigData@Heart Consortium, funded by the Innovative Medicines Initiative-2 joint undertaking under grant agreement no 116074. This joint undertaking receives support from the EU's Horizon 2020 research and innovation programme and European Federation of Pharmaceutical Industries and Associations. A.M.S. is supported by the British Heart Foundation (CH/1999001/11735), the NIHR Biomedical Research Centre at Guy’s & St Thomas’ NHS Foundation Trust and King’s College London (IS-BRC-1215-20006), and the Foundation Leducq. K.K. is supported by NIHR ARC East Midlands. B.W. is supported by the NIHR University College London Hospitals Biomedical Research Centre. H.W. is supported by Medical Research Council and Health Data Research UK Grant (MR/S004149/1), Industrial Strategy Challenge Grant (MC_PC_18029), and Wellcome Institutional Translation Partnership Award (PIII054). M.N. is supported by a Wellcome Trust Investigator in Science award (207511/Z/17/Z). D.B. is supported by the NIHR (CL-2016-17-001).
Conflict of interest: A.B. has received research funding from National Institute for Health Research (NIHR), United Kingdom Research and Innovation (UKRI), British Medical Association and Astra Zeneca. B.W. and H.H. are funded by the National Institute for Health Research (NIHR) University College London Hospitals Biomedical Research Centre. H.H. is supported by Health Data Research UK (HDR-UK; grant no LOND1), which is funded by the UK Medical Research Council, Engineering and Physical Sciences Research Council, Economic and Social Research Council, Department of Health and Social Care (England), Chief Scientist Office of the Scottish Government Health and Social Care Directorates, Health and Social Care Research and Development Division (Welsh Government), Public Health Agency (Northern Ireland), British Heart Foundation, and Wellcome Trust. A.B., S.C., S.D., and H.H. is also supported by the BigData@Heart Consortium, funded by the Innovative Medicines Initiative-2 joint undertaking under grant agreement no 116074. This joint undertaking receives support from the EU's Horizon 2020 research and innovation programme and European Federation of Pharmaceutical Industries and Associations. AMS is supported by the British Heart Foundation (CH/1999001/11735), the NIHR Biomedical Research Centre at Guy’s & St Thomas’ NHS Foundation Trust and King’s College London (IS-BRC-1215-20006), and the Fondation Leducq. K.K. is supported by NIHR ARC East Midlands. BW is supported by the NIHR University College London Hospitals Biomedical Research Centre. H.W. is supported by Medical Research Council and Health Data Research UK Grant (MR/S004149/1), Industrial Strategy Challenge Grant (MC_PC_18029), and Wellcome Institutional Translation Partnership Award (PIII054). M.N. is supported by a Wellcome Trust Investigator in Science award (207511/Z/17/Z). D.B. is supported by the NIHR (CL-2016-17-001).
Supplementary Material
Listen to the audio abstract of this contribution.
References
- 1. Lai AG, Pasea L, Banerjee A, Denaxas S, Katsoulis M, Chang WH, Williams B, Pillay D, Noursadeghi M, Swanton C, Linch D, Hughes D, Forster MD, Johnson P, Turnbull CDATA-CANCooper M, Jones M, Pritchard-Jones K, Sullivan R, Lawler M, Hall G, Davie C, Hemingway H. Estimating excess mortality in people with cancer and multimorbidity in the COVID-19 emergency. 2020. Preprint 29 April 2020. https://www.researchgate.net/publication/340984562_Estimating_excess_mortality_in_people_with_cancer_and_multimorbidity_in_the_COVID-19_emergency (accessed 4 January 2021).
- 2. De Rosa S, Spaccarotella C, Basso C, Calabrò MP, Curcio A, Filardi PP, Mancone M, Mercuro G, Muscoli S, Nodari S, Pedrinelli R, Sinagra G, Indolfi C; Società Italiana di Cardiologia and the CCU Academy investigators group. Reduction of hospitalizations for myocardial infarction in Italy in the COVID-19 era. Eur Heart J 2020;41:2083–2088. [DOI] [PMC free article] [PubMed] [Google Scholar]
- 3. De Filippo O, D’Ascenzo F, Angelini F, Bocchino PP, Conrotto F, Saglietto A, Secco GG, Campo G, Gallone G, Verardi R, Gaido L, Iannaccone M, Galvani M, Ugo F, Barbero U, Infantino V, Olivotti L, Mennuni M, Gili S, Infusino F, Vercellino M, Zucchetti O, Casella G, Giammaria M, Boccuzzi G, Tolomeo P, Doronzo B, Senatore G, Grosso Marra W, Rognoni A, Trabattoni D, Franchin L, Borin A, Bruno F, Galluzzo A, Gambino A, Nicolino A, Truffa Giachet A, Sardella G, Fedele F, Monticone S, Montefusco A, Omedè P, Pennone M, Patti G, Mancone M, De Ferrari GM.. Reduced rate of hospital admissions for ACS during Covid-19 outbreak in Northern Italy. N Engl J Med 2020;383:88–89. [DOI] [PMC free article] [PubMed] [Google Scholar]
- 4. Bhatt AS, Moscone A, McElrath EE, Varshney AS, Claggett BL, Bhatt DL, Januzzi JL, Butler J, Adler DS, Solomon SD, Vaduganathan M.. Declines in hospitalizations for acute cardiovascular conditions during the COVID-19 pandemic: a multicenter tertiary care experience. J Am Coll Cardiol 2020;76:280–288. [DOI] [PMC free article] [PubMed] [Google Scholar]
- 5. Garg S, Kim L, Whitaker M, O’Halloran A, Cummings C, Holstein R, Prill M, Chai SJ, Kirley PD, Alden NB, Kawasaki B, Yousey-Hindes K, Niccolai L, Anderson EJ, Openo KP, Weigel A, Monroe ML, Ryan P, Henderson J, Kim S, Como-Sabetti K, Lynfield R, Sosin D, Torres S, Muse A, Bennett NM, Billing L, Sutton M, West N, Schaffner W, Talbot HK, Aquino C, George A, Budd A, Brammer L, Langley G, Hall AJ, Fry A.. Hospitalization rates and characteristics of patients hospitalized with laboratory-confirmed coronavirus disease 2019—COVID-NET, 14 States, March 1-30, 2020. MMWR Morb Mortal Wkly Rep 2020;69:458–464. [DOI] [PMC free article] [PubMed] [Google Scholar]
- 6. Richardson S, Hirsch JS, Narasimhan M, Crawford JM, McGinn T, Davidson KW, Barnaby DP, Becker LB, Chelico JD, Cohen SL, Cookingham J, Coppa K, Diefenbach MA, Dominello AJ, Duer-Hefele J, Falzon L, Gitlin J, Hajizadeh N, Harvin TG, Hirschwerk DA, Kim EJ, Kozel ZM, Marrast LM, Mogavero JN, Osorio GA, Qiu M, Zanos TP; and the Northwell COVID-19 Research Consortium. Presenting characteristics, comorbidities, and outcomes among 5700 patients hospitalized with COVID-19 in the New York City Area. JAMA 2020;323:2052. [DOI] [PMC free article] [PubMed] [Google Scholar]
- 7.ICNARC report on COVID-19 in critical care. 24 April 2020 https://www.icnarc.org/Our-Audit/Audits/Cmp/Reports (accessed 4 January 2021).
- 8. Yang J, Zheng Y, Gou X, Pu K, Chen Z, Guo Q, Ji R, Wang H, Wang Y, Zhou Y.. Prevalence of comorbidities in the novel Wuhan coronavirus (COVID-19) infection: a systematic review and meta-analysis. Int J Infect Dis 2020;94:91–95. [DOI] [PMC free article] [PubMed] [Google Scholar]
- 9.Public Health England. Guidance on social distancing for everyone in the UK and protecting older people and vulnerable adults. 16 March 2020. https://www.gov.uk/government/publications/covid-19-guidance-on-social-distancing-and-for-vulnerable-people/guidance-on-social-distancing-for-everyone-in-the-uk-and-protecting-older-people-and-vulnerable-adults ( accessed 4 January 2021).
- 10.UK Government. https://www.gov.uk/government/news/major-new-measures-to-protect-people-at-highest-risk-from-coronavirus (accessed 4 January 2021).
- 11.UK Government. PM address to the nation on coronavirus: 23 March 2020. https://www.gov.uk/government/speeches/pm-address-to-the-nation-on-coronavirus-23-march-2020 (accessed 4 January 2021).
- 12. Banerjee A, Pasea L, Harris S, Gonzalez-Izquierdo A, Torralbo A, Shallcross L, Noursadeghi M, Pillay D, Sebire N, Holmes C, Pagel C, Wong WK, Langenberg C, Williams B, Denaxas S, Hemingway H.. Estimating excess 1-year mortality from COVID-19 according to underlying conditions and age in England: a rapid analysis using NHS health records in 3.8 million adults. Lancet 2020;395:1715–1725. [DOI] [PMC free article] [PubMed] [Google Scholar]
- 13.GBD 2017 Disease and Injury Incidence and Prevalence Collaborators. Global, regional, and national incidence, prevalence, and years lived with disability for 354 diseases and injuries for 195 countries and territories, 1990-2017: a systematic analysis for the Global Burden of Disease Study 2017. Lancet 2018;392:1789–1858. [DOI] [PMC free article] [PubMed] [Google Scholar]
- 14. Shah AD, Langenberg C, Rapsomaniki E, Denaxas S, Pujades-Rodriguez M, Gale CP, Deanfield J, Smeeth L, Timmis A, Hemingway H.. Type 2 diabetes and incidence of cardiovascular diseases: a cohort study in 1.9 million people. Lancet Diabetes Endocrinol 2015;3:105–113. [DOI] [PMC free article] [PubMed] [Google Scholar]
- 15.Office of National Statistics. Deaths involving COVID-19, England and Wales: deaths occurring in April 2020. https://www.ons.gov.uk/peoplepopulationandcommunity/birthsdeathsandmarriages/deaths/bulletins/deathsinvolvingcovid19englandandwales/deathsoccurringinapril2020 (accessed 4 January 2021).
- 16.Emergency Department Syndromic Surveillance System: England. 27 May 2020. https://assets.publishing.service.gov.uk/government/uploads/system/uploads/attachment_data/file/887777/EDSSSBulletin2020wk21.pdf (Accessed 2 June 2020).
- 17. Denaxas S, Gonzalez-Izquierdo A, Direk K, Fitzpatrick NK, Fatemifar G, Banerjee A, Dobson RJB, Howe LJ, Kuan V, Lumbers RT, Pasea L, Patel RS, Shah AD, Hingorani AD, Sudlow C, Hemingway H.. UK phenomics platform for developing and validating electronic health record phenotypes: CALIBER. J Am Med Inform Assoc 2019;26:1545–1559. [DOI] [PMC free article] [PubMed] [Google Scholar]
- 18. George J, Mathur R, Shah AD, Pujades-Rodriguez M, Denaxas S, Smeeth L, Timmis A, Hemingway H.. Ethnicity and the first diagnosis of a wide range of cardiovascular diseases: associations in a linked electronic health record cohort of 1 million patients. PLoS One 2017;12:e0178945. [DOI] [PMC free article] [PubMed] [Google Scholar]
- 19. Zhai Z, Li C, Chen Y, Gerotziafas G, Zhang Z, Wan J, Liu P, Elalamy I, Wang C; On behalf of the Prevention Treatment of VTE Associated with COVID-19 Infection Consensus Statement Group. Thromboembolism associated with coronavirus disease 2019 infection: a consensus statement before guidelines. Thromb Haemost 2020;120:937–948. [DOI] [PMC free article] [PubMed] [Google Scholar]
- 20. Hurst JR, Dickhaus J, Maulik PK, Miranda JJ, Pastakia SD, Soriano JB, Siddharthan T, Vedanthan R, Agarwal G, Aguilar-Salinas CA, Bloomfield GS, Chavannes NH, Daivadanam M, Gómez-Olivé FX, Gorre C, Levitt NS, Lotrean LM, Norris SA, Owolabi M, Parker G, Postma MJ, Sheikh A, Siddiqi K, Stratev V, Trofor AC, van Boven JF, van der Kleij RM.. Global alliance for chronic disease researchers' statement on multimorbidity. Lancet Glob Health 2018;6:e1270–e1271. [DOI] [PubMed] [Google Scholar]
- 21.Office for National Statistics. Deaths by single year of age tables, UK. https://www.ons.gov.uk/peoplepopulationandcommunity/birthsdeathsandmarriages/deaths/datasets/deathregistrationssummarytablesenglandandwalesdeathsbysingleyearofagetables 17 January 2020. (accessed 4 January 2021).
- 22. Chen R, Liang W, Jiang M, Guan W, Zhan C, Wang T, Tang C, Sang L, Liu J, Ni Z, Hu Y, Liu L, Shan H, Lei C, Peng Y, Wei L, Liu Y, Hu Y, Peng P, Wang J, Liu J, Chen Z, Li G, Zheng Z, Qiu S, Luo J, Ye C, Zhu S, Liu X, Cheng L, Ye F, Zheng J, Zhang N, Li Y, He J, Li S, Zhong N; Medical Treatment Expert Group for COVID-19. Risk factors of fatal outcome in hospitalized subjects with coronavirus disease 2019 from a nationwide analysis in China. Chest 2020;158:97–3692. [DOI] [PMC free article] [PubMed] [Google Scholar]
- 23.The OpenSAFELY Collaborative; Williamson E, Walker AJ, Bhaskaran K, Bacon S, Bates C, Morton CE, Curtis HJ, Mehrkar A, Evans D, Inglesby P, Cockburn J, McDonald HI, MacKenna B, Tomlinson L, Douglas IJ, Rentsch CT, Mathur R, Wong A, Grieve R, Harrison D, Forbes H, Schultze A, Croker R, Parry J, Hester F, Harper S, Perera R, Evans S, Smeeth L, Goldacre B. OpenSAFELY: factors associated with COVID-19-related hospital death in the linked electronic health records of 17 million adult NHS patients. Medrxiv. 7 May 2020. https://www.medrxiv.org/content/10.1101/2020.05.06.20092999v1.full.pdf.
- 24.Office of National Statistics. Coronavirus (COVID-19) Infection Survey. https://www.ons.gov.uk/peoplepopulationandcommunity/healthandsocialcare/conditionsanddiseases/datasets/coronaviruscovid19infectionsurveydata (Accessed 1 June 2020).
- 25. Valenti L, Bergna A, Pelusi S, Facciotti F, Lai A, Tarkowski M, Berzuini A, Caprioli F, Santoro L, Baselli G, Ventura CD, Erba E, Bosari S, Galli M, Zehender G, Prati D. SARS-CoV-2 seroprevalence trends in healthy blood donors during the COVID-19 Milan outbreak. May 31 2020. https://www.medrxiv.org/content/10.1101/2020.05.11.20098442v1 (accessed 4 January 2021. [DOI] [PMC free article] [PubMed]
- 26.European Society of Cardiology. ESC Guidance for the Diagnosis and Management of CV Disease during the COVID-19 Pandemic. 21 April 2020. https://www.escardio.org/Education/COVID-19-and-Cardiology/ESC-COVID-19-Guidance.
- 27. Figueroa J, Brennan P, Theodoratou E, Poon M, Purshouse K, Din F, Jin K, Mesa-Eguiagaray I, Dunlop MG, Hall PS, Cameron D, Wild S, Sudlow CLM. Trends in excess cancer and cardiovascular deaths in Scotland during the COVID-19 pandemic 30 December 2019 to 20 April 2020. medrxiv. 2020. Preprint. 6 May 2020. https://www.medrxiv.org/content/10.1101/2020.05.02.20086231v1.
- 28. Agostoni P, Mapelli M, Conte E, Baggiano A, Assanelli E, Apostolo A, Alimento M, Berna G, Guglielmo M, Muratori M, Susini F, Palermo P, Pezzuto B, Salvioni E, Sudati A, Vignati C, Merlino L.. Cardiac patient care during a pandemic: how to reorganise a heart failure unit at the time of COVID-19. Eur J Prev Cardiol 2020;27:1127–1132. [DOI] [PMC free article] [PubMed] [Google Scholar]
- 29. Demaio A, Jamieson J, Horn R, de Courten M, Tellier S.. Non-communicable diseases in emergencies: a call to action. PLoS Curr 2013;5:ecurrents.dis.53e08b951d59ff913ab8b9bb51c4d0de. [DOI] [PMC free article] [PubMed] [Google Scholar]
- 30. Banerjee A, Drumright LN, Mitchell ARJ.. Can the NHS be a learning healthcare system in the age of digital technology? BMJ Evid Based Med 2018;23:161–165. [DOI] [PubMed] [Google Scholar]
Associated Data
This section collects any data citations, data availability statements, or supplementary materials included in this article.


