

Abstract
Background
Individuals can test positive for severe acute respiratory syndrome coronavirus 2 (SARS-CoV-2) by molecular assays following the resolution of their clinical disease. Recent studies indicate that SARS-CoV-2 antigen–based tests are likely to be positive early in the disease course, when there is an increased likelihood of high levels of infectious virus.
Methods
Upper respiratory specimens from 251 participants with coronavirus disease 2019 symptoms (≤7 days from symptom onset) were prospectively collected and tested with a lateral flow antigen test and a real-time polymerase chain reaction (rt-PCR) assay for detection of SARS-CoV-2. Specimens from a subset of the study specimens were utilized to determine the presence of infectious virus in the VeroE6TMPRSS2 cell culture model.
Results
The antigen test demonstrated a higher positive predictive value (90%) than rt-PCR (70%) when compared to culture-positive results. The positive percentage agreement for detection of infectious virus for the antigen test was similar to rt-PCR when compared to culture results.
Conclusions
The correlation between SARS-CoV-2 antigen and SARS-CoV-2 culture positivity represents a significant advancement in determining the risk for potential transmissibility beyond that which can be achieved by detection of SARS-CoV-2 genomic RNA. SARS-CoV-2 antigen testing can facilitate low-cost, scalable, and rapid time-to-result, while providing good risk determination of those who are likely harboring infectious virus, compared to rt-PCR.
Keywords: SARS-CoV-2, antigen testing, SARS-CoV-2 live culture, rt-PCR testing, viral load
Antigen-based, real-time polymerase chain reaction (rt-PCR)–based, and VeroE6TMPRSS2 cell culture–based testing was conducted using upper respiratory specimens from COVID-19–symptomatic individuals. Using VeroE6TMPRSS2 culture as reference, antigen-based testing had similar positive percentage agreement but better positive predictive value, compared to rt-PCR, for detecting infectious virus.
The severe acute respiratory syndrome coronavirus 2 (SARS-CoV-2) causes coronavirus disease 2019 (COVID-19) and is spread person-to-person, primarily through large respiratory droplets but also via airborne transmission [1]. The mean incubation time, or presymptomatic period, for SARS-CoV-2 is approximately 5.8 days (95% confidence interval [CI], 5.0–6.7 days) [2, 3], and the period of transmission (the total time during which a patient is contagious) begins around 1–3 days prior to symptom onset, with a subsequent reduction in contagiousness occurring 7–10 days following symptom onset [4–6]. Recent work in a golden hamster SARS-CoV-2 model demonstrated that although the presence of genomic RNA in nasal washes extends to 14 days postinoculation, the detection of infectious virus and the communicable period both end well before 14 days [7]. In addition, 4 previous studies, utilizing culture-based virus detection from human specimens, demonstrated an absence of infectious isolates from most specimens taken 8 days after symptom onset, despite measurable viral RNA loads using real-time polymerase chain reaction (rt-PCR) [8–11].
Several SARS-CoV-2 antigen–based tests, which work via a lateral flow immunoassay mechanism, have recently received Emergency Use Authorization (EUA) from the United States Food and Drug Administration (FDA) [12–15]. Several lines of indirect evidence suggest that antigen-based testing may align better with virus culture–based test results compared to rt-PCR. For example, higher rt-PCR cycle threshold (Ct) values from specimens are observed when individuals are negative by antigen testing or virus culture–based testing compared to those from individuals who are antigen test–based [16] or culture test–based positive [17]. In addition, current EUA SARS-CoV-2 antigen tests have optimal performance profiles [12–15] at time points that overlap with the expression profile of SARS-CoV-2 subgenomic RNAs, which are markers of replicating virus [8]. Despite the recognition that point-of-care or other testing modalities might be more effective at discerning individuals who harbor infectious virus from those who that do not [18], no study has directly compared antigen-based testing with rt-PCR in the same study using a reference method that can identify infectious SARS-CoV-2.
The objective of this study was to determine whether antigen testing more accurately reflects the presence of infectious virus in SARS-CoV-2–positive individuals compared to rt-PCR methodology. To address this, we utilized the Quidel Lyra SARS-CoV-2 Assay (“rt-PCR assay”)–positive and –negative specimens obtained from a diverse set of collection sites across the United States. The rt-PCR assay and the BD Veritor System for Rapid Detection of SARS-CoV-2 (“antigen test”) were compared to SARS-CoV-2 TMPRSS2 culture (a sensitive virus culture test utilizing the VeroE6TMPRSS2 cell line), which served as the reference method for detecting the presence of infectious virus.
MATERIALS AND METHODS
Study Design and Specimen Collection
Prospective specimen collection, specimen use, and participant demographics for the parent study were described previously [16]. This study involved the use of residual respiratory swab specimens from the previous antigen test FDA EUA study, which occurred across 21 geographically diverse study sites, from 5 to 11 June 2020. In brief, eligible participants were ≥18 years of age and had 1 or more self-reported COVID-19 symptoms between 0 and 7 days from symptom onset. Nasal swab specimens for use with antigen testing were collected only after the standard of care (SOC) swab. Nasopharyngeal (NP) swab specimens were collected after the nasal swab specimen for use with the rt-PCR assay (the laboratory reference standard in the EUA study); if an NP was collected as part of the SOC procedure at a collection site, the participant was given the choice of having an oropharyngeal (OP) swab specimen collected in lieu of a second NP swab for use with the rt-PCR assay. Overall, 76 specimen sets (consisting of 1 nasal and either 1 NP or 1 OP swab) were utilized from the original 251 evaluable specimen sets in the EUA study. The 76 specimens consisted of all 38 rt-PCR assay–positive specimens, and 38 randomly selected rt-PCR assay–negative specimens from the parent study. Specimens for the rt-PCR assay consisted of 71 NP swabs (37 positive, 34 negative) and 5 OP swabs (1 positive, 4 negative). For the EUA study, reference testing was performed at TriCore Reference Laboratories whereas the antigen testing was performed internally at BD (San Diego, California). No study-related procedures were performed without an informed consent process or signature of a consent form. This research was performed in alignment with principles set forth by Good Clinical Practice guidelines and the Declaration of Helsinki. This article was prepared according to STARD (Standards for Reporting Diagnostic Accuracy Studies) guidelines.
Test/Assay Procedures
Antigen Test and rt-PCR Assay
The antigen test (Becton, Dickinson and Company, BD Life Sciences–Integrated Diagnostic Solutions, San Diego, California) and rt-PCR assay (Quidel Corporation. Athens, Ohio) were performed according to the manufacturers’ instructions for use [15, 19]. The only exception was that nasal swabs were shipped on dry ice (–70°C) to the testing site prior to preparation for the antigen test. The rt-PCR assay reports cycle number in a manner that omits the first 10 cycles; here cycle numbers for the rt-PCR assay are reported with the addition of first 10 cycles.
SARS-CoV-2 Viral Culture
VeroE6TMPRSS2 (derived at the National Institute of Infectious Diseases, Japan) was adapted from the VeroE6 cell line (ATCC CRL-1586) to express the TMPRSS2 protease at levels approximately 10-fold higher than that found in the human lung [20]. SARS-CoV-2 infection of VeroTMPRSS2 cells yields higher infectious virus titers and a faster cytopathic effect when compared to VeroE6 cells, which facilitates virus isolation from clinical samples. For this study, the VeroE6TMPRSS2 cultures were inoculated with specimens obtained from the NP or OP swabs used to perform rt-PCR. The cells were cultured in complete medium (CM) consisting of Dulbecco’s modified Eagle’s medium (without pyruvate, Sigma Life Sciences D5796), supplemented with 10% fetal bovine serum (Thermo Fisher Scientific–Gibco, Waltham, Massachusetts), and 1 mM glutamine, 1 mM sodium pyruvate, 100 µg/mL penicillin, and 100 µg/mL streptomycin (all from Thermo Fisher Scientific–Invitrogen, Waltham, Massachusetts), at 37°C in a humidified chamber with 5% carbon dioxide. Cells were grown to 75% confluence in a 24-well plate format and the CM was removed and replaced with 150 µL of infection media (IM), which is identical to CM but with the fetal bovine serum reduced to 2.5%. One hundred microliters (100 µL) of the clinical specimen was added to each assay well and the cells were incubated at 37°C for 2 hours. The inoculum was then aspirated and replaced with 0.5 mL IM; the cells were then maintained at 37°C for 4 days. When a cytopathic effect was visible in most of the cells in a given well, the IM was harvested and stored at –70°C. The presence of SARS-CoV-2 was confirmed through quantitative rt-PCR as described previously [11, 21], by extracting RNA from the cell culture supernatant using the Qiagen viral RNA isolation kit and performing rt-PCR using the N1 and N2 SARS-CoV-2 specific primers and probes in addition to primers and probes for human RNaseP gene using synthetic RNA target sequences to establish a standard curve.
Probit Models for Probability of Positive SARS-CoV-2 Result
The rt-PCR assay was performed on serially diluted samples containing SARS-CoV-2–related genomic RNA prepared in universal transport media (containing human lung epithelial cells at 130 000 cells/mL) at concentrations ranging from 1.27 to 4.27 log10 copies/mL (Supplementary Table 1). The rt-PCR assay probability of positive result was fit using a probit model linking the Lyra results to viral RNA load. Linear regression was performed linking log10 copies/mL viral RNA load to Lyra Ct score using all samples with at least 3 log10 copies/mL (for which observed Lyra positivity was 100%).
Antigen test positivity and SARS-CoV-2 TMPRSS2 culture positivity (an indicator of the presence of infectious virus), with rt-PCR confirmation, were fit with a probit model as a function of viral load, using results from the Veritor EUA study [16]; rt-PCR assay Ct scores were used to estimate viral RNA loads, as described above. SARS-CoV-2 VeroE6 culture positivity linkage to viral load was inserted into the probit model for probability of a positive result using data from Huang et al [17]. Virus isolation in Huang et al was attempted for a total of 60 specimens positive by rt-PCR for SARS-CoV-2. Of those, 23 were positive by culture. Ct scores of the SARS-CoV-2 envelope, nucleocapsid, and nonstructural protein 12 rt-PCR targets were linked to the viral load (log10 copies/mL) through quadratic regressions. The empirical equation for envelope target Ct score was then used to calculate viral load for the 23 culture-positive and 37 culture-negative specimens (Supplementary Figure 2). All analyses were performed using the R software system and the ggplot2 R package [22, 23].
RESULTS
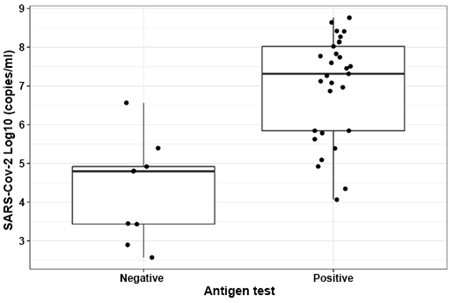
The 38 rt-PCR–positive specimens were tested for the presence of SARS-CoV-2 using infection of VeroE6TMPRSS2 cell cultures (SARS-CoV-2 TMPRSS2 culture). Overall, 28 rt-PCR–positive specimens were also positive by SARS-CoV-2 TMPRSS2 culture and 10 of 38 rt-PCR–positive specimens were negative by SARS-CoV-2 TMPRSS2 culture (Figure 1A). SARS-CoV-2 TMPRSS2 culture–positive specimens had a mean log10 viral RNA copy number of 7.16 compared to 4.01 from specimens that were SARS-CoV-2 TMPRSS2 culture negative (P < .001, 2-sample t test, 2-tailed analysis). Further stratification by results from the antigen test showed that 27 of 28 rt-PCR–positive/SARS-CoV-2 TMPRSS2 culture–positive specimens were also positive in the antigen test; only 2 of the 10 rt-PCR–positive/SARS-CoV-2 TMPRSS2 culture–negative specimens were positive by the antigen test.
Figure 1.

A, The 38 real-time polymerase chain reaction (rt-PCR) assay–positive specimens are plotted by log10 copies/mL (y-axis) and are stratified by the severe acute respiratory syndrome coronavirus 2 (SARS-CoV-2) live culture results (negative, n = 10; positive, n = 28). The median and interquartile range (IQR) values for the rt-PCR–positive/SARS-CoV-2 TMPRSS2 culture–negative tests were 4.21 and 1.37, respectively; the median and IQR values for the rt-PCR–positive/SARS-CoV-2 TMPRSS2 culture–positive tests were 7.39 and 1.66, respectively. The mean values for the SARS-CoV-2 TMPRSS2 culture–negative and SARS-CoV-2 TMPRSS2 assay–positive specimen groups were significantly different (4.01 vs 7.16, respectively; P < .001 based on 2-sample t test [2-tailed]). Antigen test–positive results are indicated as red data points (n = 29), and the antigen test–negative results (n = 9) are indicated by the green data points. B, Probit models linking viral load to the probability of positive result of rt-PCR (Lyra), antigen test (Veritor), SARS-CoV-2 TMPRSS2 culture, and SARS-CoV-2 VeroE6 culture (refer to Huang et al [17]). Viral load levels at which there is a 5% chance of positive result: 1.6, 2.6, 4.5, and 5.75 log10 copies/mL for rt-PCR, antigen, SARS-CoV-2 TMPRSS2 culture, and SARS-CoV-2 VeroE6 culture, respectively.
Of the 38 rt-PCR–positive results utilized for these analyses, 9 were antigen test negative. These 9 negative results showed a trend toward longer time from symptom onset compared to the 29 rt-PCR assay–positive/antigen test–positive specimens (average, 4.4 vs 2.9 days, P = .108) [16]. Of the 9 samples that were rt-PCR positive/antigen test negative, the viral RNA copy number was significantly lower than that observed for the 29 rt-PCR–positive/antigen test–positive specimens (mean, 4.3 vs 7.0 log10 copies/mL, P < .001; Supplementary Figure 1). Symptom day was not a significant factor in multivariate models, while viral RNA load continued to be significant (P = .002).
Probit models for percentage positivity by viral RNA load corresponding to the rt-PCR assay, antigen test, SARS-CoV-2 TMPRSS2 culture, and SARS-CoV-2 culture with VeroE6 cells (“SARS-CoV-2 VeroE6 culture”; data integrated into the probit model using previous data; see Materials and Methods) [17] are provided in Figure 1B. The SARS-CoV-2 VeroE6 culture yielded a positive result at a rate of 5% for a viral load of 5.75 log10 copies/mL, whereas the SARS-CoV-2 TMPRSS2 culture corresponded to a positive result with a rate of 5% at a viral load of 4.5 log10 copies/mL. At a viral load of 2.6 log10 copies/mL, the antigen test yielded a positive result at a rate of 5%. In a multivariate generalized linear model with viral RNA load and test type, the SARS-CoV-2 TMPRSS2 culture was not significantly different from the antigen test (P = .953). Both the SARS-CoV-2 TMPRSS2 culture and antigen test were more likely to yield positive results than SARS-CoV-2 VeroE6 culture (P < .001 for both). Unlike the antigen test, the rt-PCR assay showed very little overlap with SARS-CoV-2 TMPRSS2 culture, yielding positive results at much lower viral loads.
As shown in Table 1, the antigen test demonstrated a positive percentage agreement (PPA) of 96.4% (95% CI, 82.3%–99.4%) and negative percentage agreement (NPA) of 98.7% (95% CI, 96.1%–99.7%). The rt-PCR assay demonstrated a PPA and NPA of 100% (95% CI, 87.7%–100%) and 95.5% (95% CI, 91.1%–97.8%), respectively. Based on the study prevalence of 11.2%, as determined by SARS-CoV-2 TMPRSS2 culture positivity and a total specimen number of 251 (based on the total, evaluable specimen set utilized for the Veritor EUA study), the positive predictive value (PPV) for the antigen test was 90.0% (95% CI, 76.3%–97.6%), whereas the PPV for the rt-PCR assay was only 73.7% (95% CI, 60.8%–85.3%).
Table 1.
Performance of the BD Veritor Antigen Test and the Quidel Lyra Real-Time Polymerase Chain Reaction Assay Compared to Severe Acute Respiratory Syndrome Coronavirus 2 Viral Culture Using Specimens Collected Within 7 Days of Symptom Onset
| Performance Values | Antigen Test Performance | rt-PCR Performance |
|---|---|---|
| PPA | 96.4 (82.3–99.4) | 100 (87.7–100) |
| NPA | 98.7 (96.1–99.7) | 95.5 (91.1–97.8) |
| PPV | 90.0 (76.3–97.6) | 73.7 (60.8–85.3) |
| NPV | 99.5 (97.7–100) | 100 (98.4–100) |
| OPA | 98.4 (96.0–99.4) | 96.0 (92.8–97.8) |
| Culture (+)/test (+) | 27 | 28 |
| Culture (–)/test (+) | 3 | 10 |
| Culture (+)/test (–) | 1 | 0 |
| Culture (–)/test (–)a | 220 | 213 |
Prevalence was 11.2%.
Abbreviations: NPA, negative percentage agreement; NPV, negative predictive value; OPA, overall percentage agreement; PPA, positive percentage agreement; PPV, positive predictive value; rt-PCR, real-time polymerase chain reaction.
aIncludes 176 specimen sets that were rt-PCR and antigen negative, with unavailable culture results.
DISCUSSION
The results here show similar PPA between the SARS-CoV-2 antigen test and the SARS-CoV-2 rt-PCR (96.4% and 100%, respectively, when compared to viral culture) over a time range of <8 days after symptom onset. However, the SARS-CoV-2 antigen test had a PPV of 90.0%, whereas the rt-PCR assay showed a PPV of only 73.7%. In addition, the probit model for percentage positivity employed in this study showed considerable overlap between the antigen test and the SARS-CoV-2 TMPRSS2 culture, with little overlap between the SARS-CoV-2 TMPRSS2 culture and rt-PCR.
Cycle threshold values are inversely proportional to the amount of viral nucleic acid in the clinical specimen. Because limits of detection vary between rt-PCR assays, however, Ct values reported by specific rt-PCR assays correspond to different viral RNA loads [11, 17, 24–28]. Here we utilized the Lyra assay to establish a probit model of percentage positivity by viral load, which facilitates a better comparison of these results with previous work. Recent studies involving upper respiratory swab specimens reported no cases of COVID-19 transmission with SARS-CoV-2 viral RNA loads <4 log10 copies/mL [8–10, 17, 29]. Other work has shown that specimens with viral RNA loads ≤6 log10 copies/mL have a low likelihood of having culturable SARS-CoV-2 virus [8, 9, 30–32]. Here, a low percentage positivity (5%–10%) was observed for the SARS-CoV-2 VeroE6 culture test <6 log10 copies/mL. The SARS-CoV-2 TMPRSS2 culture test, however, showed 90% positivity at 5.6 log10 copies/mL. In our experience, the VeroE6TMPRSS2 cells produce higher amounts of infectious virus and demonstrate cytopathic effect faster compared with VeroE6 cells, making them well-suited for detecting infectious virus. Although the antigen test had a larger distribution of positivity, it overlapped considerably with the SARS-CoV-2 TMPRSS2 culture test and approached 90% positivity at a viral RNA load of 6.4 log10. This is consistent with the World Health Organization target product profile for priority diagnostics, which supports viral RNA load–based methodologies and includes an acceptable limit of detection for point-of-care tests of 6 log10 copies/mL [33].
As with SARS, rt-PCR–based methodologies may be detecting SARS-CoV-2 RNA even after infectious virus is no longer detectable [34, 35], especially at time periods beyond 7 days from symptom onset [8, 10]. For most patients with COVID-19, efforts to isolate infectious virus from upper respiratory tract specimens have been unsuccessful ≥10 days from symptom onset; it is unlikely that these individuals pose a transmission risk to others [28]. In addition, there is no evidence to date that persistent or recurrent detection of viral RNA, following recovery from COVID-19, poses a risk of SARS-CoV-2 transmission [28].
This work highlights a key potential value of decentralized point-of-care antigen-based testing and furthers our understanding of the interpretation of antigen test results. Antigen testing facilitates accurate and rapid detection of individuals harboring infectious virus who may not require direct medical management (due to mild/nonsevere disease), but for whom infection control measures have the potential to interrupt community transmission. While rt-PCR is highly sensitive when compared to SARS-CoV-2 TMPRSS2 culture, antigen testing also showed excellent PPA (96.4%) coupled with better PPV relative to rt-PCR (90.0 vs 73.7) and rapid time to results.
This study had limitations. It only included specimens from patients within 7 days of symptom onset. Several studies have demonstrated an inability to culture SARS-CoV-2 beyond day 8, despite ongoing rt-PCR positivity [8–10]. Serial sampling of COVID-19 patients is needed to determine if there is a propensity to have viral antigen test–positive results after a negative result, as can sometimes be seen with rt-PCR tests. Results from this study likely underestimate the difference in NPA between rt-PCR and antigen testing that would be expected in a setting that included specimens collected at later times post–symptom onset. In this study, while 3 subjects were antigen test positive and SARS-CoV-2 TMPRSS2 culture negative, as many as 10 subjects were rt-PCR positive and culture negative (viral RNA loads ranging from 2.6 to 5.4 log10 copies/mL). Although the sample size was adequate in this study, the CIs in the probit model were too wide to establish a definitive viral load cutoff. To improve the precision associated with the point estimates, either a larger study or a meta-analysis, involving multiple studies, would be required. In addition, there are limitations associated with the use of culture positivity or viral RNA load as a surrogate for infectiousness or transmissibility that require further investigation. It is unclear how well the results here will extrapolate to the other antigen tests due to variability in limit of detection or other test characteristics. Finally, extrapolation of these data, which were collected on symptomatic individuals, to presymptomatic or asymptomatic individuals would be inappropriate. Additional work is required to determine the relative performance of antigen testing vs rt-PCR for detection of those harboring infectious SARS-CoV-2 in these populations.
CONCLUSIONS
Point-of-care SARS-CoV-2 antigen tests have the potential to significantly change the public health interventions needed to minimize the spread of COVID-19 by providing a better test to identify individuals who are likely to be shedding infectious virus and therefore have potential to transmit SARS-CoV-2. In addition, the low cost and scalability in low- and middle-income countries associated with antigen-based testing will be an important tool in the diagnostic armamentarium to contain and suppress COVID-19 community transmission. Future work is required to determine whether this will allow for rapid identification of asymptomatic COVID-19 cases and inform shorter periods of self-isolation for SARS-CoV-2–infected individuals.
Supplementary Data
Supplementary materials are available at Clinical Infectious Diseases online. Consisting of data provided by the authors to benefit the reader, the posted materials are not copyedited and are the sole responsibility of the authors, so questions or comments should be addressed to the corresponding author.
Figure S1. Box plots showing the median values for SARS-CoV-2 viral RNA loads from antigen-positive and -negative results within the 38 rt-PCR-positive results from the Veritor test EUA study. A 2-sample t-test (2-tailed) analysis indicated a significantly higher mean (7.0 log10 cp/ml) for rt-PCR-positive/antigen-positive results compared to that (4.3 log10 cp/mL) for rt-PCR-positive/antigen negative results (P-value < .001).
Figure S2. Relation of the rt-PCR Ct scores for the BD MAX assay, the rt-PCR assay, and the rt-PCR method used in Huang et al (2020) [17] to viral load. Empirical equation for the rt-PCR assay Ct = 42.69–3.14 Log10 copies/mL. Empirical equation for the E target in Huang et al: Log10 copies/mL = 12.377 – 0.052 Ct—0.005 Ct2.
Notes
Author contributions. All authors contributed to the interpretation of the data, critically revised the manuscript for important intellectual content, approved the final version to be published, and agree to be accountable for all aspects of the work.
Acknowledgments. The authors thank the National Institute of Infectious Diseases, Japan, for providing VeroE6TMPRSS2 cells, and acknowledge the Centers for Disease Control and Prevention, BEI Resources, and the National Institute of Allergy and Infectious Diseases, National Institutes of Health for the severe acute respiratory syndrome coronavirus 2 isolate USA-WA1/2020, NR-5228. The authors also thank Karen Eckert (Becton, Dickinson and Company, BD Life Sciences–Diagnostic Systems) for input on the content of this manuscript and editorial assistance, and Stanley Chao (Becton, Dickinson and Company, BD Life Sciences–Diagnostic Systems) for statistical support. The authors are also grateful to the study participants who allowed this work to be performed.
Financial support. This study was funded by Becton, Dickinson and Company, BD Life Sciences–Integrated Diagnostics Solutions. Non-BD employee authors received research funds to support their work for this study.
Potential conflicts of interest. C. K. C., V. P., J. C. A., S. K., J. L., D. S. G., and C. R.-D. are employees of Becton, Dickinson and Company. All other authors report no potential conflicts of interest.
All authors have submitted the ICMJE Form for Disclosure of Potential Conflicts of Interest. Conflicts that the editors consider relevant to the content of the manuscript have been disclosed.
References
- 1. Morawska L, Cao J. Airborne transmission of SARS-CoV-2: the world should face the reality. Environ Int 2020; 139:105730. [DOI] [PMC free article] [PubMed] [Google Scholar]
- 2. McAloon C, Collins Á, Hunt K, et al. Incubation period of COVID-19: a rapid systematic review and meta-analysis of observational research. BMJ Open 2020; 10:e039652. [DOI] [PMC free article] [PubMed] [Google Scholar]
- 3. Griffin JM, Collins AB, Hunt K, et al. A rapid review of available evidence on the serial interval and generation time of COVID-19. medRxiv [Preprint]. 2020. doi: 10.1101/2020.05.08.20095075. [DOI] [PMC free article] [PubMed] [Google Scholar]
- 4. He X, Lau EHY, Wu P, et al. Temporal dynamics in viral shedding and transmissibility of COVID-19. Nat Med 2020; 26:672–5. [DOI] [PubMed] [Google Scholar]
- 5. Byrne AW, McEvoy D, Collins AB, et al. Inferred duration of infectious period of SARS-CoV-2: rapid scoping review and analysis of available evidence for asymptomatic and symptomatic COVID-19 cases. BMJ Open 2020; 10:e039856. [DOI] [PMC free article] [PubMed] [Google Scholar]
- 6. Arons MM, Hatfield KM, Reddy SC, et al. Public Health–Seattle and King County and CDC COVID-19 Investigation Team . Presymptomatic SARS-CoV-2 infections and transmission in a skilled nursing facility. N Engl J Med 2020; 382:2081–90. [DOI] [PMC free article] [PubMed] [Google Scholar]
- 7. Sia SF, Yan LM, Chin AWH, et al. Pathogenesis and transmission of SARS-CoV-2 in golden hamsters. Nature 2020; 583:834–8. [DOI] [PMC free article] [PubMed] [Google Scholar]
- 8. Wolfel R, Corman VM, Guggemos W, et al. Virological assessment of hospitalized patients with COVID-2019. Nature 2020; 581:465–9. [DOI] [PubMed] [Google Scholar]
- 9. La Scola B, Le Bideau M, Andreani J, et al. Viral RNA load as determined by cell culture as a management tool for discharge of SARS-CoV-2 patients from infectious disease wards. Eur J Clin Microbiol Infect Dis 2020; 39:1059–61. [DOI] [PMC free article] [PubMed] [Google Scholar]
- 10. Bullard J, Dust K, Funk D, et al. Predicting infectious SARS-CoV-2 from diagnostic samples. Clin Infect Dis 2020; doi: 10.1093/cid/ciaa638. [DOI] [PMC free article] [PubMed] [Google Scholar]
- 11. Gniazdowski V, Morris CP, Wohl S, et al. Repeat COVID-19 molecular testing: correlation with recovery of infectious virus, molecular assay cycle thresholds, and analytical sensitivity. MedRxiv [Preprint]. 2020. doi: 10.1101/2020.08.05.20168963. [DOI] [Google Scholar]
- 12.Abbott Diagnostics. BinaxNOWCOVID-19 Ag CARD [package insert, EUA]. Scarborough, MA: Abbott Diagnostics, 2020. [Google Scholar]
- 13.LumiraDx Group Ltd. LumiraDx SARS-CoV-2 Ag Test [package insert, EUA]. Alloa, UK: LumiraDx Group Ltd, 2020. [Google Scholar]
- 14.Becton, Dickinson and Company. BD Veritor system for rapid detection of SARS-CoV-2 [package insert, EUA]. Sparks, MD: Becton, Dickinson and Company, 2020. [Google Scholar]
- 15.Quidel Corporation. Sofia SARS Antigen FIA [package insert, EUA]. San Diego, CA: Quidel Corporation, 2020. [Google Scholar]
- 16. Young S, Taylor SN, Cammarata CL, et al. Clinical evaluation of BD Veritor SARS-CoV-2 point-of-care test performance compared to PCR-based testing and versus the Sofia 2 SARS antigen point-of-care test. J Clin Microbiol 2020; doi: 10.1128/JCM.02338-20. [DOI] [PMC free article] [PubMed] [Google Scholar]
- 17. Huang CG, Lee KM, Hsiao MJ, et al. Culture-based virus isolation to evaluate potential infectivity of clinical specimens tested for COVID-19. J Clin Microbiol 2020; 58:e01068-20. [DOI] [PMC free article] [PubMed] [Google Scholar]
- 18. Mina MJ, Parker R, Larremore DB. Rethinking Covid-19 test sensitivity—a strategy for containment. N Engl J Med 2020; doi: 10.1056/NEJMp2025631. [DOI] [PubMed] [Google Scholar]
- 19.Quidel Corporation. Lyra SARS-CoV-2 Assay [package insert, EUA]. Athens, OH: Quidel Corporation, 2020. [Google Scholar]
- 20. Matsuyama S, Nao N, Shirato K, et al. Enhanced isolation of SARS-CoV-2 by TMPRSS2-expressing cells. Proc Natl Acad Sci U S A 2020; 117:7001–3. [DOI] [PMC free article] [PubMed] [Google Scholar]
- 21. Waggoner JJ, Stittleburg V, Pond R, et al. Triplex real-time RT-PCR for severe acute respiratory syndrome coronavirus 2. Emerg Infect Dis 2020; 26:1633–5. [DOI] [PMC free article] [PubMed] [Google Scholar]
- 22. Wickham H. ggplot2: elegant graphics for data analysis. New York: Springer-Verlag, 2016. [Google Scholar]
- 23. R Core Team. R: A language and environment for statistical computing. 2020. Vienna, Austria: R Foundation for Statistical Computing. Available at: https://www.R-project.org/. [Google Scholar]
- 24. La Marca A, Capuzzo M, Paglia T, Roli L, Trenti T, Nelson SM. Testing for SARS-CoV-2 (COVID-19): a systematic review and clinical guide to molecular and serological in-vitro diagnostic assays. Reprod Biomed Online 2020; 41:483–99. [DOI] [PMC free article] [PubMed] [Google Scholar]
- 25. van Kasteren PB, van der Veer B, van den Brink S, et al. Comparison of seven commercial RT-PCR diagnostic kits for COVID-19. J Clin Virol 2020; 128:104412. [DOI] [PMC free article] [PubMed] [Google Scholar]
- 26. Vogels CBF, Brito AF, Wyllie AL, et al. Analytical sensitivity and efficiency comparisons of SARS-CoV-2 RT-qPCR primer-probe sets. Nat Microbiol 2020; 5:1299–305. [DOI] [PMC free article] [PubMed] [Google Scholar]
- 27. Dinnes J, Deeks JJ, Adriano A, et al. Rapid, point-of-care antigen and molecular-based tests for diagnosis of SARS-CoV-2 infection. Cochrane Database System Rev 2020; 8:CD013705. [DOI] [PMC free article] [PubMed] [Google Scholar]
- 28. Centers for Disease Control and Prevention. Duration of isolation and precautions for adults with COVID-19. Figure 5.2020. Available at: https://www.cdc.gov/coronavirus/2019-ncov/hcp/duration-isolation.html. Accessed 11 September 2020.
- 29. Savvides C, Siegel R. Asymptomatic and presymptomatic transmission of SARS-CoV-2: a systematic review. medRxiv [Preprint]. 17 June 2020. doi: 10.1101/2020.06.11.20129072. [DOI] [Google Scholar]
- 30. Larremore DB, Wilder B, Lester E, et al. Test sensitivity is secondary to frequency and turnaround time for COVID-19 surveillance. medRxiv [Preprint]. 27 June 2020. doi: 10.1101/2020.06.22.20136309. [DOI] [PMC free article] [PubMed] [Google Scholar]
- 31. Quicke K, Gallichote E, Sexton N, et al. Longitudinal surveillance for SARS-CoV-2 RNA among asymptomatic staff in five colorado skilled nursing facilities: epidemiologic, virologic and sequence analysis. medRxiv [Preprint]. 9 June 2020. doi: 10.1101/2020.06.08.20125989. [DOI] [Google Scholar]
- 32. van Kampen JJA, van de Vijver DAMC, Fraaij PLA, et al. Shedding of infectious virus in hospitalized patients with coronavirus disease-2019 (COVID-19): duration and key determinants. medRxiv [Preprint]. 9 June 2020. doi: 10.1101/2020.06.08.20125310. [DOI] [PMC free article] [PubMed] [Google Scholar]
- 33. World Health Organization. COVID-19 target product profiles for priority diagnostics to support response to the COVID-19 pandemic version 0.1, released July 31.2020. Available at: https://www.who.int/publications/m/item/covid-19-target-product-profiles-for-priority-diagnostics-to-support-response-to-the-covid-19-pandemic-v.0.1. Accessed 30 October 2020.
- 34. Peiris JS, Chu CM, Cheng VC, et al. HKU/UCH SARS Study Group . Clinical progression and viral load in a community outbreak of coronavirus-associated SARS pneumonia: a prospective study. Lancet 2003; 361:1767–72. [DOI] [PMC free article] [PubMed] [Google Scholar]
- 35. Chan KH, Poon LL, Cheng VC, et al. Detection of SARS coronavirus in patients with suspected SARS. Emerg Infect Dis 2004; 10:294–9. [DOI] [PMC free article] [PubMed] [Google Scholar]
Associated Data
This section collects any data citations, data availability statements, or supplementary materials included in this article.