Abstract
This study aimed to identify significant gene expression profiles of the human lung epithelial cells caused by severe acute respiratory syndrome coronavirus 2 (SARS-CoV-2) infections. We performed a comparative genomic analysis to show genomic observations between SARS-CoV and SARS-CoV-2. A phylogenetic tree has been carried for genomic analysis that confirmed the genomic variance between SARS-CoV and SARS-CoV-2. Transcriptomic analyses have been performed for SARS-CoV-2 infection responses and pulmonary arterial hypertension (PAH) patients’ lungs as a number of patients have been identified who faced PAH after being diagnosed with coronavirus disease 2019 (COVID-19). Gene expression profiling showed significant expression levels for SARS-CoV-2 infection responses to human lung epithelial cells and PAH lungs as well. Differentially expressed genes identification and integration showed concordant genes (SAA2, S100A9, S100A8, SAA1, S100A12 and EDN1) for both SARS-CoV-2 and PAH samples, including S100A9 and S100A8 genes that showed significant interaction in the protein–protein interactions network. Extensive analyses of gene ontology and signaling pathways identification provided evidence of inflammatory responses regarding SARS-CoV-2 infections. The altered signaling and ontology pathways that have emerged from this research may influence the development of effective drugs, especially for the people with preexisting conditions. Identification of regulatory biomolecules revealed the presence of active promoter gene of SARS-CoV-2 in Transferrin-micro Ribonucleic acid (TF-miRNA) co-regulatory network. Predictive drug analyses provided concordant drug compounds that are associated with SARS-CoV-2 infection responses and PAH lung samples, and these compounds showed significant immune response against the RNA viruses like SARS-CoV-2, which is beneficial in therapeutic development in the COVID-19 pandemic.
Keywords: SARS-CoV-2, SARS-CoV, transcriptomic profiling, pulmonary arterial hypertension, COVID-19
Introduction
Coronavirus disease 2019 (COVID-19) is caused by a virus called severe acute respiratory syndrome coronavirus 2 (SARS-CoV-2), which belongs to the Coronaviridae family [1]. The widespread behavior of this virus has immensely influenced the death rate and proved it as the most internecine global epidemic of the 21st century. Angiotensin-converting enzyme 2 (ACE2), which is used by SARS-CoV-2, forms an entrance in host human cells and binds with human ACE2 that eventually leads to the intense spread of this lethal virus among human [2]. Spike protein is considered to be a potential therapeutic target against SARS-CoV-2 [3, 4].
The first severe case of COVID-19 that led to death eventually was indicated on 11 January 2020 [5]. As of 10 September 2020, the number of confirmed COVID-19 cases all over the world is 27 688 740, including 899 315 deaths (https://covid19.who.int/). A large proportion of the total patients of COVID-19 are male (54.3%), where the mortality rate of the elderly patients is higher (15%), compare with younger patients [6]. Due to the rapid spread of COVID-19, the pace of vaccine production has not been able to keep pace with demand. The transference of lethal SARS-CoV-2 from one person to another mostly occurs through respiratory droplet transmission [7]. The prevalence of SARS-CoV-2 is increasing because presymptomatic infectious diseases are difficult to detect [8].
Pulmonary arterial hypertension (PAH) is considered to be a progressive disorder and causes right heart affliction and the arteries of human lungs get affected by PAH as well [9]. Dyspnea, fatigue and chest pain are among the major symptoms of PAH, which is significantly associated with lung vascular scheme and causes premature death [10]. Although early diagnostic therapy can certainly reduce the death rate of PAH [11], COVID-19 has caused many people to suffer from cardiac, age-related and pulmonary diseases, including PAH [12]. Meanwhile, researchers have produced results that demonstrate the activity of SARS-CoV-2 in promoting pulmonary microthrombi, vascular leak through different ways including inflammation, damage of DNA and mitochondrial dysfunction [13, 14]. Based on these studies, PAH can be considered as a major risk factor of COVID-19. Due to the mentioned reasons, it is revealed that there may be a number of pathological compatibility between COVID-19 and PAH. To get an idea of this compatibility, we have tried to identify altered pathways that are common for SARS-CoV-2 infections and PAH-affected samples. To accomplish these tasks, large-scale transcriptomic datasets have been used in this research.
Large-scale microarray datasets are important for uncovering gene expression-based biological information [15]. High-throughput sequencing has immensely influenced the advancement of biomedical research by contributing to the rapidly growing genome sequencing field [16]. High-throughput sequencing-based analysis has already been implemented on SARS-CoV, which has also produce remarkable gene expression results [17].
The significance of the research is that we performed the largest comparative and transcriptomic study against SARS-CoV-2 infection responses to human lung epithelial cells. The potential biomarkers we have been able to figure out have proved the significance in terms of appropriate immune responses. The following analyses attempt to find cell informative pathways and drug compounds based on the transcriptomic analysis on SARS-CoV-2 and PAH. However, initially, the genomic analysis was introduced to identify genomic differences of SARS-CoV and SARS-CoV-2 effect on Homo sapiens. This genomic-level study eventually allows the research to put emphasis on SARS-CoV-2 and the major risk factors. As a result, two datasets (GSE147507 and GSE117261) were selected for the transcriptomic-level study. Hence, the research went through the identification process of finding out differentially expressed genes (DEGs) from GSE147507 and GSE117261. However, similar DEGs were conducted as input data for a further molecular-level study that includes gene ontology (GO) terms identification and predictive analysis on cell informative pathways. The visualization of the protein–protein interactions (PPIs) network is regarded as the focal point of the analysis as hub nodes and significant modules were identified from the PPIs. Herein, transcriptional regulators are also traced based on the similar DEGs of GSE147507 and GSE117261. Finally, potential drug compounds are suggested. The experimental workflow of the ongoing research is presented in Figure 1.
Figure 1.
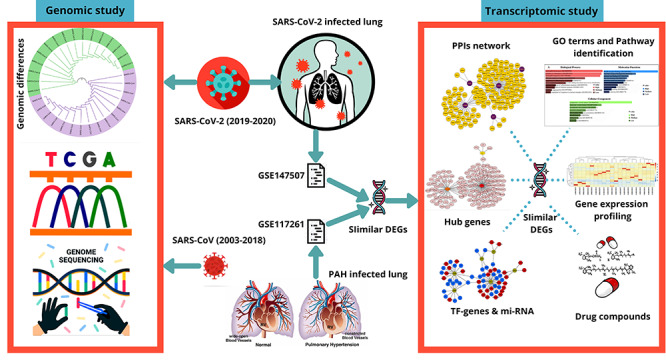
The workflow of current analysis. Genomic differences between SARS-CoV and SARS-CoV-2 are visualized through a phylogenetic analysis. Two datasets GSE147507 and GSE117261 are collected according to SARS-CoV-2 infection in human lung epithelial cells and PAH lung, respectively. Differentially expressed genes (DEGs) were identified using R programming language and similar DEGs were identified from total DEGs of both the datasets. Corresponding similar DEGs were used to perform transcriptomic analyses. The gene expression profiling was performed for both the datasets, and gene ontology (GO) terms, cell informative pathways, PPIs network, hub gene identification and TF–miRNA-based analyses were performed. According to the corresponding similar DEGs, drug compounds were predicted.
Methodology
Comprehensive genomic-level phylogenetic study
Comparison between SARS-CoV and SARS-CoV-2 at the viral genomic level is generated with the collection of a number of genome sequences. The sequences were gathered from the Virus Pathogen Database and Analysis Resource (https://www.viprbrc.org/). A total of 32 sequences were analyzed where SARS-CoV and SARS-CoV-2 both contain 16 sequences, respectively. The sequences for SARS-CoV are as follows: JN247391, JN247392, JN247393, JN247394, JN247395, JN247396, JN247397, GU553363, GU553364, AY274119, MK062179, MK062180, MK062181, MK062182, MK062183 and MK062184. Besides, sequences for SARS-CoV-2 are as follows: MT008022, MT008023, MN988668, MN988669, LC521925, LC522972, LC522973, LC522974, LC522975, MN938385, MN938387, MN938384, MN938388, MN938386, MN938389 and MN938390. According to the sequences, a PHYLIP formatted comprehensive phylogenetic guided tree was designed using Clustal Omega (https://www.ebi.ac.uk/Tools/msa/clustalo/). Clustal Omega contains significant features and exploits comprehensive information based on sequence alignments [18]. The phylogenetic tree was redesigned using the interactive tree of life (iTOL) (https://itol.embl.de/). iTOL provides graphical representations of numerous phylogenetic trees and the representations can be customized [19].
Details information of the datasets
GSE147507 and GSE117261 datasets were assembled from the Gene Expression Omnibus (GEO) database [20]. GEO database provides gene expression-based analysis, which is under the platform of National Center for Biotechnology Information [21]. GSE147507 dataset interprets host responses to SARS-CoV-2 and transcriptional responses in lung epithelium cells. GPL18573 Illumina NextSeq 500 (H. sapiens) platform is utilized for GSE147507 to retrieve the analysis of RNA sequence. The contributor of the GSE147507 dataset was Blanco-Melo et al. [22]. However, the GSE117261 dataset represents transcriptomic analysis and systems biology representation on PAH lung. GPL6244 platform was used for GSE117261 dataset, which is [HuGene-1_0-st] Affymetrix Human Gene 1.0 ST Array [transcript (gene) version]. GSE117261 consists of a total of 83 samples that include PAH lung: 58 samples and control lung: 25 samples.
Data filtering and retrieval of DEGs, and identification of common DEGs between SARS-CoV-2 and PAH
Transcriptomic datasets GSE147507 for SARS-CoV-2 infection in human lung epithelial cells and GSE117261 for PAH lung is used for this research. The initial preprocessing phase of the research goes through the retrieval of DEGs for both datasets. Identification of DEGs for the dataset GSE147507 is achieved with the assistance of the R programming language. Herein, limma [23] and DESeq2 [24] packages of R programming language are used for obtaining DEGs for the GSE147507 dataset. Absolute log2 fold change >1.0 and an adjusted P-value <0.05 were considered as cutoff criteria to determine significant DEGs from the GSE147507 dataset. GEO2R (https://www.ncbi.nlm.nih.gov/geo/geo2r/), which is a web-based platform for the analysis of microarray datasets is used for the identification of DEGs for the GSE117261 dataset. GEO2R performs the analysis in a comparative manner by comparing infected samples versus controlled samples, and the comparison is generated through limma and GEOquery [25] packages from Bioconductor [26] project in the platform of R programming language. Benjamini–Hochberg methodology was implemented for GSE147507 and GSE117261 datasets with the purpose of the false discovery rate controlling [27]. Similar DEGs were also acquired using the R programming language.
GO and cell informative pathways analysis
Gene set enrichment analysis is generally a computational and statistical methodology that defines whether a set of determined genes show statistical significance in different biological conditions [28]. The resources of GO provide structural and computational information considering the gene product-based functions [29, 30]. GO can be categorized into three subsections including molecular function, biological process and cellular component for annotation of gene products [31]. GO terms for the current study are obtained using Enrichr (https://amp.pharm.mssm.edu/Enrichr/) platform. Enrichr is a web-based program that contains large gene sets consisting of 102 libraries and performs experiments that are genome based [32]. For cell informative pathway analysis, Kyoto Encyclopedia of Genes and Genomes (KEGG) [33], Reactome [34], WikiPathways [35] and BioCarta databases are employed. The results from the databases are also implemented using the Enrichr platform.
Designing of PPIs network
Prominent information about the functions of protein is achieved with the analysis of protein interactions, which is regarded as the primary step in drug discovery and systems biology [36]. The number of complex biological processes is determined with the advanced study of PPIs networks [37, 38]. Identified similar DEGs for SARS-CoV-2 and PAH lung were provided as an input in InnateDB [39] using the NetworkAnalyst (https://www.networkanalyst.ca/) web-based platform. Numerous omics data analysis is achieved through a visual representation of NetworkAnalyst platform including complex PPIs network [40]. The network was further designed using Cytoscape (https://cytoscape.org/). Cytoscape software can be regarded as a prominent source in integrating protein interactions and genetic interactions [41].
Establishment of the topological algorithm on the PPIs network and detection of hub nodes
Hub nodes generally defined by the highly interconnected nodes in a large-scale complex PPIs network [42]. The hub nodes for the current research are determined by the degree topological algorithm. The degree algorithm is applied to the PPIs network using a plugin of Cytoscape software, which is cytoHubba (http://apps.cytoscape.org/apps/cytohubba). cytoHubba is a comprehensive plugin of Cytoscape software that consists of 11 topological algorithms to rank the nodes in a specific network [43]. In the areas where the hub genes are highly interconnected, these areas are regarded as prominent modules from the PPIs network. Distinguishing the modules from the PPIs network will provide better visualization of the hub nodes in separated modules. For specific module analyses for the corresponding PPIs network is generated by ClusterViz (http://apps.cytoscape.org/apps/clusterviz), which is also a Cytoscape plugin. Cluster identification and detection of functional modules from a number of networks, including PPIs network, metabolic network and gene network, are determined by ClusterViz plugin [44].
Analysis of TF–miRNA co-regulatory network
RegNetwork repository was used to generate the analysis of the TF–miRNA co-regulatory network [45]. The miRNAs and TFs are identified from the co-regulatory network, which is responsible for the regulation of DEGs at transcriptional and posttranscriptional levels. The visualization of the network was provided using NetworkAnalyst web-based platform. For system-level data understanding, NetworkAnalyst has been used as a leading bioinformatics tool as a demand of immensely growing gene expression-based datasets [46, 47].
Therapeutic drug compounds prediction
According to similar DEGs, a number of drug compounds are predicted from the Drug Signatures Database (DSigDB) using the Enrichr platform. DSigDB consists of gene sets: 22 527, gene: 19 531 and unique compound: 17 389 [48]. DSigDB predominantly predicts drugs on gene expression-based datasets and each set of the gene are regarded as targeted genes considering a compound [48]. Performing genome-based characterization including RNA, DNA and protein-based biomedical, pharmacological and biological information can be gathered with more accuracy and at an inexpensive post using the Enrichr web-platform [49].
Results
Genomic and phylogram differences between SARS-CoV and SARS-CoV-2
Genomic differences are observed through phylogenetic analysis of SARS-CoV and SARS-CoV-2. The 16 genome sequences for SARS-CoV are the sequences from the year 2003 to 2018 and the host responses were for humans. However, another 16 genome sequence sample for SARS-CoV-2 are the sequences from the year 2019 to 2020 and host responses were for humans as well. The result of the phylogenetic analysis shows that SARS-CoV and SARS-CoV-2 do not produce any clade between them, but the samples share ancestral origin among themselves. This distinguishes SARS-CoV and SARS-CoV-2 at the genomic level. Phylogenetic visualization of SARS-CoV and SARS-CoV-2 genome sequences are displayed in Figure 2.
Figure 2.
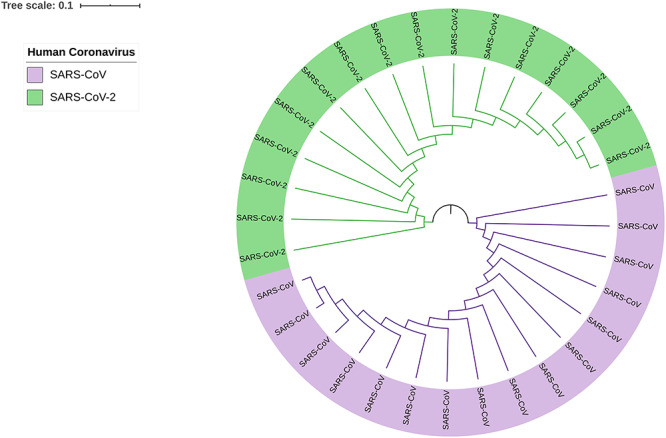
Phylogram of SARS-CoV and SARS-CoV-2, which provides genomic differences between human coronaviruses of 2003–2018 (SARS-CoV) and 2019–2020 (SARS-CoV-2). Two colors are implemented to differentiate SARS-CoV (purple) and SARS-CoV-2 (green).
Gene expression analysis of PAH patients and SARS-CoV-2 infected human lung epithelial and associative cells
Form the GSE147507 dataset, 24 samples were filtered, and those samples were involved with SARS-CoV-2 infection to primary human bronchial epithelial cells, lung adenocarcinoma and lung biopsy cells. The gene expression of the top 20 genes from the selected samples has been visualized in Figure 3, which provides the report of the high expression profile of S100A9 and KRT5 gene. Besides, among all 83 samples of PAH lung and healthy controls, characterization of gene expression is presented for 20 samples including three healthy controls (GSM3290083, GSM3290086 and GSM3290085), and the remaining of them are PAH samples. Differentiating PAH samples and healthy controls provide evidence of distinct groups of PAH samples according to hierarchical clustering and comparing both samples at RNA level provides different infection response of PAH sample compared with healthy controls (Figure 4A). A volcano plot is visualized and the adjusted P-value <0.05 is considered, which showed the upregulated and downregulated genes that have been identified through a comparative analysis between PAH samples and normal samples for the GSE117261 dataset (Figure 4B).
Figure 3.
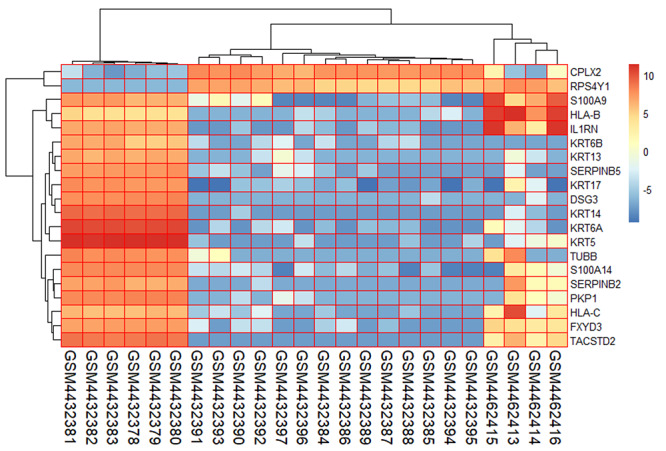
Gene expression profiling of SARS-CoV-2 infection in human lung epithelial cells for the top 20 genes and selected 24 samples from the GSE147507 dataset.
Figure 4.
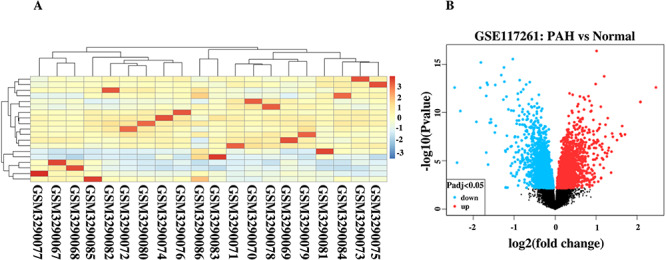
(A) Gene expression visualization of healthy controls (GSM3290083, GSM3290086 and GSM3290085) and PAH samples. (B) Volcano plot shows the regulation of genes (upregulated and downregulated) for GSE117261.
Common DEGs identifications for further molecular analysis and ensuring the efficiency of predictive drugs
For SARS-CoV-2 infection responses to human lung epithelial cells observation, the DEGs of dataset GSE147507 is identified. Regarding the analysis, a total of 108 DEGs were found. Notably, 93 DEGs show upregulation and the remaining 15 DEGs show downregulation. However, comparison analysis between PAH lung and healthy controls for GSE117261 shows a total of 59 DEGs, of which 27 DEGs show upregulation and another 32 DEGs show downregulation. Comparing SARS-CoV-2 infection responses and PAH samples, six DEGs (SAA2, S100A9, S100A8, SAA1, S100A12 and EDN1) manifest concordance, which is used for identifying GO terms and pathway results, PPIs network, hub nodes and module identification and TF–miRNA regulation and prediction of drug compounds. The concordance produced from the comparison between these two datasets is visualized using a Venn diagram (Figure 5A). The heat map regarding the log fold change for the shared common genes between SARS-CoV-2 and PAH showed unparalleled transcriptional signature impelled upon SARS-CoV-2 infection (Figure 5B). The gene validation is provided according to the risk groups of the genes in a heat map that provides information regarding S100A9 and S100A8 that are highly prone to inflammation (Figure 6A). The boxplot of the risk group comparison also indicates that S100A9 and S100A8 are highly risked prone (Figure 6B).
Figure 5.
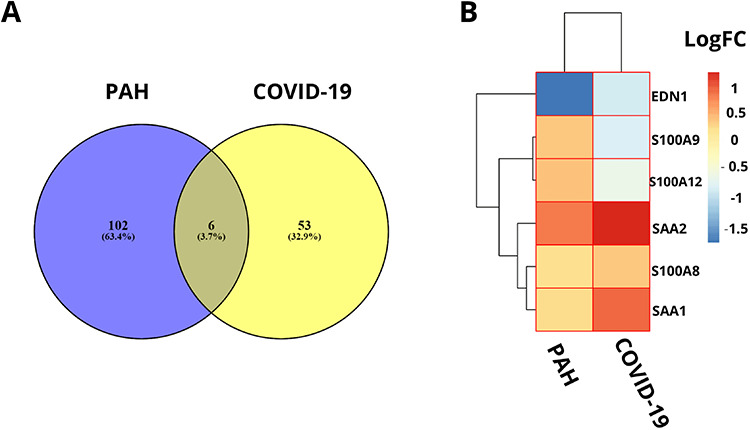
(A) Concordant gene identification between GSE147507 and GSE117261 dataset that provide evidence of six common differentially expressed genes in between 108 genes of GSE147507 (COVID-19) and 59 genes of GSE117261 (PAH) dataset. (B) Heat map according to the log fold changes for the shared common DEGs between COVID-19 dataset and PAH dataset.
Figure 6.
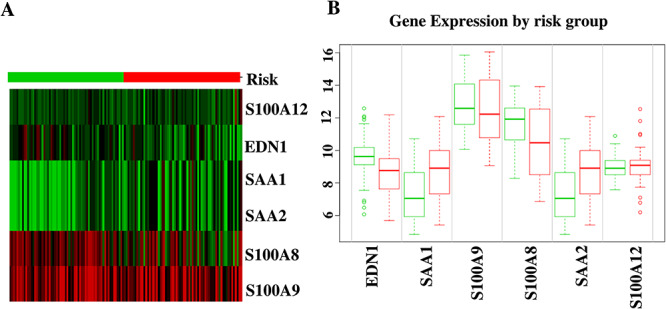
(A) Heat map for the identification of highly risk prone nature of S100A9 and S100A8 genes. (B) Risk group comparisons between the shared common genes of SARS-CoV-2 and PAH.
GO and pathway analysis based on the similar DEGs
After the identification of unique DEGs aligned with SARS-CoV-2 infection profile to lung epithelial cells, a number of databases (KEGG, Reactome, WikiPathways, BioCarta and The GO) were utilized to identify GO terms and cell informative pathways. Among all the GO terms, the top 10 biological processes, cellular components and molecular functions were predicted (Table 1). Analysis of biological processes provides neutrophil chemotaxis, granulocyte chemotaxis and regulation of inflammatory responses to SARS-CoV-2 infections according to the number of genes interaction. Molecular function regarding studies show enrichment of calcium ion binding, zinc ion binding, transition metal ion binding and metal ion binding factors. Cytoplasmic vesicle lumen cellular component factor is significantly involved with the corresponding identified DEGs, which eventually refer to SARS-CoV-2 infection responses to the human lung. Notably, top pathways based on the DEGs were allied in the current study (Table 2). IL-17 signaling pathway, TNF signaling pathway and Vitamin B12 metabolism are among the top pathways that were identified through the analysis of the curated databases. The comparison of GO terms is represented in Figure 7A, and the comparison of pathways from numerous databases is provided in Figure 7B.
Table 1.
The association of concordant genes in GO terms and GO pathways and the proportional P-values
| Category | GO ID | Term | P-value | Genes |
|---|---|---|---|---|
| GO biological process | GO:0030593 | Neutrophil Chemotaxis | 6.563(e-10) | SAA1, S100A12, S100A9, S100A8 |
| GO:0071621 | Granulocyte Chemotaxis | 8.230(e-10) | SAA1, S100A12, S100A9, S100A8 | |
| GO:1990266 | Neutrophil Migration | 9.506(e-10) | SAA1, S100A12, S100A9, S100A8 | |
| GO:0050832 | Defense response to fungus | 1.018(e-8) | S100A12, S100A9, S100A8 | |
| GO:0050727 | Regulation of inflammatory response | 6.777(e-8) | SAA1, S100A12, S100A9, S100A8 | |
| GO:0051091 | Positive regulation of sequence-specific DNA-binding transcription factor activity | 1.915(e-7) | EDN1, S100A12, S100A9, S100A8 | |
| GO:0050729 | Positive regulation of inflammatory response | 9.257(e-7) | S100A12, S100A9, S100A8 | |
| GO:0031349 | Positive regulation of defense response | 9.647(e-7) | S100A12, S100A9, S100A8 | |
| GO:0070486 | Leukocyte aggregation | 0.000001574 | S100A9, S100A8 | |
| GO:0032103 | Positive regulation of response to external stimulus | 0.000001745 | S100A12, S100A9, S100A8 | |
| GO molecular function | GO:0050786 | RAGE receptor binding | 1.259(e-9) | S100A12, S100A9, S100A8 |
| GO:0035325 | Toll-like receptor binding | 0.000002697 | S100A9, S100A8 | |
| GO:0005509 | Calcium ion binding | 0.00005490 | S100A12, S100A9, S100A8 | |
| GO:0008270 | Zinc ion binding | 0.00006592 | S100A12, S100A9, S100A8 | |
| GO:0046914 | Transition metal ion binding | 0.0001507 | S100A12, S100A9, S100A8 | |
| GO:0046872 | Metal ion binding | 0.0002040 | S100A12, S100A9, S100A8 | |
| GO:0008017 | Microtubule binding | 0.001383 | S100A9, S100A8 | |
| GO:0015631 | Tubulin binding | 0.002348 | S100A9, S100A8 | |
| GO:0005507 | Copper ion binding | 0.01224 | S100A12 | |
| GO cellular component | GO:0060205 | Cytoplasmic vesicle lumen | 2.453(e-8) | SAA1, S100A12, S100A9, S100A8 |
| GO:0071682 | Endocytic vesicle lumen | 0.005388 | SAA1 | |
| GO:0005881 | Cytoplasmic microtubule | 0.01135 | SAA1 | |
| GO:0034774 | Secretory granule lumen | 0.00007614 | S100A12, S100A9, S100A8 | |
| GO:0045111 | Intermediate filament cytoskeleton | 0.02111 | S100A8 | |
| GO:0005856 | Cytoskeleton | 0.0003296 | S100A12, S100A9, S100A8 | |
| GO:0030139 | Endocytic vesicle | 0.03197 | SAA1 | |
| GO:0005874 | Microtubule | 0.06138 | SAA1 |
Table 2.
The association of concordant genes in KEGG, WikiPathways, Reactome and BioCarta databases and the proportional P-values
| Databases | Pathways | P-value | Genes |
|---|---|---|---|
| KEGG | Interleukin 17 (IL-17) signaling pathway | 0.0003170 | S100A9, S100A8 |
| Renin secretion | 0.02052 | EDN1 | |
| Hypertrophic cardiomyopathy (HCM) | 0.02523 | EDN1 | |
| AGE–RAGE signaling pathway in diabetic complications | 0.02963 | EDN1 | |
| HIF-1 signaling pathway | 0.02963 | EDN1 | |
| Melanogenesis | 0.02992 | EDN1 | |
| Tumor necrosis factor (TNF) signaling pathway | 0.03255 | EDN1 | |
| Relaxin signaling pathway | 0.03838 | EDN1 | |
| Vascular smooth muscle contraction | 0.03896 | EDN1 | |
| Fluid shear stress and atherosclerosis | 0.04099 | EDN1 | |
| WikiPathways | Vitamin B12 metabolism WP1533 | 0.00009129 | SAA1, SAA2 |
| Folate metabolism WP176 | 0.0001595 | SAA1, SAA2 | |
| IL1 and megakaryocytes in obesity WP2865 | 0.007179 | S100A9 | |
| Physiological and pathological hypertrophy of the heart WP1528 | 0.007477 | EDN1 | |
| Selenium micronutrient network WP15 | 0.0002711 | SAA1, SAA2 | |
| Endothelin pathways WP2197 | 0.009860 | EDN1 | |
| Photodynamic therapy-induced HIF-1 survival signaling WP3614 | 0.01105 | EDN1 | |
| Melatonin metabolism and effects WP3298 | 0.01105 | EDN1 | |
| Prostaglandin synthesis and regulation WP98 | 0.01343 | EDN1 | |
| Vitamin D receptor pathway WP2877 | 0.001206 | S100A9, S100A8 | |
| Reactome | Advanced glycosylation endproduct receptor signaling H. sapiens R-HSA-879415 | 0.000005841 | SAA1, S100A12 |
| DEx/H-box helicases activate type I IFN and inflammatory cytokines production H. sapiens R-HSA-3134963 | 0.000005841 | SAA1, S100A12 | |
| Scavenging by Class B receptors H. sapiens R-HSA-3000471 | 0.001499 | SAA1 | |
| RIP-mediated NFkB activation via ZBP1 H. sapiens R-HSA-1810476 | 0.00001571 | SAA1, S100A12 | |
| TRAF6-mediated NF-kB activation H. sapiens R-HSA-933542 | 0.00002064 | SAA1, S100A12 | |
| ZBP1(DAI)-mediated induction of type I IFNs H. sapiens R-HSA-1606322 | 0.00002430 | SAA1, S100A12 | |
| TAK1 activates NFkB by phosphorylation and activation of IKKs complex H. sapiens R-HSA-445989 | 0.00002430 | SAA1, S100A12 | |
| Formyl peptide receptors bind formyl peptides and many other ligands H. sapiens R-HSA-444473 | 0.002398 | SAA1 | |
| Cytosolic sensors of pathogen-associated DNA H. sapiens R-HSA-1834949 | 0.0001595 | SAA1, S100A12 | |
| TRAF6-mediated induction of proinflammatory cytokines H. sapiens R-HSA-168180 | 0.0001899 | SAA1, S100A12 | |
| BioCarta | G-protein signaling through tubby proteins H. sapiens h tubbyPathway | 0.002997 | EDN1 |
| Activation of PKC through G-protein-coupled receptors H. sapiens h pkcPathway | 0.003296 | EDN1 | |
| Hypoxia-inducible factor in the cardiovascular system H. sapiens h hifPathway | 0.004791 | EDN1 | |
| Cystic fibrosis transmembrane conductance regulator (CFTR) and beta 2 adrenergic receptor (b2AR) pathway H. sapiens h cftrPathway | 0.005986 | EDN1 | |
| Corticosteroids and cardioprotection H. sapiens h gcrPathway | 0.007477 | EDN1 | |
| Beta-arrestins in GPCR desensitization H. sapiens h bArrestinPathway | 0.008372 | EDN1 | |
| Activation of cAMP-dependent protein kinase, PKA H. sapiens h gsPathway | 0.008670 | EDN1 | |
| Role of beta-arrestins in the activation and targeting of MAP kinases H. sapiens h barr-mapkPathway | 0.008967 | EDN1 | |
| Role of EGF receptor transactivation by GPCRs in cardiac hypertrophy H. sapiens h cardiacegfPathway | 0.009860 | EDN1 | |
| Roles of beta-arrestin-dependent recruitment of Src kinases in GPCR signaling H. sapiens h bArrestin-srcPathway | 0.01016 | EDN1 |
Figure 7.
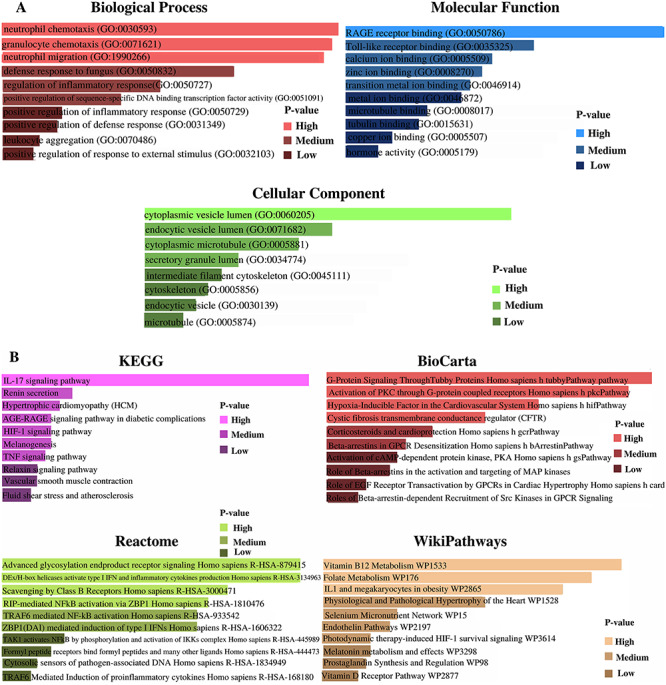
(A) GO terms regarding biological process, molecular function and cellular component according to the associative P-values. (B) Cell informative pathways (KEGG, BioCarta, Reactome and WikiPathways) analysis result regarding associative P-values.
PPIs network construction to perceive hub nodes
Using the NetworkAnalyst platform, six DEGs (SAA2, S100A9, S100A8, SAA1, S100A12 and EDN1) were provided as input and the generated network file was further customized in Cytoscape. The representation of the PPIs network shows immense interaction of S100A9 and S100A8 genes, and the interaction reveals the evidence of enrichment of S100A9 and S100A8 genes to SARS-CoV-2 responses in the human lung. Hub gene identification, module analysis and prediction of effective drug compounds are mainly concerned with the corresponding PPIs network. The PPIs network is represented in Figure 8, with customized visualization that contains 125 nodes and 136 edges.
Figure 8.
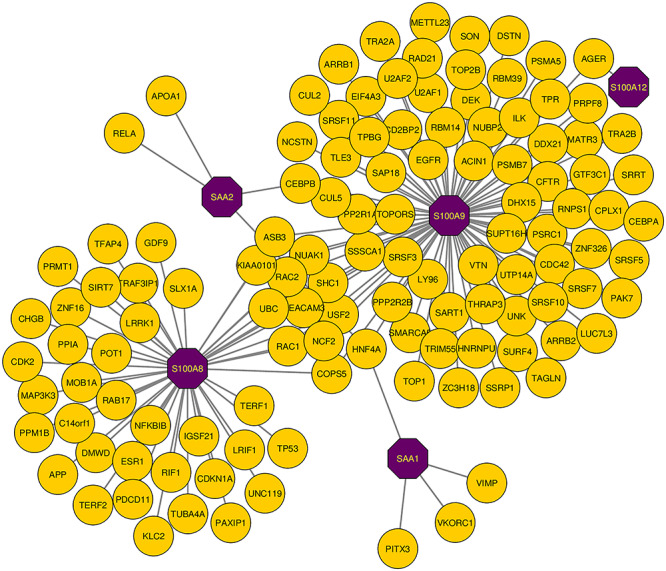
PPIs network for identified common DEGs that refers to SARS-CoV-2 infections in human lung and PAH lung. The common genes are highlighted with purple node (SAA2, S100A9, S100A8, SAA1 and S100A12). The network consists of 125 nodes and 136 edges.
Hub nodes identification based on the topological analyses and module detection from the PPIs network
Among the similar DEGs, hub nodes from the PPIs network are identified using cytoHubba. The identified top three hub nodes are S100A9, S100A8 and SAA1. The degree algorithm was used for the identification purpose and the degree algorithm shows the highest number of interaction in a specific network. The highlighted hub genes in a hub node identification network are presented in Figure 9, and the network consists of 124 nodes and 135 edges. The regions where the hub nodes are established in the PPIs network are considered as the prominent modules. Module analysis network is represented in Figure 10, which consists of 13 nodes and 13 edges. Topological analysis results for the top three hub genes are presented in Table 3.
Figure 9.
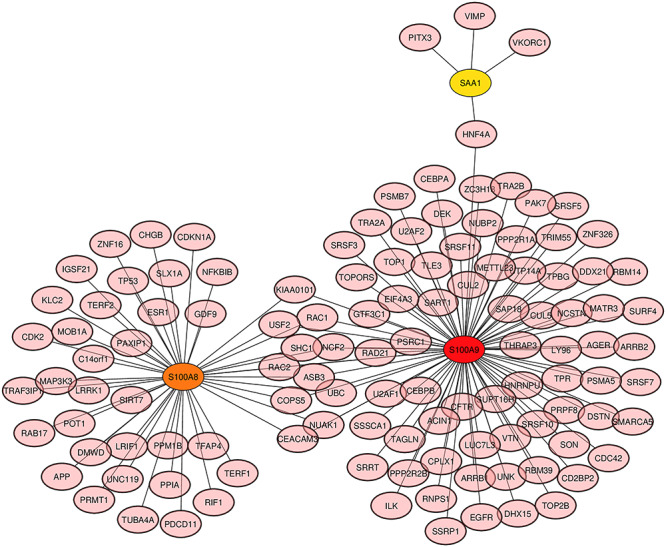
Hub gene detection from the similar DEGs based on the PPIs network. The highlighted nodes S100A9 (red), S100A8 (orange) and SAA1 (yellow) are regarded as highly interconnected nodes, considered as hub nodes. The network is made up of 124 nodes and 135 edges.
Figure 10.
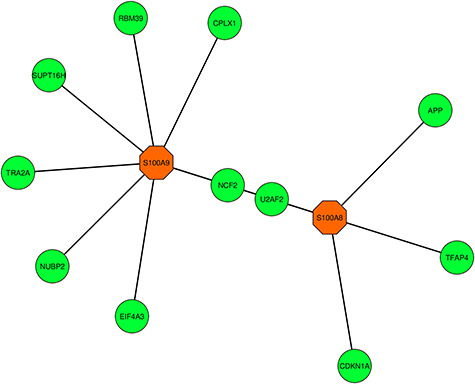
Highly interconnected regions (module) identification network that consists of 13 nodes and 13 edges. The hub genes S100A9 (orange) and S100A8 (orange) are visualized in the corresponding module network.
Table 3.
Exploration of topological results for top three hub genes
| Hub gene | Degree | Stress | Closeness centrality | Betweenness centrality |
|---|---|---|---|---|
| S100A9 | 83 | 14 008 | 102.66667 | 13 258 |
| S100A8 | 45 | 7370 | 82.75 | 7117 |
| SAA1 | 4 | 738 | 41.5 | 732 |
Analysis of TF–miRNA co-regulatory network
TFs and miRNAs interaction with the DEGs can be regarded as a reason for the regulation of expression of the DEGs. The co-regulatory network of TF–miRNA interaction is generated using the NetworkAnalyst platform, and the network is reintroduced in Cytoscape software for better visualization. TF–miRNA co-regulatory network includes 69 nodes and 77 edges. Of the 69 genes, six are similar DEGs, 35 are TF genes and 28 are miRNAs. The customized representation of the TF–miRNA co-regulatory network is presented in Figure 11.
Figure 11.
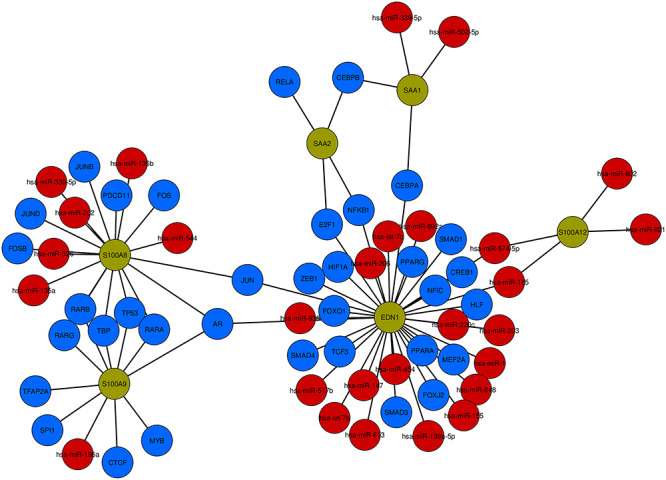
TF–miRNA co-regulatory network visualization. The network includes 69 nodes and 77 edges. According to the network, there exist 35 TF genes (blue) and 28 are miRNAs (red) and they are interacted with six common DEGs (green).
Predictive drug compounds
The drug compounds were proposed from the DSigDB database using the Enrichr web platform. The drug compounds were predicted according to identified six DEGs (SAA2, S100A9, S100A8, SAA1, S100A12 and EDN1). The results were accomplished based on adjusted P-value and P-value scores. MIGLITOL CTD 00002031 and metoprolol HL60 UP are the two prominent drug compounds with which a significant amount of genes are connected. Besides, among the top hub genes, S100A9 is interconnected with both the drug compounds, which makes the drug compounds even more eminent in terms of the efficiency of the drugs. The predictive drug compounds are presented in Table 4.
Table 4.
Predictive drug compounds according to the concordant genes of SARS-CoV-2 and PAH samples
| Name of drugs | P-value | Adjusted P-value | Genes |
|---|---|---|---|
| MIGLITOL CTD 00002031 | 0.000004943 | 0.01990 | S100A12, S100A9 |
| Bosentan CTD 00003071 | 0.003296 | 0.5529 | EDN1 |
| Coenzyme Q10 CTD 00001167 | 0.003595 | 0.5789 | EDN1 |
| Metoprolol HL60 UP | 0.00007383 | 0.04954 | S100A12, S100A9 |
| 9-(2-Phosphonomethoxypropyl)adenine CTD 00003259 | 0.004193 | 0.5821 | EDN1 |
| (+)-Chelidonine HL60 DOWN | 0.00009129 | 0.05250 | S100A9, S100A8 |
| Sildenafil CTD 00003367 | 0.004492 | 0.6028 | EDN1 |
| Norepinephrine CTD 00006417 | 0.00009879 | 0.04972 | S100A9, S100A8 |
| Dydrogesterone CTD 00005882 | 0.004791 | 0.6028 | EDN1 |
| 1,3-Dimethylthiourea CTD 00001818 | 0.004791 | 0.5845 | EDN1 |
Discussion
Recent studies have demonstrated the effect of SARS-CoV-2 in human lungs and create complexity in the functioning of the human lungs that eventually leads to diseases like PAH. The following study attempts to identify genomic differences between SARS-CoV and SARS-CoV-2 and also signify transcriptomic effects of SARS-CoV-2 to the PAH through a number of bioinformatics approaches. As SARS-CoV-2 is having a lethal effect on humankind, the current research can be regarded as the most comprehensive transcriptomic and genomic research on novel coronavirus to date.
According to the GO terms, inflammatory responses are detected that dominate infection responses to SARS-CoV-2. In the biological process, neutrophil chemotaxis, granulocyte chemotaxis, neutrophil migration and regulation of inflammatory responses are among the top GO terms. During the infection of SARS-CoV-2 in the human lung, neutrophil chemotaxis term induces uncontrolled inflammation due to proinflammatory cytokine [50]. The term granulocyte chemotaxis show immensely upregulated inflammatory response in human lung epithelial cell [51]. After molecular function identification, receptor for advanced glycation end products (RAGE) receptor binding, calcium ion binding and zinc ion binding can be considered as the most significant terms. RAGE performs as a mediator and biomarker in terms of inflammatory illness during SARS-CoV-2 [52]. The top cellular components are cytoplasmic vesicle lumen, secretory granule lumen and cytoskeleton. Cell informative pathway identification with the screening of unbiased database methodology shows inflammatory responses to SARS-CoV-2. IL-17 signaling pathway is identified from the KEGG database. IL-17 is a member of a cytokine family that shows correlation and cytokine storm with SARS-CoV-2 [53, 54]. In molecules of PAH, highly expressed and meaningful hypomethylation of IL-17 responses were identified [55]. A recent study found that the TNF signaling pathway was found in the infection of SARS-CoV-2 in the lung epithelial cells of the human [56].
PPIs network designing reveals the proteomic information regarding SARS-CoV-2 and PAH. The PPIs network shows 136 interactions among 125 genes. The analysis was generated for six common DEGs (SAA2, S100A9, S100A8, SAA1, S100A12 and EDN1), and the highly interconnected nodes and regions show effective prediction on S100A9 and S100A8. S100 calcium-binding protein A9 (S100A9) and S100 calcium-binding protein A8 (S100A8), both genes are associated with the respiratory disorder or lung diseases [57]. Studies have found a number of immunocytochemical responses of S100A9 and S100A8 in PAH lung samples [58]. According to the hub nodes, highly interconnected modules were also identified from the PPIs network.
In a number of solutions to complex diseases, regulatory biomolecules perform as potential biological markers. The regulation regarding six common DEGs is justified with the analysis of the TF–miRNA co-regulatory network by measuring the performance of TF-genes and miRNAs in that specific network. A total of 28 miRNAs and 35 TF-genes interactions are visualized with the six common DEGs. The analysis of TF-genes shows androgen receptor (AR) has the most interaction comparing with other TF-genes. TMPRSS2 gene is considered to be an active promoter for spike protein of SARS-CoV-2, and AR is used as a required factor for transcription of the TMPRSS2 gene [59].
Drug compounds are suggested for six common DEGs from the prediction of the DSigDB database. Significantly, prominent top 10 drugs were identified for the following study. MIGLITOL CTD 00002031, Bosentan CTD 00003071, Coenzyme Q10 CTD 00001167, metoprolol HL60 UP, chelidonine HL60 DOWN, sildenafil CTD 00003367, norepinephrine CTD 00006417, dydrogesterone CTD 00005882 and 1,3-Dimethylthiourea CTD 00001818 are among the significant candidate drugs form the current prediction. Recent studies have presented the efficient activity of MIGLITOL against RNA viruses. MIGLITOL showed significant performance as an inhibitor against the spike protein (S1) of the SARS-CoV-2 virus. This result was identified using the study of molecular dynamics and virtual screening of MIGLITOL and also a number of approved drugs [60]. The effect of the coenzyme Q10 drug compound can be supportive for COVID-19 patients as it increases energy level, immunity and reduce oxidative stress among patients. One of the major symptoms of COVID-19 is fatigue, and coenzyme Q10 has shown significant potential to reduce the fatigue and pain in fibromyalgia patients [61]. Recent studies have predicted that sildenafil is suitable for COVID-19 infected patients as the principal role of sildenafil is to inhibit the neointimal formation and aggregation of platelet [62]. Adult persons are more at risk due to COVID-19 disease, and norepinephrine is suggested for infected adult persons with shock [63].
The identified DEGs show inflammatory and cytokine responses and association with a number of pathways and which generally refers to SARS-CoV-2 infection in human lung epithelial cells and PAH affected lungs. The transcriptomic result produced in this research is for limited samples regarding both SARS-CoV-2 and PAH. The larger number of samples would produce a significant amount of concordant genes, which will definitely produce a large transcriptomic response in near future.
Conclusions
In this study, biological domains, regulatory elements and identified biomarkers had been discussed in brief that is expected to accelerate the pace of therapeutics development against the ongoing COVID-19 pandemic. The superiority of our study can be considered as it is by far the largest genomic and transcriptomic study on SARS-CoV-2. We provided multiple ways of analyses including comparative genomic differences of SARS-CoV and SARS-CoV-2, and the difference has been made to look for transcriptomic analyses on SARS-CoV-2 and its PAH comorbidity condition. Phylogenetic analyses of this research have produced genomic differences between SARS-CoV and SARS-CoV-2. We have identified the concordant genes between SARS-CoV-2 and PAH that produce further molecular results and show the association of the DEGs in SARS-CoV-2 affected human lung epithelial cells and PAH patients’ lung. A different type of transcriptional response was found due to the SARS-CoV-2 infection in human lung epithelial cells, which is enriched in inflammatory responses and neutrophil chemotaxis. The predicted drug compounds show activity against inflammatory responses against RNA viruses.
Key Points
Phylogenetic analysis showed genomic differences between SARS-CoV and SARS-CoV-2.
Transcriptomic gene expression provided inflammatory responses in SARS-CoV-2-infected human lung epithelial cells and PAH patients.
The development of the PPIs network detected the interactions for the identified shared genes between the COVID-19 and PAH.
Topological analysis of the PPIs network showed the highly interconnected nodes and extracted specific genes from the concordant genes.
The predictive drug compounds highlighted activity against inflammatory responses that are identified with SARS-CoV-2 infection responses and the pathways indicate molecular information for both SARS-CoV-2 and PAH.
Acknowledgment
The authors thank the Science and Technology Unit at Umm Al-Qura University for their continued logistics support.
Tasnimul Alam Taz is currently pursuing BSc in Software Engineering from the Department of Software Engineering, Daffodil International University. His research interest encircles systems biology, machine learning and artificial intelligence.
Kawsar Ahmed is serving as an Assistant Professor and Director of research team ‘Group of Bio-photomatiχ’ in the Department of Information and Communication Technology (ICT) at Mawlana Bhashani Science and Technology University, Tangail, Bangladesh. His research interests include sensor design, bio-photonics, nanotechnology, data mining and bioinformatics.
Bikash Kumar Paul is Lecturer and member of research group ‘Group of Bio-photomatiχ’ in the Department of ICT at Mawlana Bhashani Science and Technology University, Bangladesh. His current research interests are the SPR-based sensors, biophotonics and bioinformatics.
Fahad Ahmed Al-Zahrani is a Professor of Computer Engineering Department at Umm Al-Qura University. He received his PhD in Computer Engineering from Colorado State University. His research interests include high-speed network protocols, sensor networks, optical networks, performance evaluation, IOT, and blockchain architecture and performance analysis.
S. M. Hasan Mahmud is serving as a Faculty in the Department of Software Engineering, Daffodil International University. His research interests include machine learning, deep learning, bioinformatics, drug discovery and pattern recognition.
Mohammad Ali Moni is a Research Fellow and Conjoint Lecturer at the University of New South Wales (UNSW), Australia. Before joining to the UNSW, he was a Vice-Chancellor fellow of the University of Sydney. He received his PhD in Clinical Bioinformatics, Health Informatics and Machine Learning from the University of Cambridge. His research interests encompass artificial intelligence, machine learning, data science, medical image processing and clinical bioinformatics.
Contributor Information
Tasnimul Alam Taz, Department of Software Engineering, Daffodil International University, Bangladesh.
Kawsar Ahmed, Department of Information and Communication Technology (ICT) at Mawlana Bhashani Science and Technology University, Tangail, Bangladesh.
Bikash Kumar Paul, Department of ICT at Mawlana Bhashani Science and Technology University, Bangladesh.
Fahad Ahmed Al-Zahrani, Computer Engineering Department at Umm Al-Qura University, Saudi Arabia.
S M Hasan Mahmud, Department of Software Engineering, Daffodil International University, Bangladesh.
Mohammad Ali Moni, University of New South Wales (UNSW), Australia.
Funding
The work is funded by National Science, Technology and Innovation Plan (MAARIFAH), the King Abdul-Aziz City for Science and Technology (KACST), Kingdom of Saudi Arabia (grant number 12-INF2970-10).
Conflict of Interest
All the authors have read the manuscript and approved this for submission as well as no competing interests.
References
- 1. Coronaviridae Study Group of the International Committee on Taxonomy of Viruses . The species severe acute respiratory syndrome-related coronavirus: classifying 2019-nCoV and naming it SARS-CoV-2. Nat Microbiol 2020;5(4):536. [DOI] [PMC free article] [PubMed] [Google Scholar]
- 2. Walls AC, Park YJ, Tortorici MA, et al. Structure, function, and antigenicity of the SARS-CoV-2 spike glycoprotein. Cell 2020;181(2):281–92. [DOI] [PMC free article] [PubMed] [Google Scholar]
- 3. Chi X, Yan R, Zhang J, et al. A neutralizing human antibody binds to the N-terminal domain of the spike protein of SARS-CoV-2. Science 2020;369(6504):650–5. [DOI] [PMC free article] [PubMed] [Google Scholar]
- 4. Oany AR, Mia M, Pervin T, et al. Design of novel viral attachment inhibitors of the spike glycoprotein (S) of severe acute respiratory syndrome coronavirus-2 (SARS-CoV-2) through virtual screening and dynamics. Int J Antimicrob Agents 2020;56(6):106177. [DOI] [PMC free article] [PubMed] [Google Scholar]
- 5. Al-Awadhi AM, Al-Saifi K, Al-Awadhi A, et al. Death and contagious infectious diseases: impact of the COVID-19 virus on stock market returns. J Behav Exp Financ 2020;27:100326. [DOI] [PMC free article] [PubMed] [Google Scholar]
- 6. Nain Z, Rana HK, Liò P, et al. Pathogenetic profiling of COVID-19 and SARS-like viruses. Brief Bioinform 2020;. 10.1093/bib/bbaa173. [DOI] [PMC free article] [PubMed] [Google Scholar]
- 7. Mackenzie JS, Smith DW. COVID-19: a novel zoonotic disease caused by a coronavirus from China: what we know and what we don’t. Microbiol Aust 2020;41(1):45–50. [DOI] [PMC free article] [PubMed] [Google Scholar]
- 8. Ferretti L, Wymant C, Kendall M, et al. Quantifying SARS-CoV-2 transmission suggests epidemic control with digital contact tracing. Science 2020;368(6491):eabb6936. [DOI] [PMC free article] [PubMed] [Google Scholar]
- 9. Schermuly RT, Ghofrani HA, Wilkins MR, et al. Mechanisms of disease: pulmonary arterial hypertension. Nat Rev Cardiol 2011;8(8):443. [DOI] [PMC free article] [PubMed] [Google Scholar]
- 10. Lai YC, Potoka KC, Champion HC, et al. Pulmonary arterial hypertension: the clinical syndrome. Circ Res 2014;115(1):115–30. [DOI] [PMC free article] [PubMed] [Google Scholar]
- 11. Natarajan R. Recent trends in pulmonary arterial hypertension. Lung India 2011;28(1):39. [DOI] [PMC free article] [PubMed] [Google Scholar]
- 12. Horn EM, Chakinala M, Oudiz R, et al. Could pulmonary arterial hypertension patients be at a lower risk from severe COVID-19? Pulm Circ 2020;10(2):2045894020922799. [DOI] [PMC free article] [PubMed] [Google Scholar]
- 13. Chen L, Li X, Chen M, et al. The ACE2 expression in human heart indicates new potential mechanism of heart injury among patients infected with SARS-CoV-2. Cardiovasc Res 2020;116(6):1097–100. [DOI] [PMC free article] [PubMed] [Google Scholar]
- 14. Guzzi PH, Mercatelli D, Ceraolo C, et al. Master regulator analysis of the SARS-CoV-2/human interactome. J Clin Med 2020;9(4):982. [DOI] [PMC free article] [PubMed] [Google Scholar]
- 15. Wichert S, Fokianos K, Strimmer K. Identifying periodically expressed transcripts in microarray time series data. Bioinformatics 2004;20(1):5–20. [DOI] [PubMed] [Google Scholar]
- 16. Soon WW, Hariharan M, Snyder MP. High-throughput sequencing for biology and medicine. Mol Syst Biol 2013;9(1):640. [DOI] [PMC free article] [PubMed] [Google Scholar]
- 17. Irigoyen N, Firth AE, Jones JD, et al. High-resolution analysis of coronavirus gene expression by RNA sequencing and ribosome profiling. PLoS Pathog 2016;12(2):e1005473. [DOI] [PMC free article] [PubMed] [Google Scholar]
- 18. Sievers F, Wilm A, Dineen D, et al. Fast, scalable generation of high-quality protein multiple sequence alignments using Clustal Omega. Mol Syst Biol 2011;7(1):539. [DOI] [PMC free article] [PubMed] [Google Scholar]
- 19. Letunic I, Bork P. Interactive Tree Of Life (iTOL): an online tool for phylogenetic tree display and annotation. Bioinformatics 2007;23(1):127–8. [DOI] [PubMed] [Google Scholar]
- 20. Clough E, Barrett T. The Gene Expression Omnibus Database. Methods Mol Biol 2016;1418:93–110. doi: 10.1007/978-1-4939-3578-9_5. [DOI] [PMC free article] [PubMed] [Google Scholar]
- 21. Edgar R, Domrachev M, Lash AE. Gene Expression Omnibus: NCBI gene expression and hybridization array data repository. Nucleic Acids Res 2002;30(1):207–10. [DOI] [PMC free article] [PubMed] [Google Scholar]
- 22. Blanco-Melo D, Nilsson-Payant BE, Liu WC, et al. Imbalanced host response to SARS-CoV-2 drives development of COVID-19. Cell 2020;181(5):1036–45.e9. [DOI] [PMC free article] [PubMed] [Google Scholar]
- 23. Smyth GK. limma: linear models for microarray data. In: Gentleman R, Care V, Dudoit S et al. (eds). Bioinformatics and Computational Biology Solutions using R and Bioconductor. New York: Springer, 2005, 397–420. [Google Scholar]
- 24. Love MI, Huber W, Anders S. Moderated estimation of fold change and dispersion for RNA-seq data with DESeq2. Genome Biol 2014;15(12):550. [DOI] [PMC free article] [PubMed] [Google Scholar]
- 25. Davis S, Meltzer PS. GEOquery: a bridge between the Gene Expression Omnibus (GEO) and BioConductor. Bioinformatics 2007;23(14):1846–7. [DOI] [PubMed] [Google Scholar]
- 26. Gentleman RC, Carey VJ, Bates DM, et al. Bioconductor: open software development for computational biology and bioinformatics. Genome Biol 2004;5(10):R80. [DOI] [PMC free article] [PubMed] [Google Scholar]
- 27. Benjamini Y, Hochberg Y. Controlling the false discovery rate: a practical and powerful approach to multiple testing. J R Stat Soc B Methodol 1995;57(1):289–300. [Google Scholar]
- 28. Subramanian A, Kuehn H, Gould J, et al. GSEA-P: a desktop application for Gene Set Enrichment Analysis. Bioinformatics 2007;23(23):3251–3. [DOI] [PubMed] [Google Scholar]
- 29. Gene Ontology Consortium . The gene ontology resource: 20 years and still GOing strong. Nucleic Acids Res 2019;47(D1):D330–8. [DOI] [PMC free article] [PubMed] [Google Scholar]
- 30. Podder NK, Rana HK, Azam MS, et al. A system biological approach to investigate the genetic profiling and comorbidities of type 2 diabetes. Gene Reports 2020;21:100830. [Google Scholar]
- 31. Doms A, Schroeder M. GoPubMed: exploring PubMed with the gene ontology. Nucleic Acids Res 2005;33(Suppl 2):W783–6. [DOI] [PMC free article] [PubMed] [Google Scholar]
- 32. Kuleshov MV, Jones MR, Rouillard AD, et al. Enrichr: a comprehensive gene set enrichment analysis web server 2016 update. Nucleic Acids Res 2016;44:W90–7. [DOI] [PMC free article] [PubMed] [Google Scholar]
- 33. Kanehisa M, Goto S. KEGG: Kyoto Encyclopedia of Genes and Genomes. Nucleic Acids Res 2000;28(1):27–30. [DOI] [PMC free article] [PubMed] [Google Scholar]
- 34. Fabregat A, Jupe S, Matthews L, et al. The reactome pathway knowledgebase. Nucleic Acids Res 2018;46(D1):D649–55. [DOI] [PMC free article] [PubMed] [Google Scholar]
- 35. Slenter DN, Kutmon M, Hanspers K, et al. WikiPathways: a multifaceted pathway database bridging metabolomics to other omics research. Nucleic Acids Res 2018;46(D1):D661–7. [DOI] [PMC free article] [PubMed] [Google Scholar]
- 36. Šikić M, Tomić S, Vlahoviček K. Prediction of protein–protein interaction sites in sequences and 3D structures by random forests. PLoS Comput Biol 2009;5(1):e1000278. [DOI] [PMC free article] [PubMed] [Google Scholar]
- 37. Pagel P, Kovac S, Oesterheld M, et al. The MIPS mammalian protein–protein interaction database. Bioinformatics 2005;21(6):832–4. [DOI] [PubMed] [Google Scholar]
- 38. Chowdhury UN, Islam MB, Ahmad S, et al. Network-based identification of genetic factors in ageing, lifestyle and type 2 diabetes that influence to the progression of Alzheimer’s disease. Inform Med Unlocked 2020;19:100309. [Google Scholar]
- 39. Breuer K, Foroushani AK, Laird MR, et al. InnateDB: systems biology of innate immunity and beyond—recent updates and continuing curation. Nucleic Acids Res 2013;41(D1):D1228–33. [DOI] [PMC free article] [PubMed] [Google Scholar]
- 40. Xia J, Gill EE, Hancock RE. NetworkAnalyst for statistical, visual and network-based meta-analysis of gene expression data. Nat Protoc 2015;10(6):823–44. [DOI] [PubMed] [Google Scholar]
- 41. Shannon P, Markiel A, Ozier O, et al. Cytoscape: a software environment for integrated models of biomolecular interaction networks. Genome Res 2003;13(11):2498–504. [DOI] [PMC free article] [PubMed] [Google Scholar]
- 42. Hsing M, Byler KG, Cherkasov A. The use of gene ontology terms for predicting highly-connected 'hub' nodes in protein-protein interaction networks. BMC Syst Biol 2008;2(1):80. [DOI] [PMC free article] [PubMed] [Google Scholar]
- 43. Chin CH, Chen SH, Wu HH, et al. cytoHubba: identifying hub objects and sub-networks from complex interactome. BMC Syst Biol 2014;8(S4):S11. [DOI] [PMC free article] [PubMed] [Google Scholar]
- 44. Wang J, Zhong J, Chen G, et al. ClusterViz: a cytoscape APP for cluster analysis of biological network. IEEE/ACM Trans Comput Biol Bioinform 2014;12(4):815–22. [DOI] [PubMed] [Google Scholar]
- 45. Liu ZP, Wu C, et al. RegNetwork: an integrated database of transcriptional and post-transcriptional regulatory networks in human and mouse. Database 2015;2015:bav095. [DOI] [PMC free article] [PubMed] [Google Scholar]
- 46. Zhou G, Soufan O, Ewald J, et al. NetworkAnalyst 3.0: a visual analytics platform for comprehensive gene expression profiling and meta-analysis. Nucleic Acids Res 2019;47(W1):W234–41. [DOI] [PMC free article] [PubMed] [Google Scholar]
- 47. Al Mustanjid M, Mahmud SH, Royel MRI, et al. Detection of molecular signatures and pathways shared in inflammatory bowel disease and colorectal cancer: a bioinformatics and systems biology approach. Genomics 2020;112(5):3416–26. [DOI] [PubMed] [Google Scholar]
- 48. Yoo M, Shin J, Kim J, et al. DSigDB: drug signatures database for gene set analysis. Bioinformatics 2015;31(18):3069–71. [DOI] [PMC free article] [PubMed] [Google Scholar]
- 49. Chen EY, Tan CM, Kou Y, et al. Enrichr: interactive and collaborative HTML5 gene list enrichment analysis tool. BMC Bioinformatics 2013;14(1):128. [DOI] [PMC free article] [PubMed] [Google Scholar]
- 50. Li H, Liu L, Zhang D, et al. SARS-CoV-2 and viral sepsis: observations and hypotheses. Lancet 2020;395(10235):1517–20. [DOI] [PMC free article] [PubMed] [Google Scholar]
- 51. Jang Y, Seo SH. Gene expression pattern differences in primary human pulmonary epithelial cells infected with MERS-CoV or SARS-CoV-2. Arch Virol 2020;165(10):2205–11. [DOI] [PMC free article] [PubMed] [Google Scholar]
- 52. Kerkeni M, Gharbi J. RAGE receptor: may be a potential inflammatory mediator for SARS-COV-2 infection? Med Hypotheses 2020;144:109950. doi: 10.1016/j.mehy.2020.109950. [DOI] [PMC free article] [PubMed] [Google Scholar]
- 53. Pacha O, Sallman MA, Evans SE. COVID-19: a case for inhibiting IL-17? Nat Rev Immunol 2020;20(6):345–6. [DOI] [PMC free article] [PubMed] [Google Scholar]
- 54. Taz TA, Ahmed K, Paul BK, et al. Network-based identification genetic effect of SARS-CoV-2 infections to idiopathic pulmonary fibrosis (IPF) patients. Brief Bioinform 2020. doi: 10.1093/bib/bbaa235. [DOI] [PMC free article] [PubMed] [Google Scholar]
- 55. Hautefort A, Girerd B, Montani D, et al. T-helper 17 cell polarization in pulmonary arterial hypertension. Chest 2015;147(6):1610–20. [DOI] [PubMed] [Google Scholar]
- 56. Moni MA, Quinn JM, Sinmaz N, et al. Gene expression profiling of SARS-CoV-2 infections reveal distinct primary lung cell and systemic immune infection responses that identify pathways relevant in COVID-19 disease. Brief Bioinform 2020. doi: 10.1093/bib/bbaa376. [DOI] [PMC free article] [PubMed] [Google Scholar]
- 57. Chandrashekar DS, Manne U, Varambally S. Comparative transcriptome analyses reveal genes associated with SARS-CoV-2 infection of human lung epithelial cells. bioRxiv 2020.06.24.169268. doi: 10.1101/2020.06.24.169268. [DOI] [PMC free article] [PubMed] [Google Scholar]
- 58. Nakamura K, Sakaguchi M, Matsubara H, et al. Crucial role of RAGE in inappropriate increase of smooth muscle cells from patients with pulmonary arterial hypertension. PLoS One 2018;13(9):e0203046. [DOI] [PMC free article] [PubMed] [Google Scholar]
- 59. Wambier CG, Goren A. Severe acute respiratory syndrome coronavirus 2 (SARS-CoV-2) infection is likely to be androgen mediated. J Am Acad Dermatol 2020;83(1):308–9. [DOI] [PMC free article] [PubMed] [Google Scholar]
- 60. Prajapat M, Shekhar N, Sarma P, et al. Virtual screening and molecular dynamics study of approved drugs as inhibitors of spike protein S1 domain and ACE2 interaction in SARS-CoV-2. J Mol Graph Model 2020;101:107716. [DOI] [PMC free article] [PubMed] [Google Scholar]
- 61. Gvozdjakova A, Klauco F, Kucharska J, et al. Is mitochondrial bioenergetics and coenzyme Q10 the target of a virus causing COVID-19? Bratisl Lek Listy 2020;121(11):775–8. [DOI] [PubMed] [Google Scholar]
- 62. Isidori AM, Giannetta E, Pofi R, et al. Targeting the NO-cGMP-PDE5 pathway in COVID-19 infection. The DEDALO project. Andrology 2020;9(1):33–8 [DOI] [PMC free article] [PubMed] [Google Scholar]
- 63. Poston JT, Patel BK, Davis AM. Management of critically ill adults with COVID-19. JAMA 2020;323(18):1839–41. [DOI] [PubMed] [Google Scholar]


