Abstract
We present a bead-based approach to microfluidic polymerase chain reaction (PCR), enabling fluorescent detection and sample conditioning in a single microchamber. Bead-based PCR, while not extensively investigated in microchip format, has been used in a variety of bioanalytical applications in recent years. We leverage the ability of bead-based PCR to accumulate fluorescent labels following DNA amplification to explore a novel DNA detection scheme on a microchip. The microchip uses an integrated microheater and temperature sensor for rapid control of thermal cycling temperatures, while the sample is held in a microchamber fabricated from (poly)dimethylsiloxane and coated with Parylene. The effects of key bead-based PCR parameters, including annealing temperature and concentration of microbeads in the reaction mixture, are studied to achieve optimized device sensitivity and detection time. The device is capable of detecting a synthetically prepared section of the Bordetella pertussis genome in as few as 10 temperature cycles with times as short as 15 min. We then demonstrate the use of the procedure in an integrated device; capturing, amplifying, detecting, and purifying template DNA in a single microfluidic chamber. These results show that this method is an effective method of DNA detection which is easily integrated in a microfluidic device to perform additional steps such as sample pre-conditioning.
Keywords: Polymerase chain reaction, Bead, DNA capture, DNA purification, Microfluidics
1. Introduction
Chemical amplification of nucleic acids is most commonly realized with the polymerase chain reaction (PCR), in which a DNA molecule, referred to as a template, is exponentially duplicated via repeated thermal denaturation and enzymatic replication (Mullis and Faloona 1987). Bead-based PCR is a variant of the PCR procedure that uses primers (short DNA fragments complementary to a specific region of the template) attached to microbeads. This procedure results in bead-tethered template DNA duplicates; it is hence an attractive analytical tool that simultaneously accumulates signals from DNA-based transducers and allows manipulation of DNA itself via solid-phase extraction (SPE) techniques.
In recent years, bead-based PCR has been used in a variety of applications including DNA sequencing, protein screening, and pathogenic DNA detection. For example, whole genome sequencing has been demonstrated with reduced cost and assay time using bead-based PCR to facilitate the organization and detection of amplified sections of a fragmented E. coli genome (Shendure et al. 2005). Compartmentalization of DNA in emulsions (Tawfik and Griffiths 1998) combined with bead-based PCR (Diehl et al. 2006; Dressman et al. 2003) also provides a method of rapidly screening an entire genome for DNA binding proteins (Kojima et al. 2005) and for cell-free protein synthesis (Gan et al. 2008). In addition, genomic DNA (gDNA) has been detected using bead-based PCR (Lermo et al. 2007), or similarly via PCR on nanostructured surfaces (Hiep et al. 2010). While demonstrating the utility of bead-based PCR, these examples primarily rely on conventional instrumentation for reaction control (temperature cycling), involve tedious and error-prone manipulation of primer-coupled beads, and require laborious sample pre-treatment (e.g., for the separation of gDNA from cell lysate) prior to the PCR reaction. These limitations are a major hindrance to the widespread use of bead-based PCR.
Microfluidics technology addresses the limitations of conventional PCR schemes, most notably by providing a more rapid and efficient reaction platform. Extensive applications of microfluidics to PCR (Lee et al. 2003; Roper et al. 2005; Zhang et al. 2006) have taken advantage of the more efficient heat transfer properties to create rapid, miniaturized PCR devices (Northrup et al. 1998) capable of detecting as little as a single molecule of DNA (Zhang and Xing 2010). Microfluidics has also enabled integrated chip-based systems that perform tasks such as sample pre-treatment and post-amplification analysis (Beyor et al. 2009; Easley et al. 2006; Ferguson et al. 2009; Liu et al. 2004), further improving reaction speed and test accuracy by shifting more operations to the microscale domain. In particular, microfluidic PCR has been used to detect gDNA (Easley et al. 2006; Li et al. 2011; Lien et al. 2009; Liu et al. 2004), resulting in improvements in sensitivity, specificity and turnaround times over other pathogen detection methods, such as cell culturing and antibody-based assays. However, these works have almost exclusively involved solution-based PCR (i.e., PCR with primers residing in solution), and while microfluidics holds the same advantages for solid-phase amplification there are far fewer applications of microfluidics to solid-phase PCR implementations such as bead-based PCR. Much of the bead-based PCR literature relies upon bead-based PCR in emulsions, in which case the emulsions are typically amplified in a conventional thermal cycler (Diehl et al. 2005, 2006, 2008; Dressman et al. 2003; Gan et al. 2008; Kumaresan et al. 2008). In one relevant investigation reported recently, primers were tethered to nanostructured surfaces of a biochip to allow optical detection of human gDNA indicative of hemolytic diseases such as autoimmune hemolytic anemia (Hiep et al. 2010). However, the nanostructures were based on a flat surface, limiting the surface area-to-volume ratio and leading to a practically inadequate sensitivity.
This paper investigates bead-based PCR on a microfluidic chip by applying it to DNA pre-conditioning and detection, as demonstrated by the capture, amplification, and detection of trace quantities of a synthetic DNA sequence identical to a repetitive segment of the genome of Bordetella pertussis (B. pertussis). Trace DNA is introduced into the device microchamber along with PCR reagents and microbeads, and thermally cycled using an integrated heater and temperature sensor. The microbeads provide a high surface area-to-volume ratio platform for accumulation of transducing labels, creating a rapid, simple method to detect the trace amounts of DNA. The bead-based design allows for simple integration with other functionalities, including sample purification (Yeung and Hsing 2006) and downstream analysis. Experimental results show that a synthetically generated segment of the B. pertussis genome 181 base pairs (bp) in length can be detected in 10 PCR cycles (within 15 min) at a clinically relevant concentration of 1 pM (~6 × 10⁵ copies/μL). We then demonstrate the use of this approach to perform integrated DNA capture, amplification, detection, and purification in a single microchamber. We thus show how bead-based PCR is both an effective DNA detection method and a DNA pre-conditioning, detection, and analysis system that can be simply integrated into microfluidic devices.
2. Materials and methods
2.1. Bead-based PCR principle
PCR is a biochemical amplification process which uses a thermostable enzyme to dehybridize and duplicate template DNA. During a PCR reaction, cyclic changes in temperature cause denaturation of template dsDNA and then hybridization of primers to the separated single-stranded DNA (ssDNA) strands. A temperature cycle consists of three steps: dsDNA melting (denaturation) at 95 °C, primer annealing (hybridization) at 50–62 °C, and DNA extension at 72 °C. PCR reactions also typically include an initial melting step at 95 °C (pre-melting) and a final extension step at 72 °C. Reagents include two sets of primers: reverse primers that hybridize to template ssDNA, and forward primers that hybridize to the complementary ssDNA. Extension of these template-primer pairs by the thermostable Taq polymerase produces dsDNA consisting of the template and its complementary strand. Repeated temperature cycles result in amplification, i.e., generation of exponentially increasing duplicate copies of the dsDNA.
Bead-based PCR is a solid-phase implementation of PCR, in which DNA is duplicated while tethered to the surfaces of microbeads in solution. In bead-based PCR, one of the two primer sets (typically the reverse primer) is tethered to a bead surface, while the untethered (forward) primer can be labeled with a detectable tag (e.g., a fluorophore). Bead-bound reverse primers are mixed with template ssDNA, labeled forward primers and other reactants (e.g., nucleotides and Taq) in solution, and hybridize to template ssDNA molecules. This results in the capture of template DNA by the microbeads and is hence effectively a SPE process. This completes the first temperature cycle, which produces unlabeled dsDNA. During the second temperature cycle, the dsDNA from the previous cycle is denatured, allowing template DNA and fluorescently labeled forward primers to hybridize to bead-bound ssDNA (complementary strands of the template). Extension then generates labeled duplicates of template DNA hybridized to the bead-bound complementary strands. This process is then repeated with further temperature cycles to produce exponentially increasing copies of dsDNA consisting of labeled template and unlabeled, bead-tethered complementary strands.
2.2. Microchip design and fabrication
The bead-based PCR microchip consists of a microfluidic chamber, which is fabricated in the elastomer polydimethylsiloxane (PDMS) and bonded to a glass slide with an integrated resistive heater and temperature sensor (Fig. 1a). The heater has a serpentine geometry covering the chamber area as well as a large surrounding area to generate a sufficiently uniform temperature field in the chamber, while the resistive temperature sensor is located at the center of the chamber area. The cylindrical chamber is open to atmosphere and consists of two vertically aligned connected compartments of different diameter. The lower compartment contains the aqueous PCR sample, and expands to the upper compartment of larger diameter that retains a layer of mineral oil over the PCR sample. The entire chamber surface is conformally coated with a layer of the polymer Parylene C. The mineral oil and Parylene coating eliminate water evaporation that would otherwise occur directly to open air or through the PDMS, while minimizing the potential formation of air bubbles. The Parylene also provides a PCR-compatible surface, which, along with the use of additives such as bovine serum albumin (BSA) and Tween, minimizes adsorption of reaction components such as DNA and Taq polymerase (Shin et al. 2003).
Fig. 1.
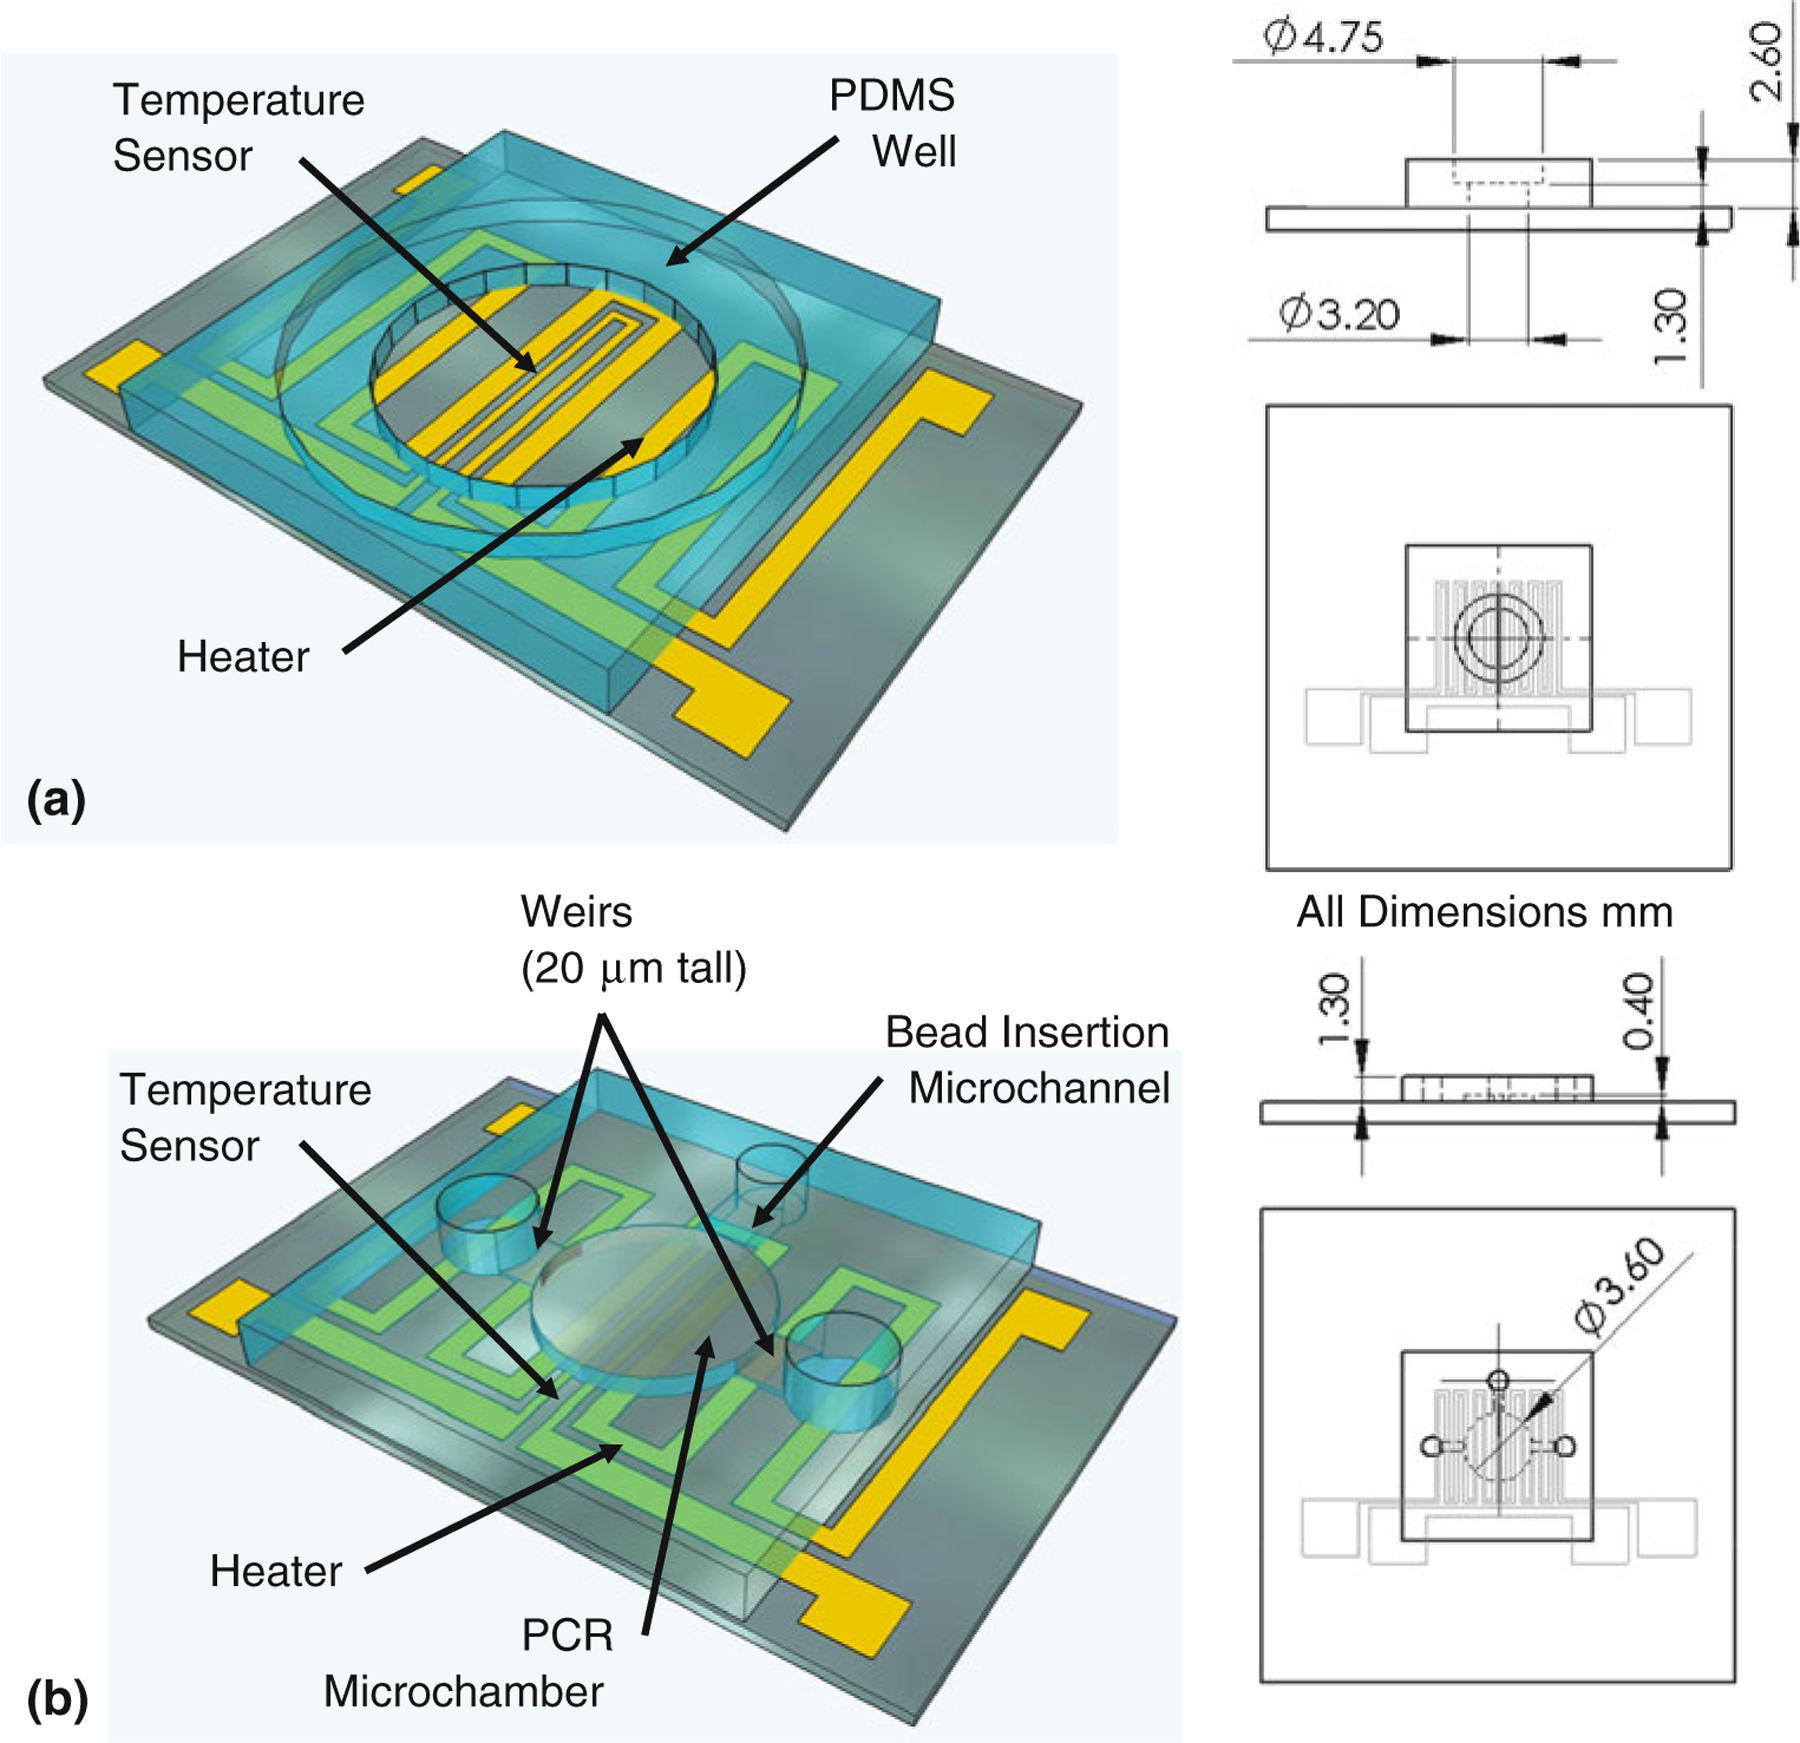
Device design. a The chip consists primarily of a PDMS chamber bonded to a glass slide which has been patterned with a micro heater and temperature sensor. Key dimensions of the PDMS microchamber have been included in projected top and side views (all dimensions in mm). b Also shown is the design of an integrated microfluidic device, in which weirs retain microbeads in the chamber while beads are exposed to streams of buffer or reagents
Devices were fabricated using standard microfabrication techniques. Chrome and gold layers (thicknesses 20 and 200 nm) were thermally deposited onto glass microscope slides and patterned using contact lithography and wet etching techniques. Patterning generated a 5.67 cm long by 200 μm wide heater having a resistance of ~20 Ω and covering an area of 0.242 cm2, and a 1.04 cm long by 40 μm wide resistive temperature sensor having a resistance of ~30 Ω. The thermal elements were then passivated with SiO2 (thickness 1 μm) formed using plasma-enhanced chemical vapor deposition, with openings for electrical connections formed using a shadow mask. The SiO2 not only passivates the electrical components, but also provides an efficient bonding surface for PDMS. To generate PDMS for the microfluidic chambers, PDMS prepolymer was mixed in the ratio of 10:1 with a curing agent and poured onto a clean silicon wafer, baked for 30 min at 75 °C, and then peeled from the wafer. Microfluidic chambers were defined by puncturing holes in the PDMS using a hole punch. The bottom PDMS piece was 1.3 mm thick with a 3.2 mm diameter hole, and the top piece was 1.3 mm thick with a 4.75 mm diameter hole. The glass substrate and PDMS sections were then treated using UV-generated ozone for 10 min, and bonded by baking at 75 °C for 30 min. During bonding, the PDMS holes were aligned to the center of the integrated heater patterned onto the glass slide. The chip was then conformally coated with a layer of Parylene C ~ 1 μm in thickness via chemical vapor deposition, with scotch tape used to block electrical pads.
The chip design was also modified to demonstrate integrated microfluidic PCR, by incorporation of microfluidic channels enabling bead insertion and retention during wash steps (Fig. 1b). Optical lithography was used to define an SU-8 mold for a 4-μL PCR chamber, 400 μm in depth and 3.6 mm in diameter. The mold incorporated two inlets with flow restrictions limiting the local vertical channel clearance to 20 μm, serving as passive weirs to retain microbeads in the chamber, and a third inlet with no weir to be used for bead insertion. The microchamber and channels were again fabricated from PDMS, and bonded to a glass slide integrated with a resistive heater and temperature sensor.
In addition to designing and fabricating the microchip, the bead-based primers were designed to allow rapid and simple operation of the device. Biotin–streptavidin coupling was used in this study to attach the reverse primers to the beads, as this bond is both strong and formed spontaneously in the presence of both molecules. The reverse primers were synthesized with a dual-biotin label at the 5′ end, followed by a spacer molecule adjacent to the nucleotide sequence. The dual-biotin moiety minimizes the loss of signal due to thermal denaturation as investigated in Sect. 3. Spacer molecules provide greater lateral separation between DNA on the beads, reducing hybridization issues due to steric hindrance. Synthetically generated template DNA was used to obtain controlled, consistent experimental results for characterization of DNA detection using bead-based PCR.
2.3. Application to pathogenic DNA detection
The bead-based PCR chip is applied to pathogenic DNA detection, demonstrated with a DNA sequence associated with B. pertussis. B. pertussis is a gram-negative bacteria that infects ~48.5 million patients (with 300,000 fatalities) annually worldwide (Bettiol et al. 2010). While early detection is the key to the treatment of this disease, current methods (e.g., cell culturing) for detecting the B. pertussis bacterium take days or even weeks of turnaround time (Probert et al. 2008; Wendelboe and Van Rie 2006). This limitation can be potentially addressed by our bead-based PCR microchip, which is designed to allow rapid, sensitive, and specific detection of B. pertussis.
Pathogenic DNA detection using bead-based PCR on a microchip can be accomplished as shown in Fig. 2. Bead-tethered reverse primers on the chip can be exposed to a raw sample, such as cell lysate (Fig. 2a). Pathogenic DNA in the sample is then captured and purified onto the beads via its specific hybridization to the reverse primers (Fig. 2b), as demonstrated in previously published work (Yeung and Hsing 2006). Following capture and purification, template DNA can be mixed on-chip with PCR reactants and bead-based PCR of the template DNA can then be performed using fluorescently labeled forward primers (Fig. 2c). This process rapidly generates exponentially amplified, fluorescently labeled template copies on microbeads, which can be detected by fluorescent microscopy. The use of beads in the detection volume generates an enhanced signal-to-noise ratio in comparison to amplification on flat solid surfaces (Hiep et al. 2010; Shendure et al. 2005) due to a significant increase in the fluorophore-coated surface area. Finally, the labeled copies of the template can be freed from their bead-bound complements by denaturation and eluted into pure buffer for further analysis, while the bead-bound complementary strands (cDNA) can be retrieved from the chip and stored as cDNA libraries (Lonneborg et al. 1995) (Fig. 2d).
Fig. 2.
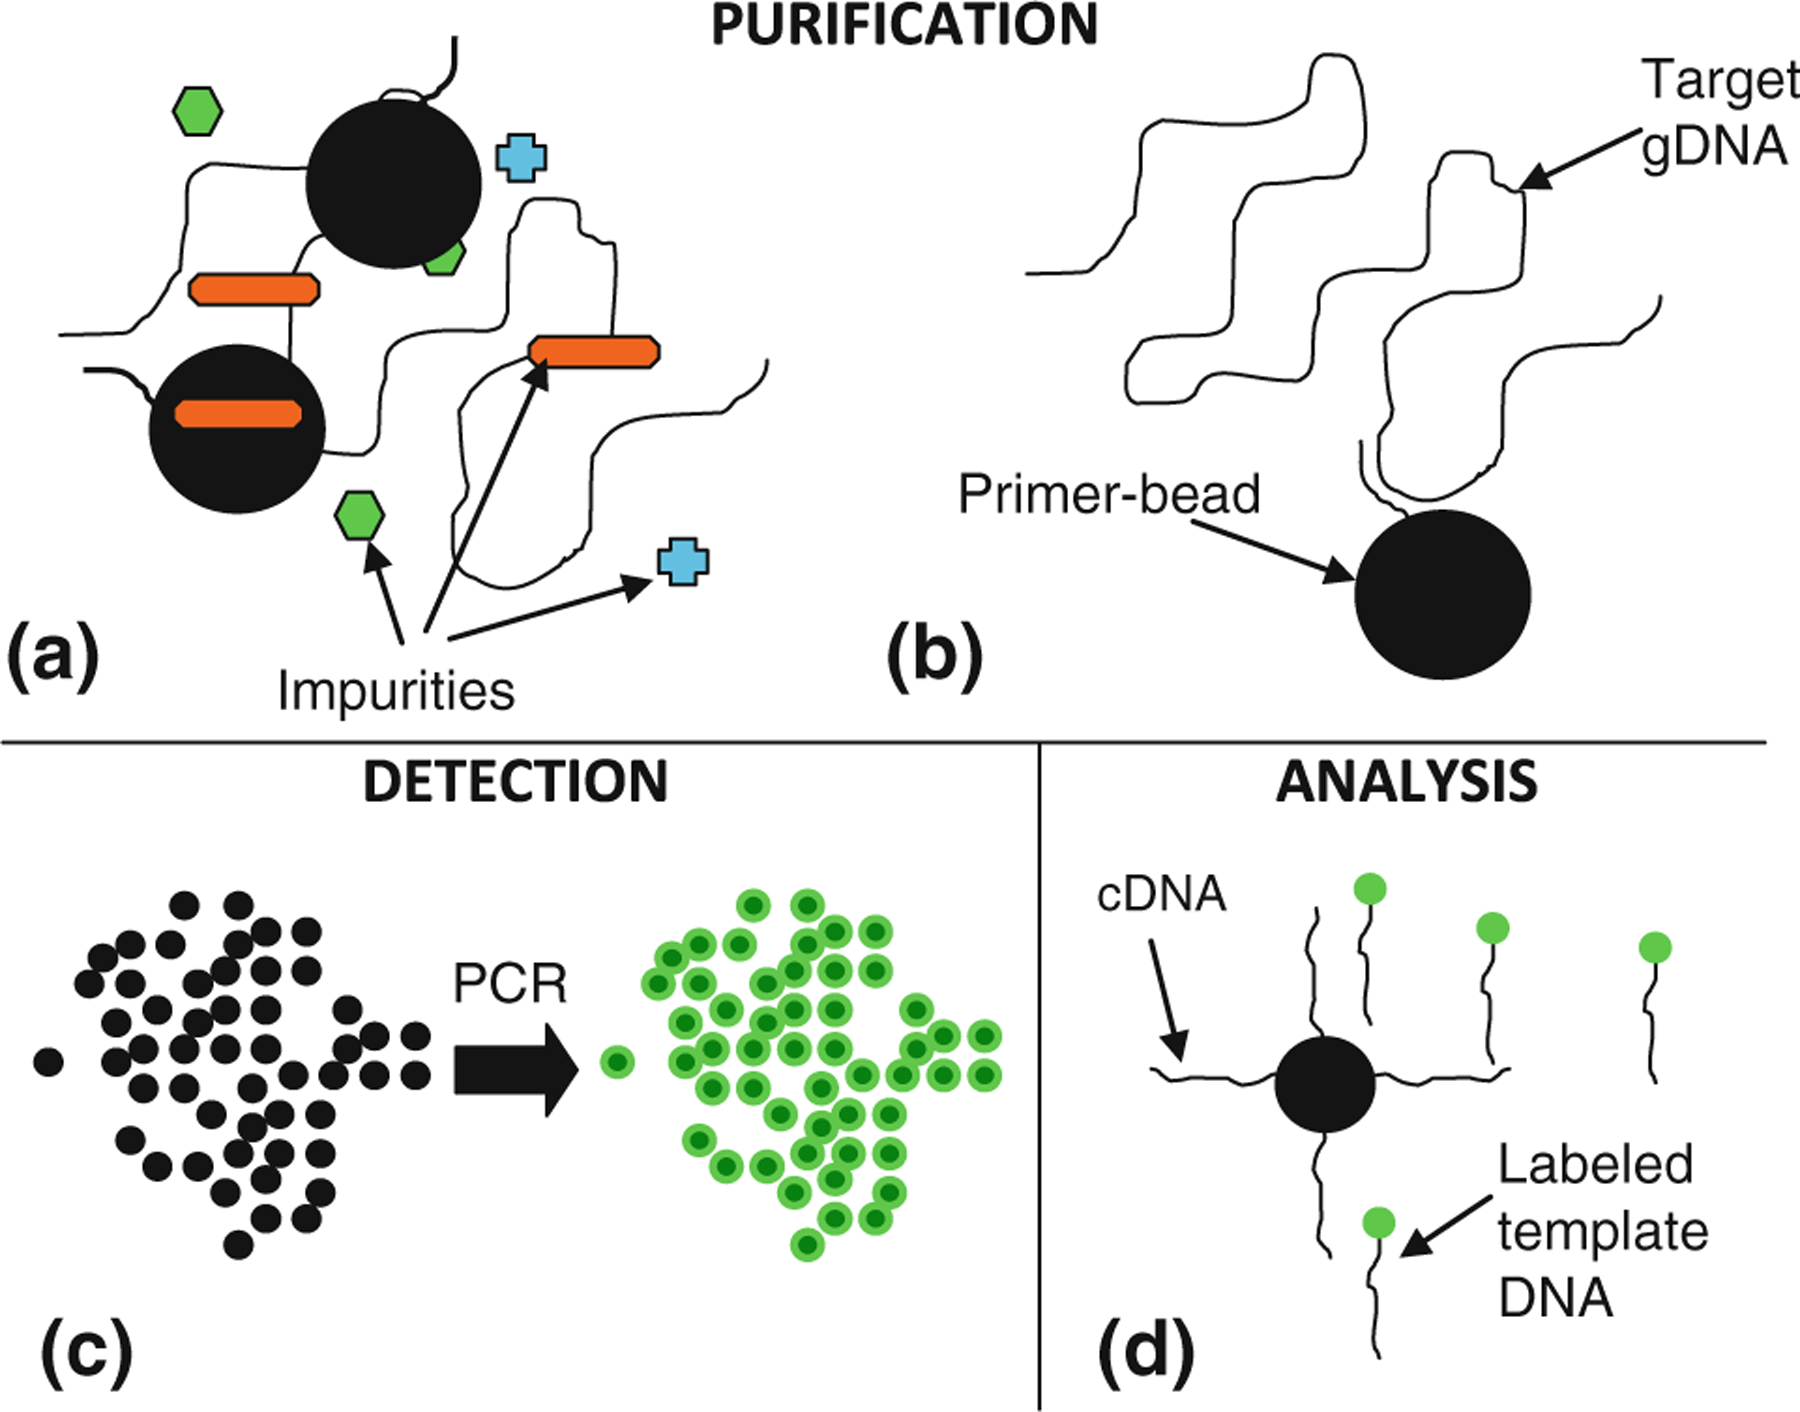
Integration of microchip bead-based PCR. Primer-coated beads permit separation of DNA from impurities (a, b), and amplification produces a fluorescent signal on the bead surfaces (c) via microchip PCR. The beads then act as a mechanism for either storage or collection and analysis of ssDNA following thermally induced dehybridization and release (d)
2.4. Materials, reagents, and experimental procedures
For detection of DNA associated with B. pertussis, the following materials and reagents were used. All DNA was obtained in lyophilized form from Integrated DNA Technologies, Coralville, IA, USA. The primers are designed as a PCR assay for determination of B. pertussis infection (Glare et al. 1990; He et al. 1993). The DNA sequences used are as follows—forward primer: 5′-FAM-Spacer-GAT TCA ATA GGT TGT ATG CAT GGT T-3′, reverse primer: 5′-Double Biotin-Spacer-TTC AGG CAC ACA AAC TTG ATG GGC G-3′, and template: 5′-GAT TCA ATA GGT TGT ATG CAT GGT TCA TCC GAA CCG GAT TTG AGA AAC TGG AAA TCG CCA ACC CCC CAG TTC ACT CAA GGA GCC CGG CCG GAT GAA CAC CCA TAA GCA TGC CCG ATT GAC CTT CCT ACG TCG ACT CGA AAT GGT CCA GCA ATT GAT CGC CCA TCA AGT TTG TGT GCC TGA A-3′. The forward primer has been modified with the fluorescent label carboxyfluorescein at the 5′ terminus, while the reverse primer incorporates a dual-biotin modification at the 5′ end. Both molecules contain an inert spacer molecule between the 5′ modifications and the nucleotide sequence. PCR was performed using Taq enzyme, deoxynucleotide triphosphates (dNTPs), and PCR reaction mixture containing appropriate buffers (Promega GoTaq Flexi PCR Mix). Reverse primers were immobilized onto streptavidin-coated polymer-based microbeads (Thermo Scientific Pierce Protein Research Products Ultralink Streptavidin Resin) averaging 80 μm in diameter. Concentration and purity measurements of DNA samples were conducted using UV/VIS (Thermo Scientific Nanodrop). Materials used in microfabrication included photoresist (Rohm & Haas Electronic Materials S1818, Microchem SU-8 2000), PDMS prepolymer (Dow Corning Sylgard 184), and Parylene C prepolymer (Kisko diX C).
PCR reaction mixture for B. pertussis DNA detection experiments was prepared as follows. Each lyophilized DNA sample was suspended in deionized H2O and diluted to the desired concentration. The PCR mixture consisted of the following: 5 × PCR Buffer (2 μL), 25 mM MgCl2 (0.6 μL), 10 mM dNTPs (0.4 μL), 50 μg/mL BSA (0.4 μL), 5 % (by volume) Tween 20 (0.1 μL), microbeads (0.5 μL), water (4.1 μL), 25 μM forward primer (0.4 μL), 25 μM reverse primer (0.4 μL), and enzyme (0.1 μL). The ingredients were mixed with template DNA (1 μL of synthetic template DNA with a concentration range of 1 aM–100 pM) without the enzyme and the mixture was then degassed at −0.4 psi for 30 min in a darkened container (to prevent photobleaching of the fluorophore label). Testing in the PCR device also occurred under an enclosure to prevent excess light from reaching the DNA. Following degassing, enzyme was added to the mixture and the 10 μL PCR sample was pipetted into the chip, followed by 30 μL of mineral oil. During experiments with the integrated device, PCR reaction mixture was degassed without primer-coated beads. These were inserted into the device, followed by template DNA, after which the DNA and beads were allowed to incubate for 10 min. This solution was then removed (with the beads retained by the weirs), and the PCR reaction mixture was introduced. The temperature of the sample was then cycled using the Labview control program to implement the reaction.
During testing, the reaction temperature was controlled using a Labview program that utilized sensor feedback to maintain a constant temperature field inside the PDMS chamber. A desktop power supply (Agilent E3631A) and a digital multimeter card (NI PCI-4060) provided electrical power and resistance measurements. An inverted fluorescence microscope (Nikon Diaphot 300) was used for all fluorescence measurements, while an attached digital camera (Pixelink PL-B742U) was used to record images of the excited fluorescent field. The microscope contains a dichroic mirror which attenuates light above the peak absorption wavelength of the fluorophore (~494 nm) during excitation and passes the higher emission wavelengths (which peak at ~512 nm) through the objective for observation and measurement.
Following PCR, the sample was pipetted to a darkened 0.5 mL microcentrifuge tube. Beads were washed six times with 1 × SSC buffer to remove excess labeled primers. Bead washing was implemented by mixing the sample with buffer, allowing the beads to settle via gravity, and removing the supernatant with a pipette. A five microliter aliquot of each test sample was pipetted into an individual 3.2 mm diameter PDMS well on a glass slide, and was observed using the fluorescent microscope. During integrated device testing, microbeads were washed by passing buffer through the chamber while being retained by the weirs (Sect. 2.2) prior to fluorescent measurement. The microscope was kept in an enclosure to prevent ambient light from interfering with the measurements or bleaching the fluorescent labels. The samples were briefly excited with light using the fluorescent light source and the resulting emission was recorded using the CCD camera microscope attachment. Camera exposure times were optimized based on fluorescent signal intensity during device characterization (Sects. 3.1, 3.2) to maximize the signal-to-noise ratio, defined here as the ratio of the measured fluorescence intensity to the intensity of background fluorescence. While this did not guarantee a single baseline signal intensity during the tests, the use of relative fluorescence intensity allowed consistent interpretation of the experimental results. Digital images were analyzed using ImageJ software.
3. Results and discussion
We tested the ability of the fabricated device to detect pathogenic DNA via the bead-based PCR. The device was first calibrated to determine physical characteristics such as the temperature coefficient of resistance (TCR) of the on-chip temperature sensors, and the thermal response of the PCR chamber. Following physical characterization, we investigated the effects of experimental parameters on bead-based PCR results. By varying the time and temperature of individual PCR steps, reactant concentrations, and bead concentration, we examined their impact on signal intensity. Then, the ability of the device to detect pathogenic DNA was tested by determining the minimum detectable concentration of DNA and the minimum assay time. Finally, the bead-based PCR method was demonstrated in an integrated microfluidic device and shown to be able to capture, amplify, detect, and release single-stranded DNA.
3.1. Physical characterization of the device
The resistive heater and sensor were first characterized to enable accurate on-chip temperature control. The chip was placed in a temperature-controlled environmental chamber and its temperature varied. Chamber temperatures were measured using a platinum resistance temperature detector probe (Hart Scientific 5628) and on-chip resistances were measured with a digital multimeter (Agilent 34420A). Resistance measurements of temperature sensors indicated a linear relationship between resistance and temperature. These data were used to calculate a TCR for the sensor of 2 × 10⁻³ °C−1 (Supplemental Information). The heater was found to have a resistance of ~20 Ω.
The accuracy of on-chip temperature measurements and the heating rate of the chip were then tested. A 1.5 mm diameter insulated K-type thermocouple probe (Omega Engineering) was inserted into the sample chamber along with a pure water sample. The chamber temperature was then controlled (heated cyclically) as would occur during a typical PCR test, but without the amplification reagents. According to the time course of temperature obtained during this control test (Fig. 3), the chip achieves target temperatures with minimal overshoot. The device exhibited an average time constant of heating (based on an exponential fit) of ~1.4 s. In addition, the thermocouple readings agreed with the temperature setpoints to within ±0.5 °C (data not shown). This indicates that the chamber temperature can be controlled to produce rapid and efficient amplification reactions.
Fig. 3.
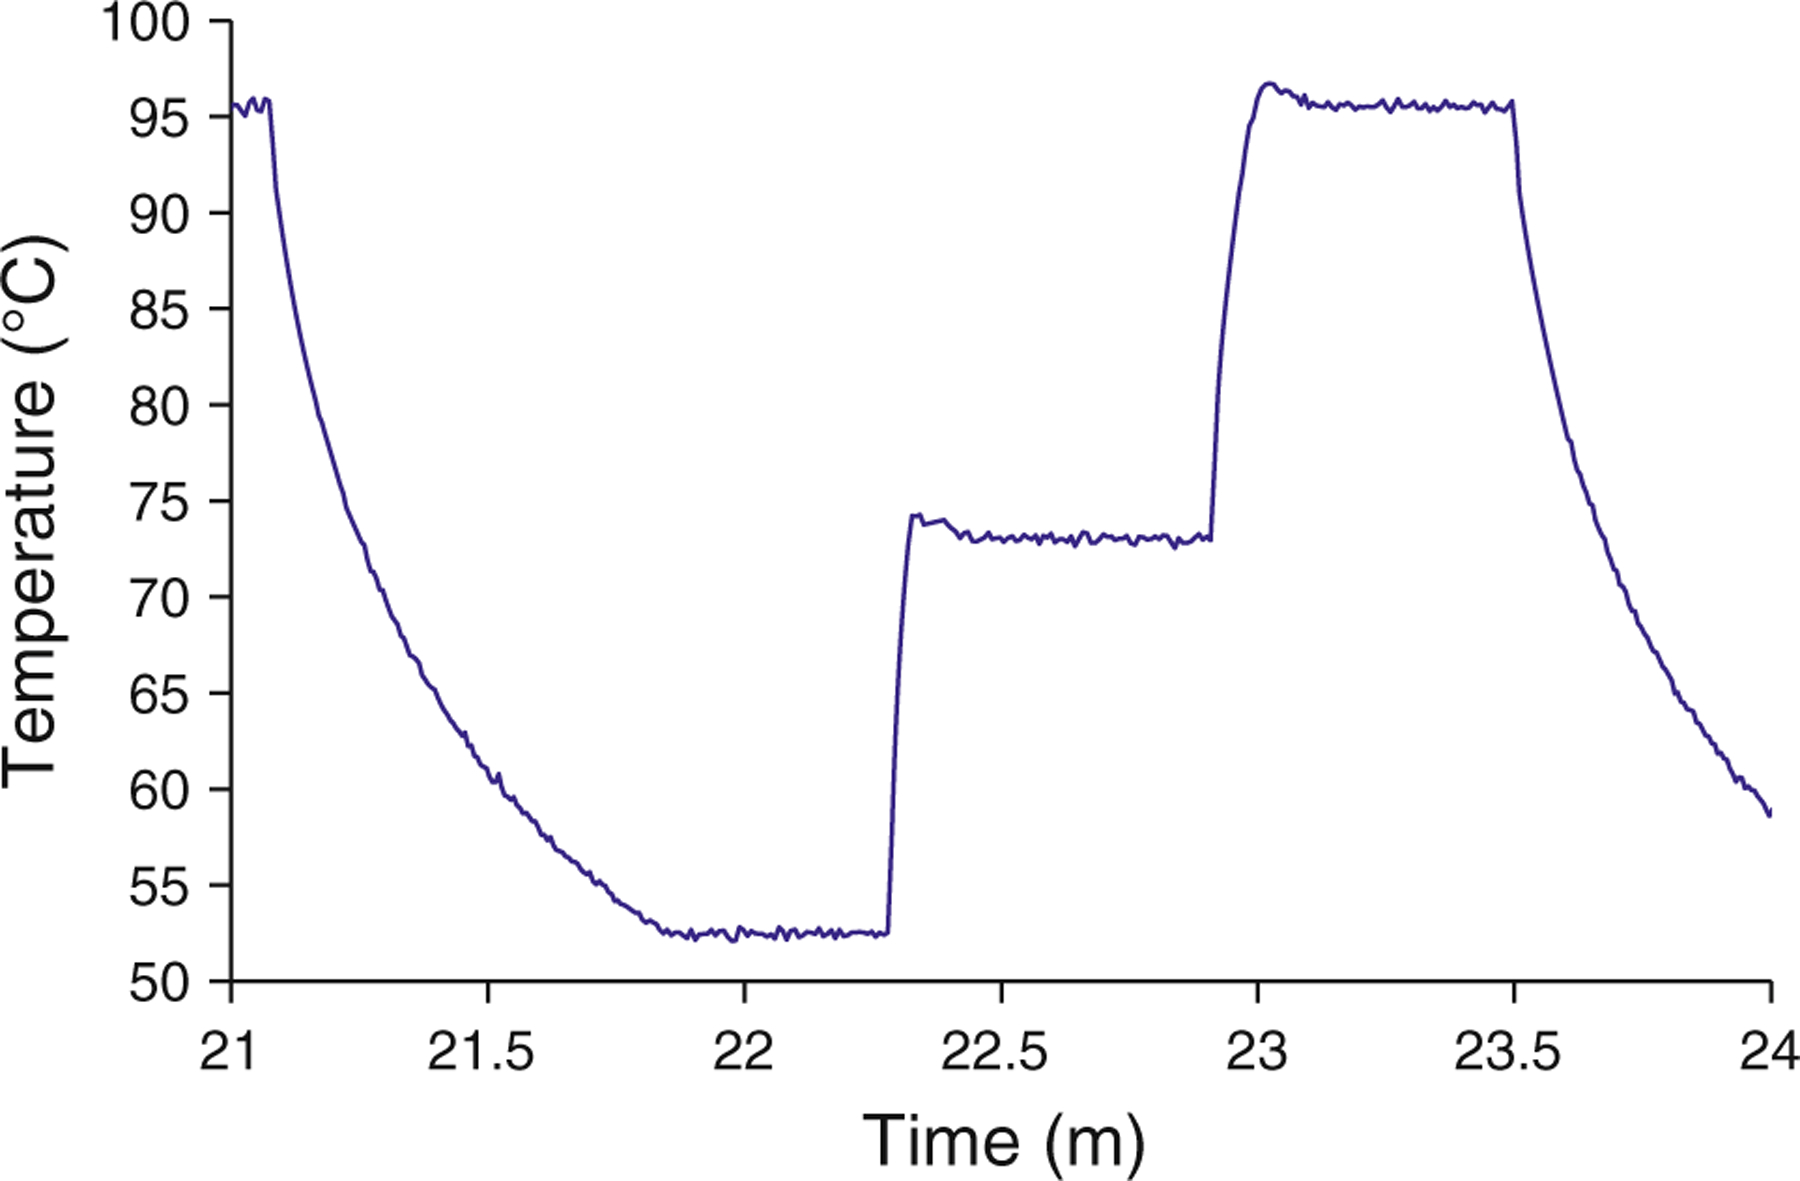
Temperature history of a typical PCR cycle
The effects of test conditions, such as ambient light and temperature, on test results were also investigated. Biotin–streptavidin binding was chosen as a simple and effective alternative to covalent methods for DNA immobilization (Adessi et al. 2000; Diehl et al. 2006), however, streptavidin molecules may denature as a result of the elevated temperature necessary to dehybridize DNA (González et al. 1999). Dual-biotin functionalization has been implemented in previous work to counteract this effect (Diehl et al. 2006; Dressman et al. 2003), however, no quantitative data were reported to support the effectiveness of this technique. To generate such data, temperature cycling equivalent to typical PCR testing was performed on linkages between streptavidin and dual-biotin labeled DNA. Beads coated with streptavidin were mixed with 1 μM dual-biotin labeled primers and an equal concentration of fluorophore-labeled complementary strands. The solution was subjected to temperature cycling, returned to room temperature, and washed to remove any DNA in solution. In Fig. 4, the fluorescent intensity is shown for untested beads (zero temperature cycles) and for beads subjected to 10, 20, 30, or 40 rounds of temperature cycling. Intensity, measured in arbitrary fluorescence units (afu), did not vary from baseline (zero temperature cycles) as a result of temperature cycling. This indicates that the concentration of DNA on the bead surfaces changes negligibly as a result of the PCR process, producing minimal error as a result. Another potential source of error is the effect of ambient light on the fluorescent labels. This effect, known as photobleaching, was found to be negligible for this experimental setup in previous work (Hilton et al. 2011).
Fig. 4.
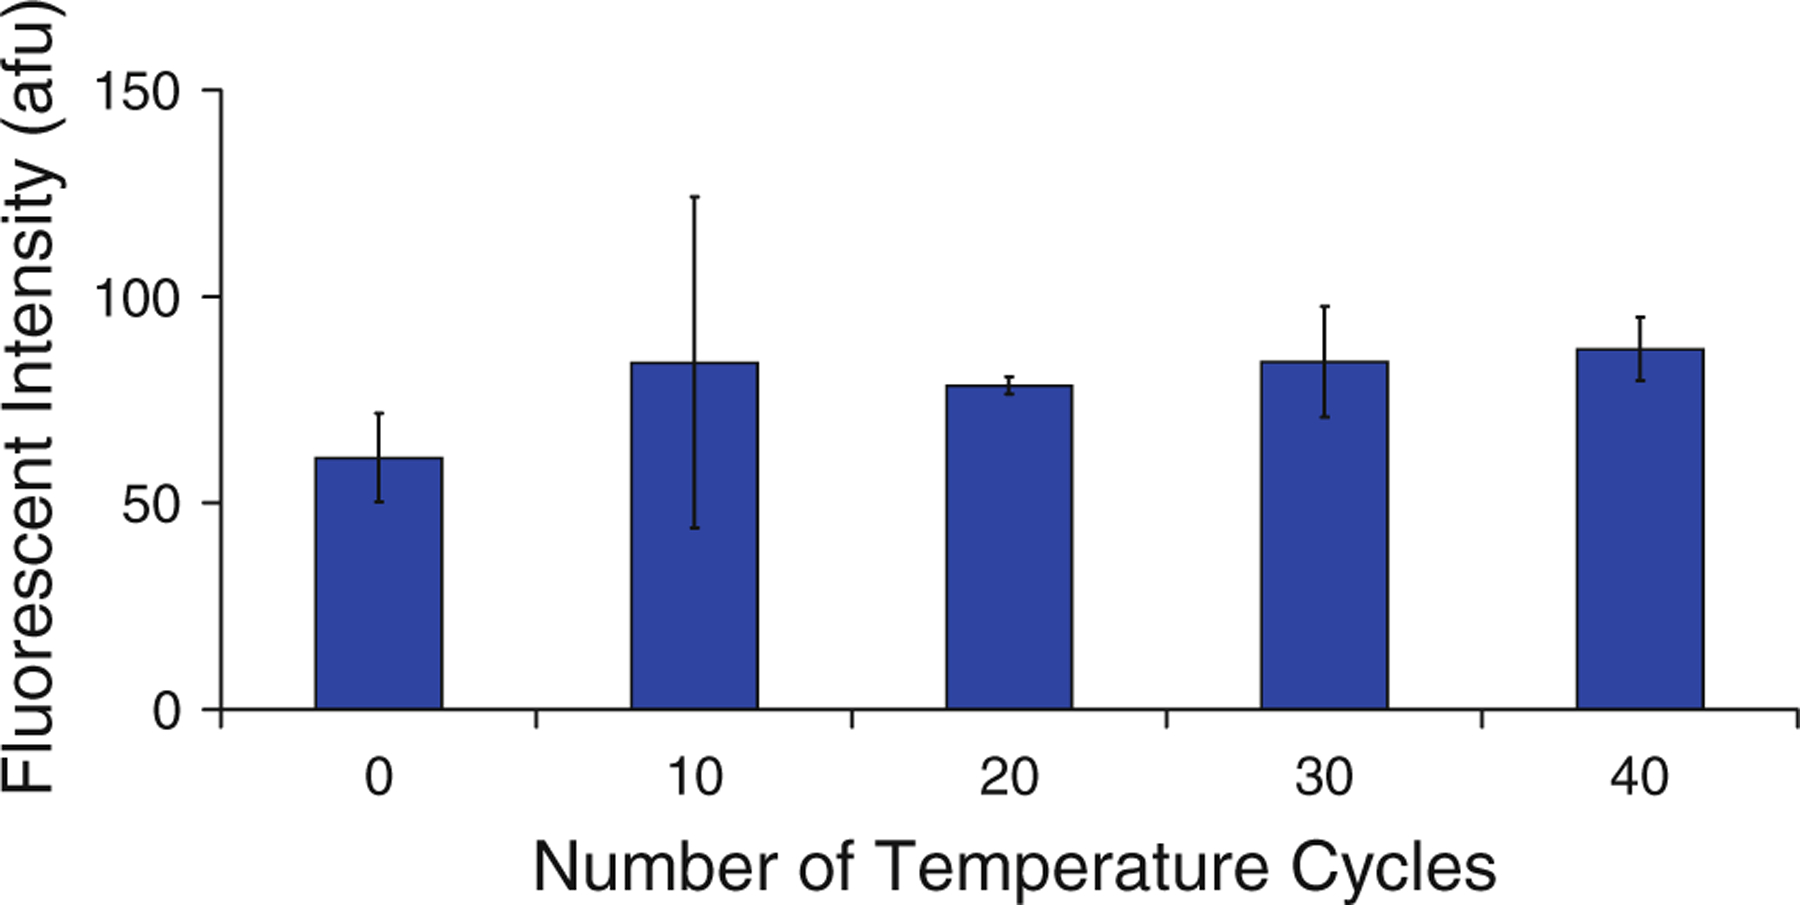
Effect of temperature on fluorescence measurements, n = 3. The negligible change in fluorescence intensity indicates that temperature cycling does not degrade dual-biotin functionalization and hence does not affect concentration of DNA at bead surfaces. Error bars indicate one standard deviation from the mean
3.2. Effects of experimental parameters on bead-based PCR
The effects of experimental parameters on bead-based PCR were studied to optimize the ability of the device to detect DNA. During a series of PCR reactions, parameters were varied individually and the results studied to determine the parameters that would generate maximum signal intensity, thus lowering the detection limit of the device.
3.2.1. Control for effects of bead-based amplification
First, solution-based PCR (i.e., excluding microbeads) was performed to confirm device calibration and sequences of both DNA primers (25 bases) and template (181 bases). Following amplification, gel electrophoresis was performed and results indicate that a strand of the expected length (181 bp) was produced (Fig. 5a). This confirms that the device temperature control is accurate enough to perform PCR, and that the DNA has been properly designed and synthesized. This test was then repeated using bead-based PCR and produced identical results (Fig. 5b), following DNA recovery from the beads via biotin–streptavidin denaturation in a 95 °C formamide bath. Following ethanol precipitation of the DNA and resuspension in distilled H2O, gel electrophoresis was performed. These results indicate that coupling the reverse primers to the beads does not cause improper DNA amplification (such as the generation of spurious products). In addition to the comparison with solution-based PCR, bead-based PCR tests were conducted with smaller reaction volumes (5 μL), and this was not found to influence the average fluorescent signal intensity following amplification.
Fig. 5.
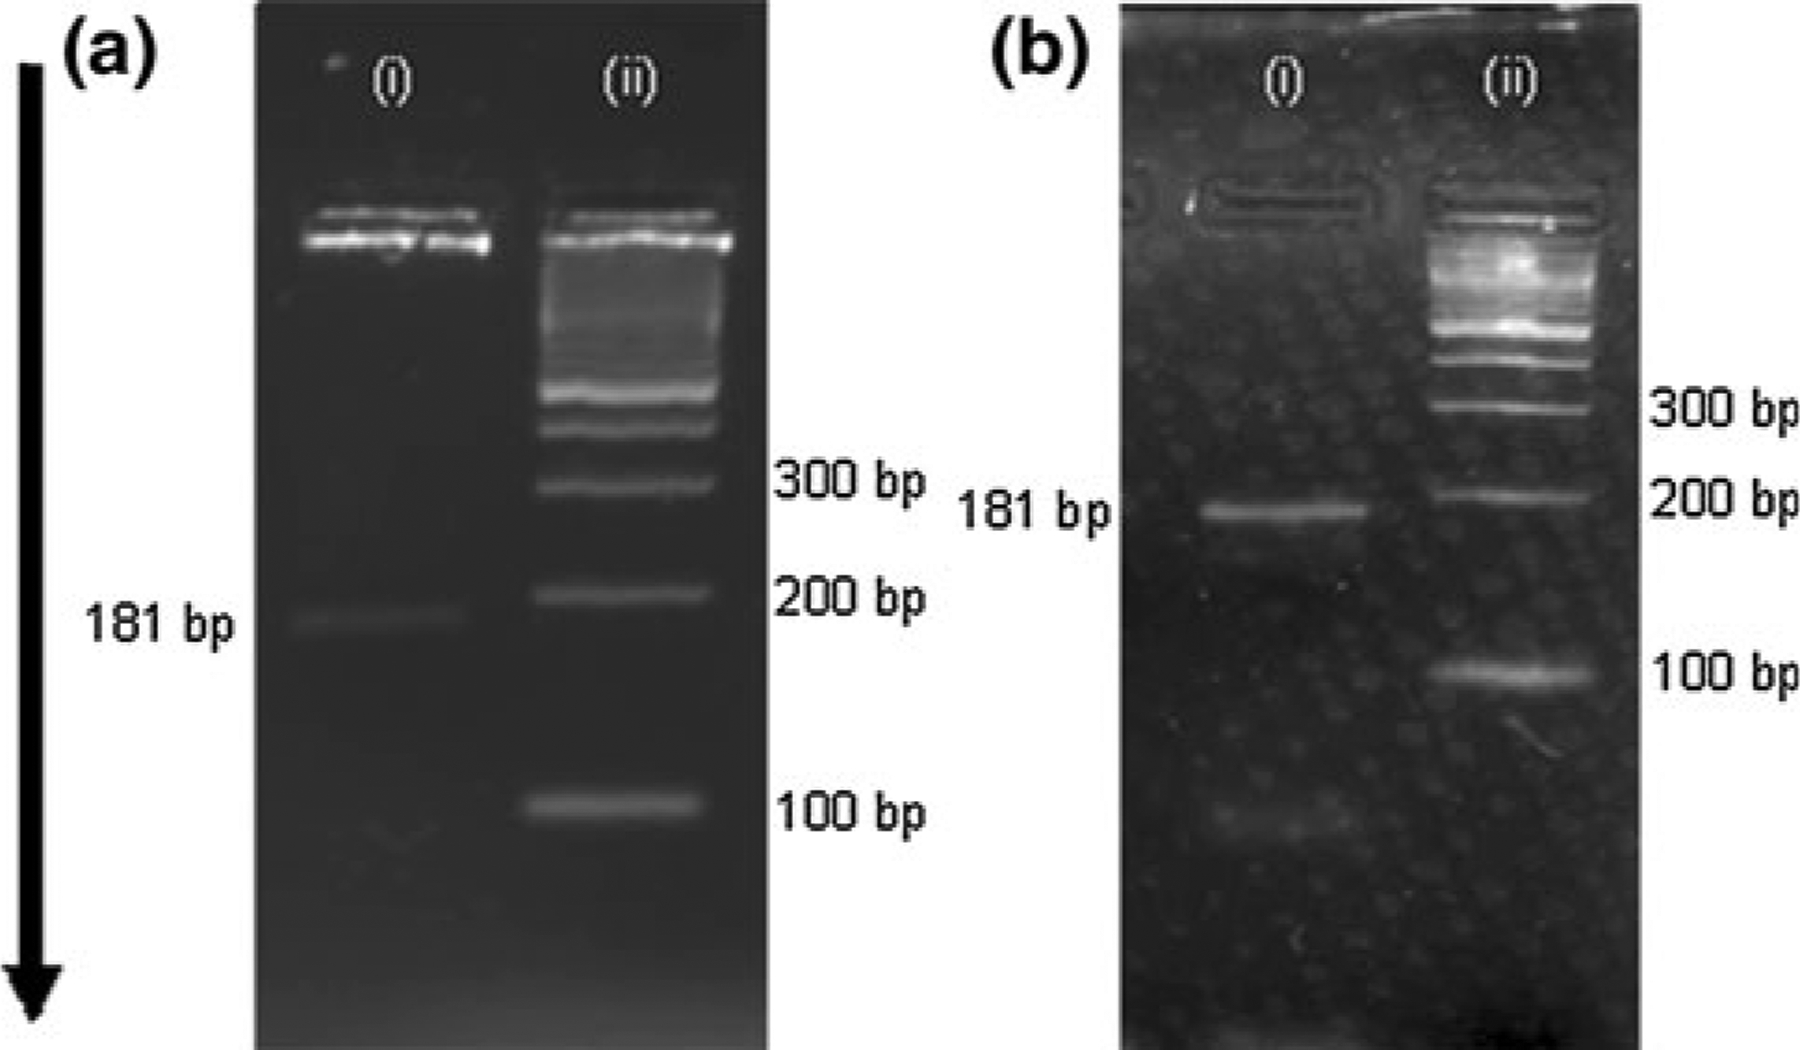
Gel electrophoresis analysis of PCR tests using the 181 bp B. pertussis DNA amplification chemistry. Gel a displays the results of a solution-based test, and gel b shows the results of a bead-based test. In both gels, lane i is a sample of PCR products mixed with loading buffer, and lane ii is a 100 bp ladder (dsDNA for length reference). Arrow indicates the direction of DNA movement, with smaller strands migrating faster
3.2.2. Determination of optimum magnesium concentration and dwell time
Optimum magnesium concentration was determined to be 1.5 mM, consistent with typical MgCl2 concentrations for PCR studies (Supplemental Information) (Harris and Jones 1997; Roux 1995). A series of tests also determined that a consistent 20 s dwell time, or time spent at each temperature setpoint during a PCR cycle, would produce DNA most efficiently (Supplemental Information).
3.2.3. Determination of optimum annealing temperature
The effect of annealing temperature on the concentration and length of DNA generated during PCR was then studied. The annealing temperature affects the hybridization of the primers to the template DNA; a higher annealing temperature typically results in more specific hybridization (less erroneous hybridization of a primer to an unspecified DNA sequence), but less total hybridization of DNA (and therefore less product DNA after PCR) (Harris and Jones 1997; Roux 1995). A series of bead-based PCR tests was conducted using the B. pertussis primer set in which the annealing temperature was varied. The results indicated that fluorescent intensity of the beads following PCR remained approximately consistent (Fig. 6). Large variation in individual test results was observed for tests with an annealing temperature of 54 °C; it is possible that non-specific annealing at this temperature causes wide variability in reaction efficiency.
Fig. 6.
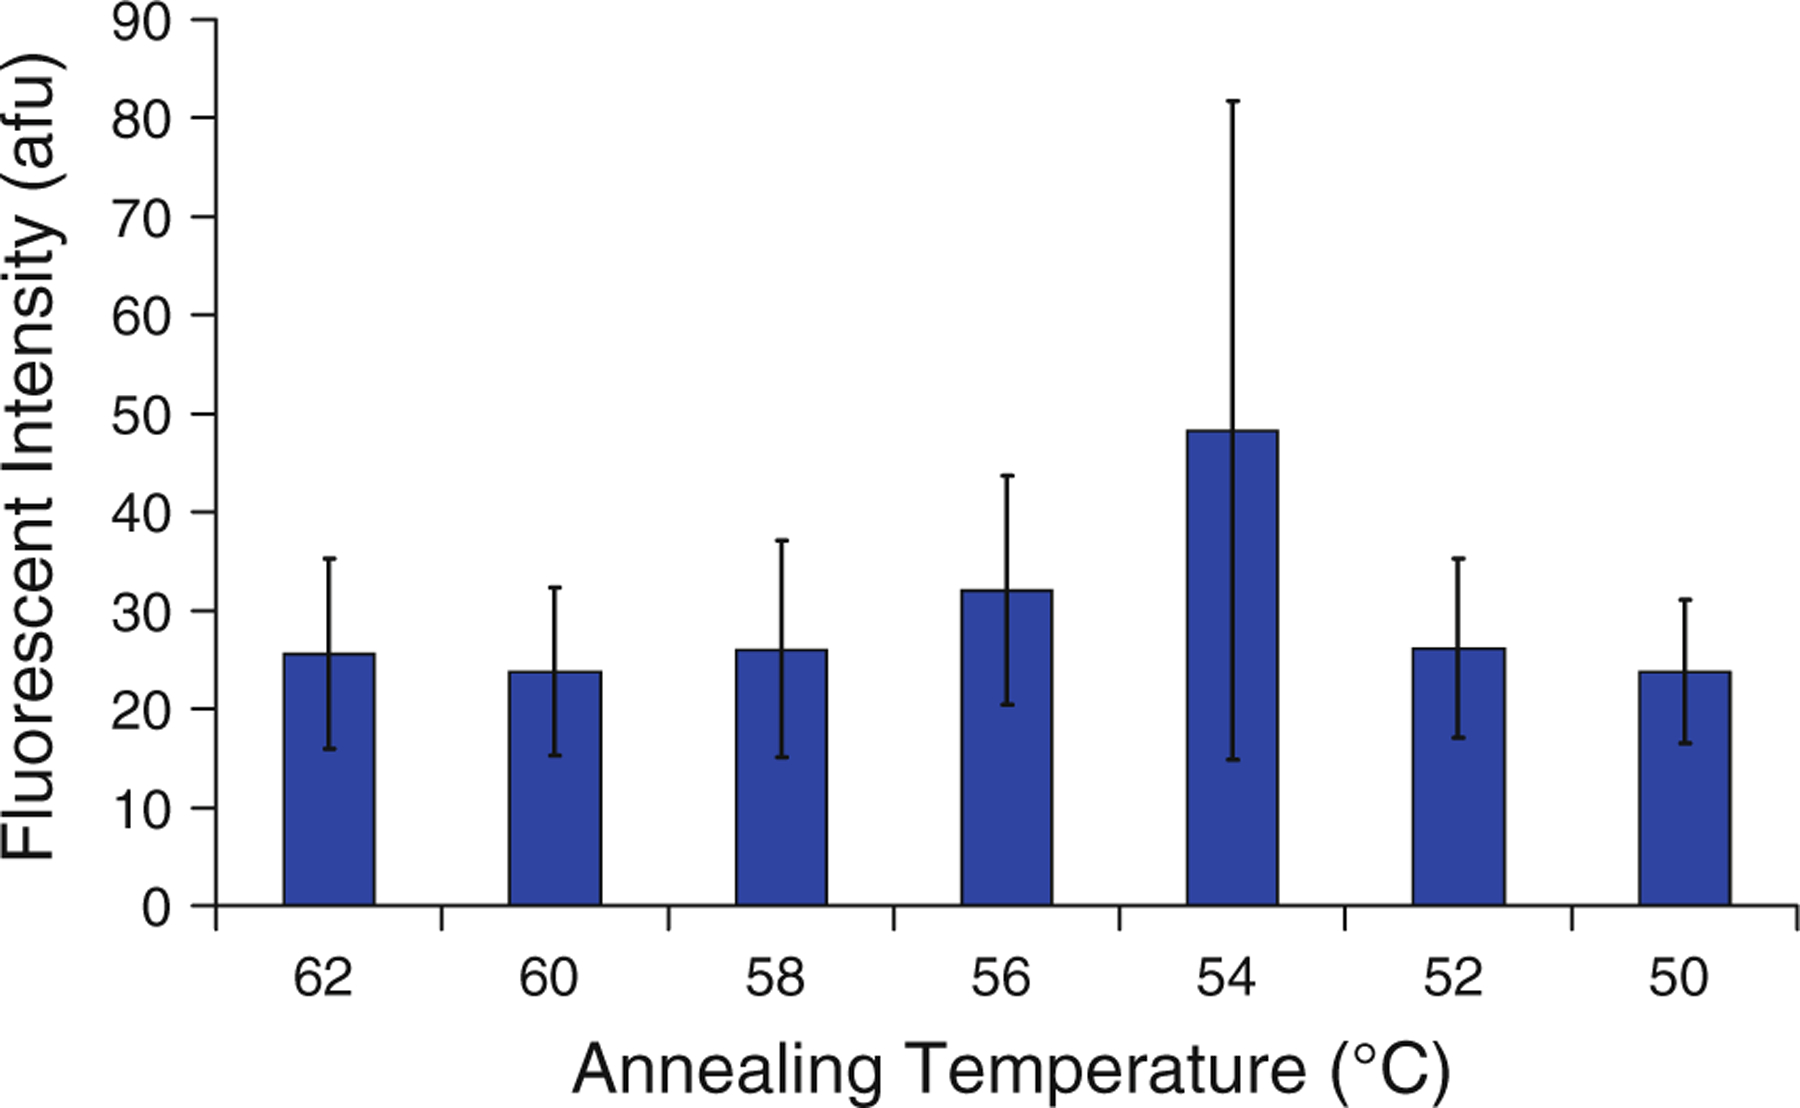
Effect of annealing temperature on fluorescent intensity after bead-based PCR, n = 3, with error bars representing one standard deviation from the mean
The annealing temperature test was then repeated with conventional solution-based PCR, and the results were analyzed using gel electrophoresis (Fig. 7). Results indicated no amplification at 52 °C, very close to the temperature at which a high degree of variability was observed in the bead-based tests. As it appears that this range of annealing temperatures produces sporadic results, a higher annealing temperature was chosen for future testing. The results from the solution-based experiments suggested that an annealing temperature of 58 °C minimized generation of primer–dimers, a type of non-specific amplification which occurs when two primers hybridize and are extended during PCR. Bead-based PCR results cannot discern the length of generated DNA, so non-specific amplification represents a source of false positive readings during DNA detection. This effect must be inhibited to maximize sensor specificity. The optimized PCR cycle parameters (cycle times and temperatures) have been summarized in Table 1.
Fig. 7.
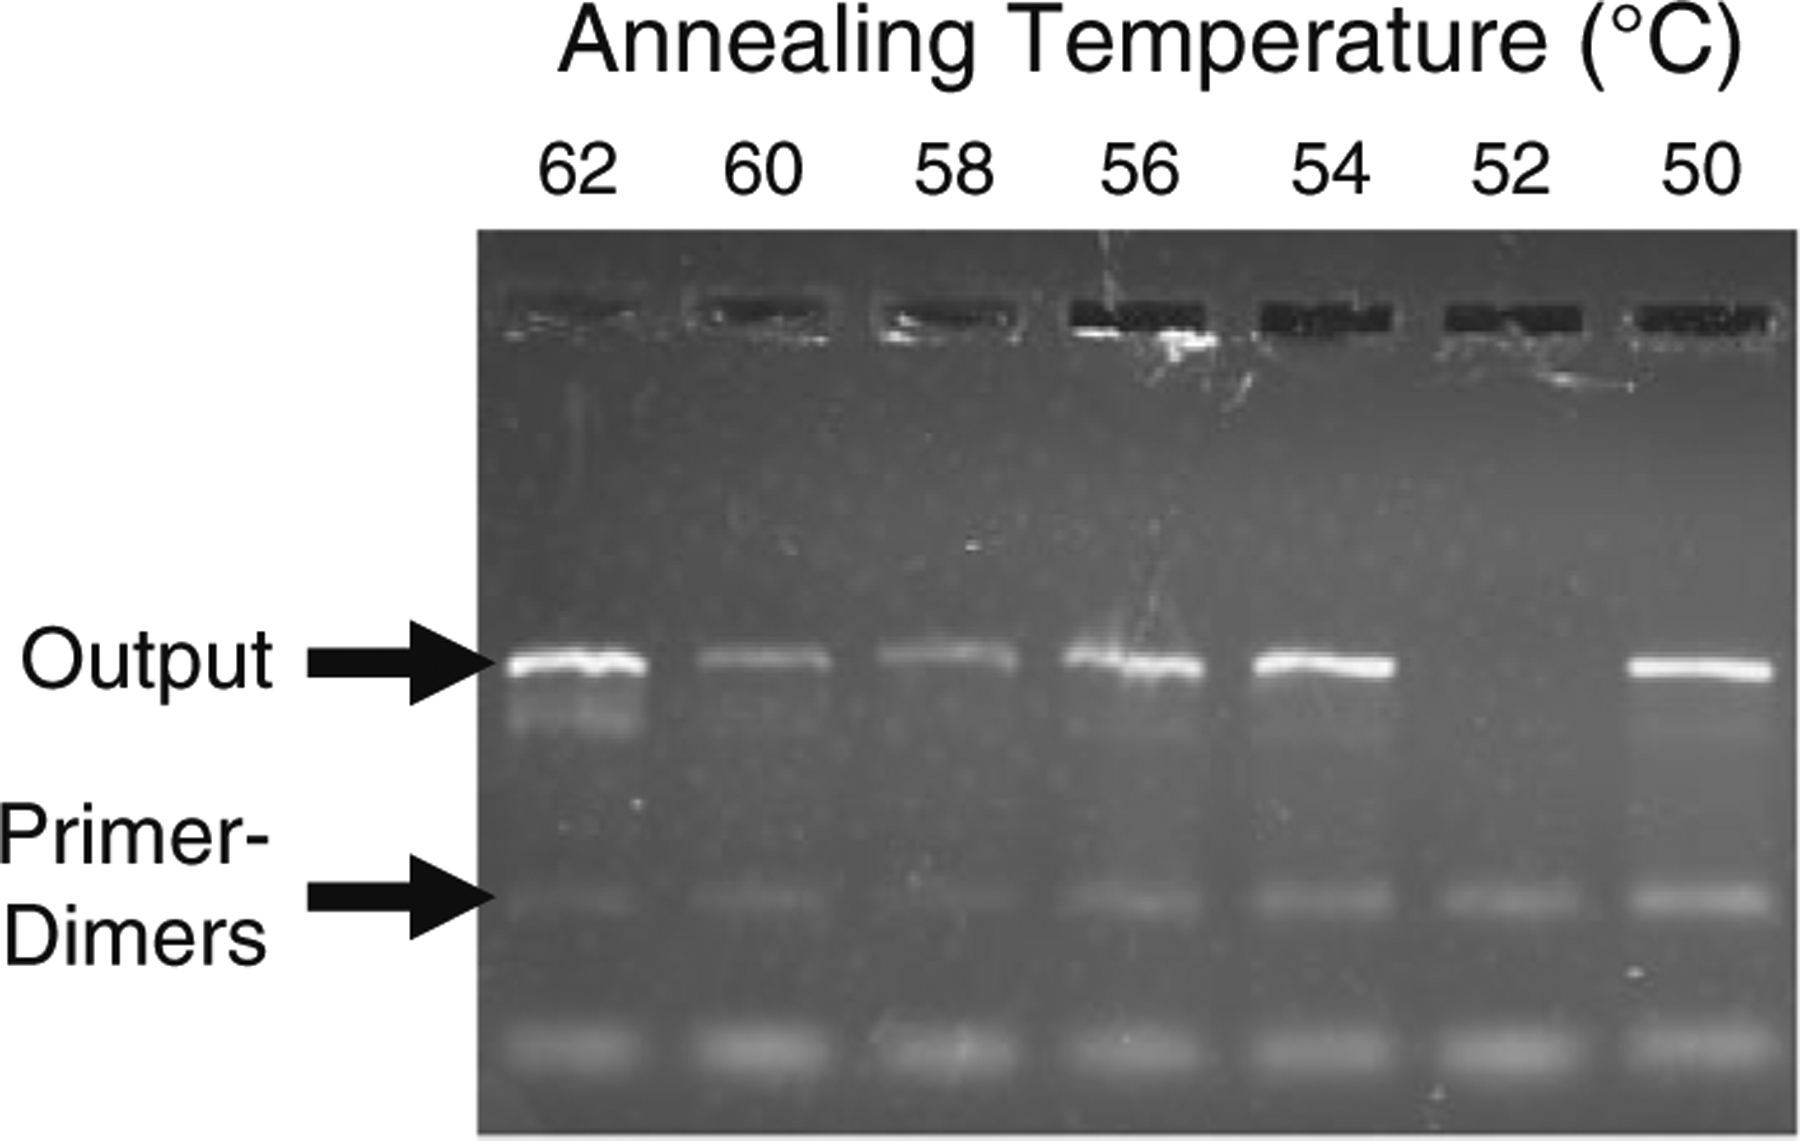
Gel electropherogram showing effects of annealing temperature on amplified DNA following solution-based PCR
Table 1.
Summary of PCR cycle parameters
| Stage | Temperature (°C) | Dwell time (s) |
|---|---|---|
| Pre-melting | 95 | 60 |
| Thermal cycling | 95 | 20 |
| 58 | 20 | |
| 72 | 20 | |
| Post-extension | 72 | 180 |
3.2.4. Investigation of effects of bead concentration on bead-based PCR
Next, the bead-based PCR detection device was optimized with respect to the concentration of beads in the reaction mixture. The presence of a solid surface in bead-based PCR introduces steric and geometric effects, affecting the reaction efficiency (Adessi et al. 2000; Erickson et al. 2003). Previous studies of solid-phase amplification (Krawczyk and Kulakowski 2005; Mercier et al. 2003; Mercier and Slater 2005) focused on maximizing the final concentration of DNA, however, the primary concern of this study is the detection of DNA. The concentration of microbeads in the reaction mixture was therefore investigated and optimized to produce the greatest fluorescent signal. To test the effects of bead concentration on fluorescent signal intensity, we performed bead-based PCR reactions using optimized conditions (58 °C annealing temperature, 1.5 mM MgCl2 concentration, 10 pM template concentration) and three different concentrations of beads (Fig. 8). It can be seen that ~200 beads/μL generates the most intense fluorescent signal on the beads, with a significant decrease in signal intensity at either a lower or a higher concentration.
Fig. 8.
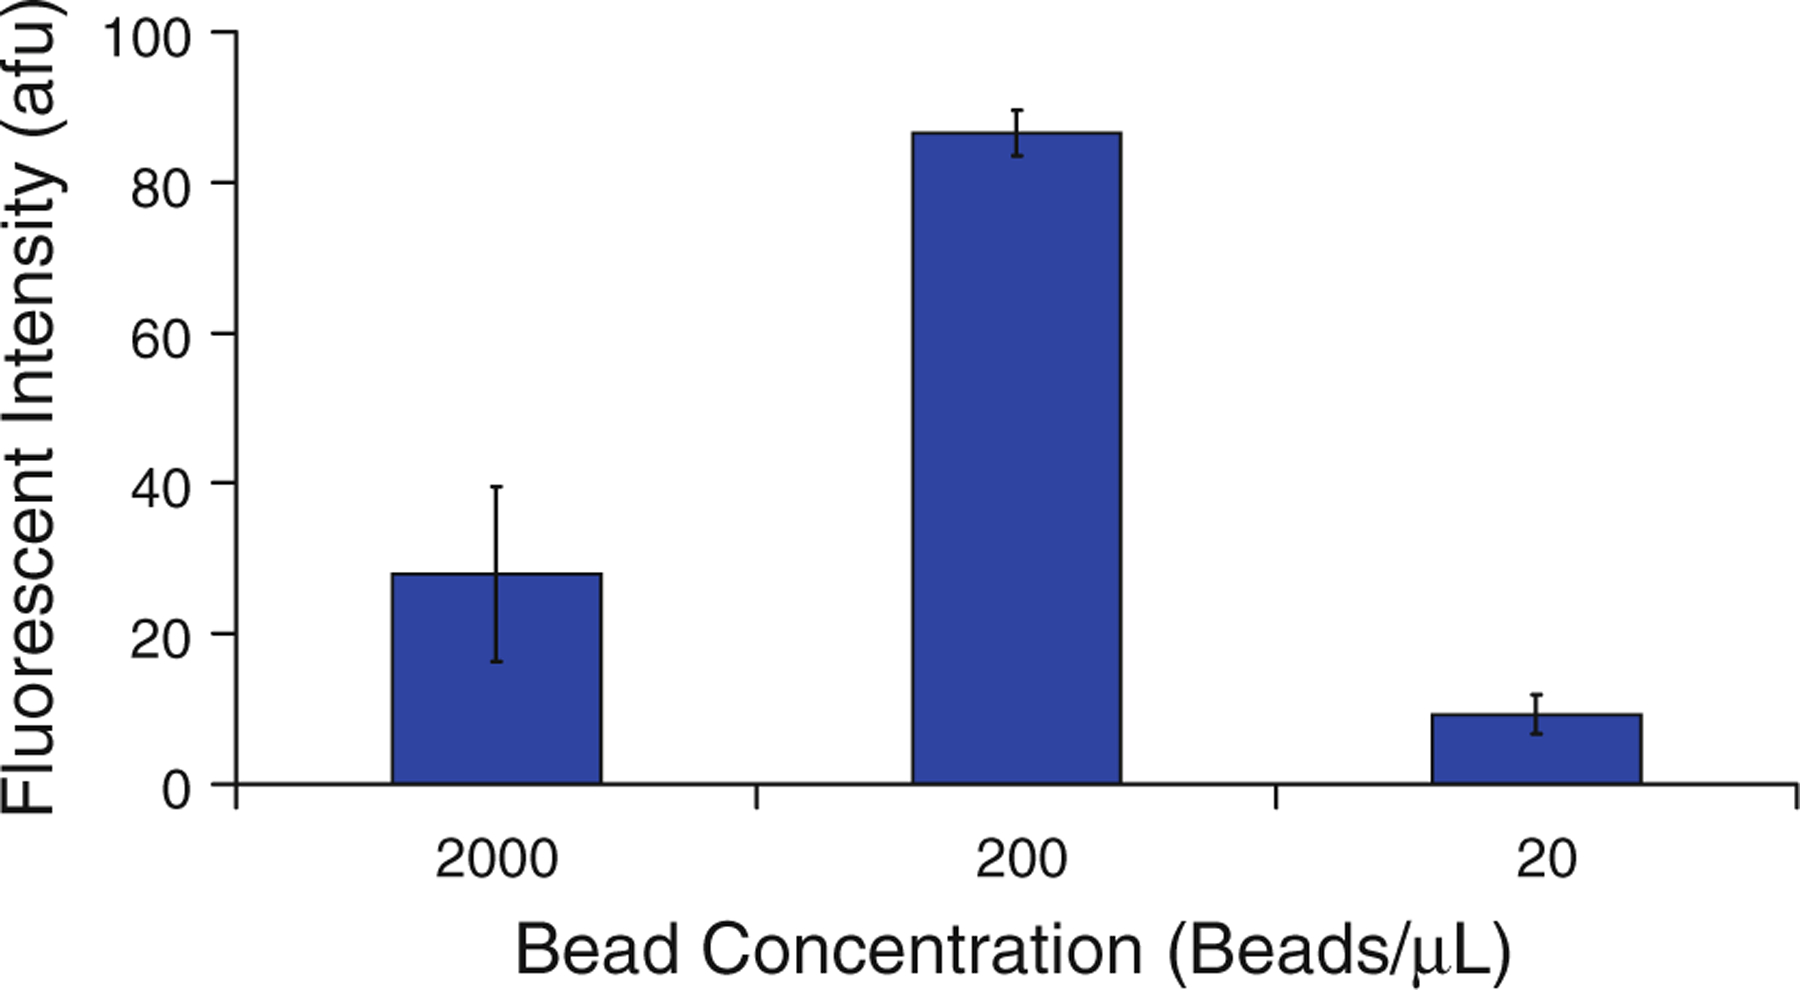
Effect of bead concentration on fluorescent bead intensity following PCR, n = 3, with error bars representing one standard deviation from the mean. Results indicate there is a concentration of microbeads in the reaction mixture which optimizes signal intensity following the PCR reaction. The Student’s t test confirms that the 200 beads/μL result is differentiable from the other results, p < 0.11 %
The sharp peak in Fig. 8 can be explained by the relationship between the concentration of microbeads in the reaction mixture and the total surface area of the surface-based PCR reaction. At higher concentrations of microbeads, the fluorescently labeled product DNA is spread across a larger number of beads. The greater surface area results in a weaker fluorescent signal because the signal strength is proportional to the surface density of the fluorescent labels. On the other hand, a lower concentration of beads does not imply a higher surface concentration of DNA. At these bead concentrations, the greater density of reverse primers limits the reaction by steric hindrance between molecules at the bead surfaces. As noted in previous studies, increasing proximity of reverse primers to one another on solid surfaces can hinder the ability of DNA in solution to hybridize to the bead-bound primers (Mercier et al. 2003; Mercier and Slater 2005). In addition to steric hindrance, the increasing density of the fluorophores on the bead surfaces may result in quenching due to proximity of other fluorophores and nucleotides, which are known to inhibit fluorescence (Nazarenko et al. 2002). Alternatively, a lack of microbeads in the reaction will cause some reverse primers to remain in solution, as each bead can support a limited number of primers. The competition of these in-solution primers for the template DNA and the lower efficiency due to steric hindrance account for the drop in signal intensity at lower bead concentrations. Figure 8 shows that there is a ninefold decrease in signal intensity from 200 to 20 beads/μL, indicating that bead concentration strongly influences the ability of the sensor to detect DNA. Based on the results, in the future it may be possible to predict the optimum concentration of beads for a DNA sensor using bead-based PCR.
3.3. Investigation of detection sensitivity
Finally, the device was tested to determine its ability to detect synthetic gDNA. Detection criteria included the limit of detection (the smallest concentration of DNA that could be detected) and the number of PCR cycles necessary for detection. The limit of detection of the device was investigated by performing a series of PCR reactions while changing the concentration of template DNA in the reactants. Concentrations ranging from zero templates to 1 pM (~6 × 10⁵ copies/μL) were tested. PCR reactions were run for 10 cycles (~15 min) using the optimized test conditions discussed above (200 beads per microliter, 20 s dwell times, 58 °C annealing temperature, and 1.5 mM MgCl2). As can be seen in Fig. 9, concentrations of 0.1 pM and less produced an increase in fluorescence above the zero template reaction. As indicated by the error bars, however, this increase is within one standard deviation of the average fluorescence for the zero template tests. Zero template amplifications produce a fluorescent signal because non-specific amplification products such as primer–dimers are detected in addition to properly amplified DNA. This effect is investigated further in the following discussion of signal intensity versus cycle number. A template concentration of 1 pM, however, produced a signal distinguishable from the zero template control, as determined by the Student’s t test with a 95 % confidence level. These results are comparable to those obtained recently using a microfluidic quantitative PCR device (Wang et al. 2009). In addition, this detection limit is orders of magnitude smaller than limits reported in similar studies using PCR with electrochemical labels (Lermo et al. 2007) or optical detection on a flat surface (Hiep et al. 2010).
Fig. 9.
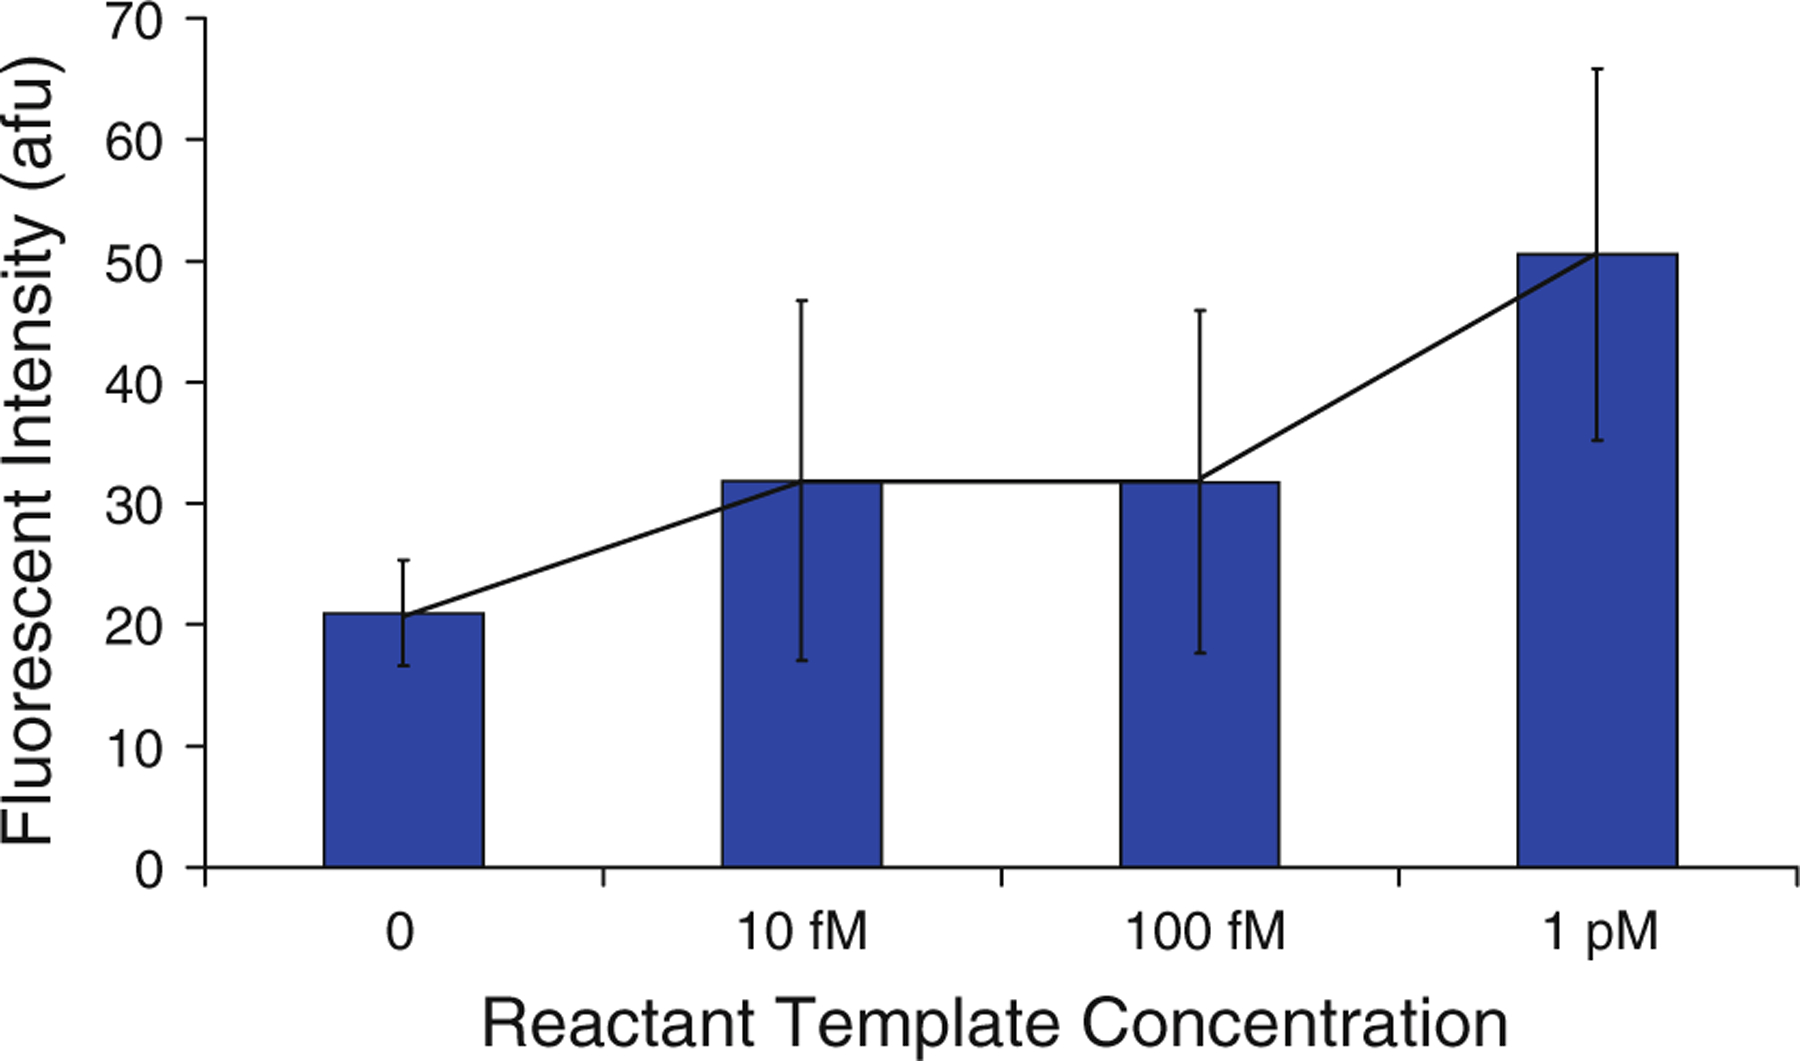
Investigation of DNA detection limit. Fluorescent intensity of beads following the PCR reactions is plotted against concentration of templates in the reaction mixture. Error bars indicate one standard deviation from the mean of three experiments (n = 3), and the reaction with zero templates (control) and a 1 pM template concentration (the detection limit) is differentiable with a probability of >95 %, according to the Student’s t test
In addition to measuring the detection limit of the device, we also investigated the relationship between signal intensity and the number of PCR cycles performed prior to detection. It was possible that increasing the assay time (the number of PCR cycles) would improve the signal strength, thereby lowering the detection limit. For this investigation, bead-based PCR reactions were performed as discussed in the previous section, but a 1 pM (~6 × 10⁵ copies/μL) concentration was consistently used and the number of PCR cycles was varied. As can be seen in Fig. 10, signal intensity at 10 cycles is well above background levels and increases from 10 to 30 cycles. There is a slight decrease in signal from 10 to 20 cycles that can possibly be explained by several effects associated with solid-phase amplification. Previous studies have noted a number of detrimental effects, such as non-specific amplification between two surface-bound primers or creation of sterile (incomplete) molecules, both of which could then reverse themselves with further amplification (Adessi et al. 2000; Mercier et al. 2003). In addition to amplification of a 1 pM sample, a control sample with no template DNA was also amplified and the results are displayed in Fig. 10. The control signal shows a linear increase in intensity, but consistently remains below that of the test sample.
Fig. 10.
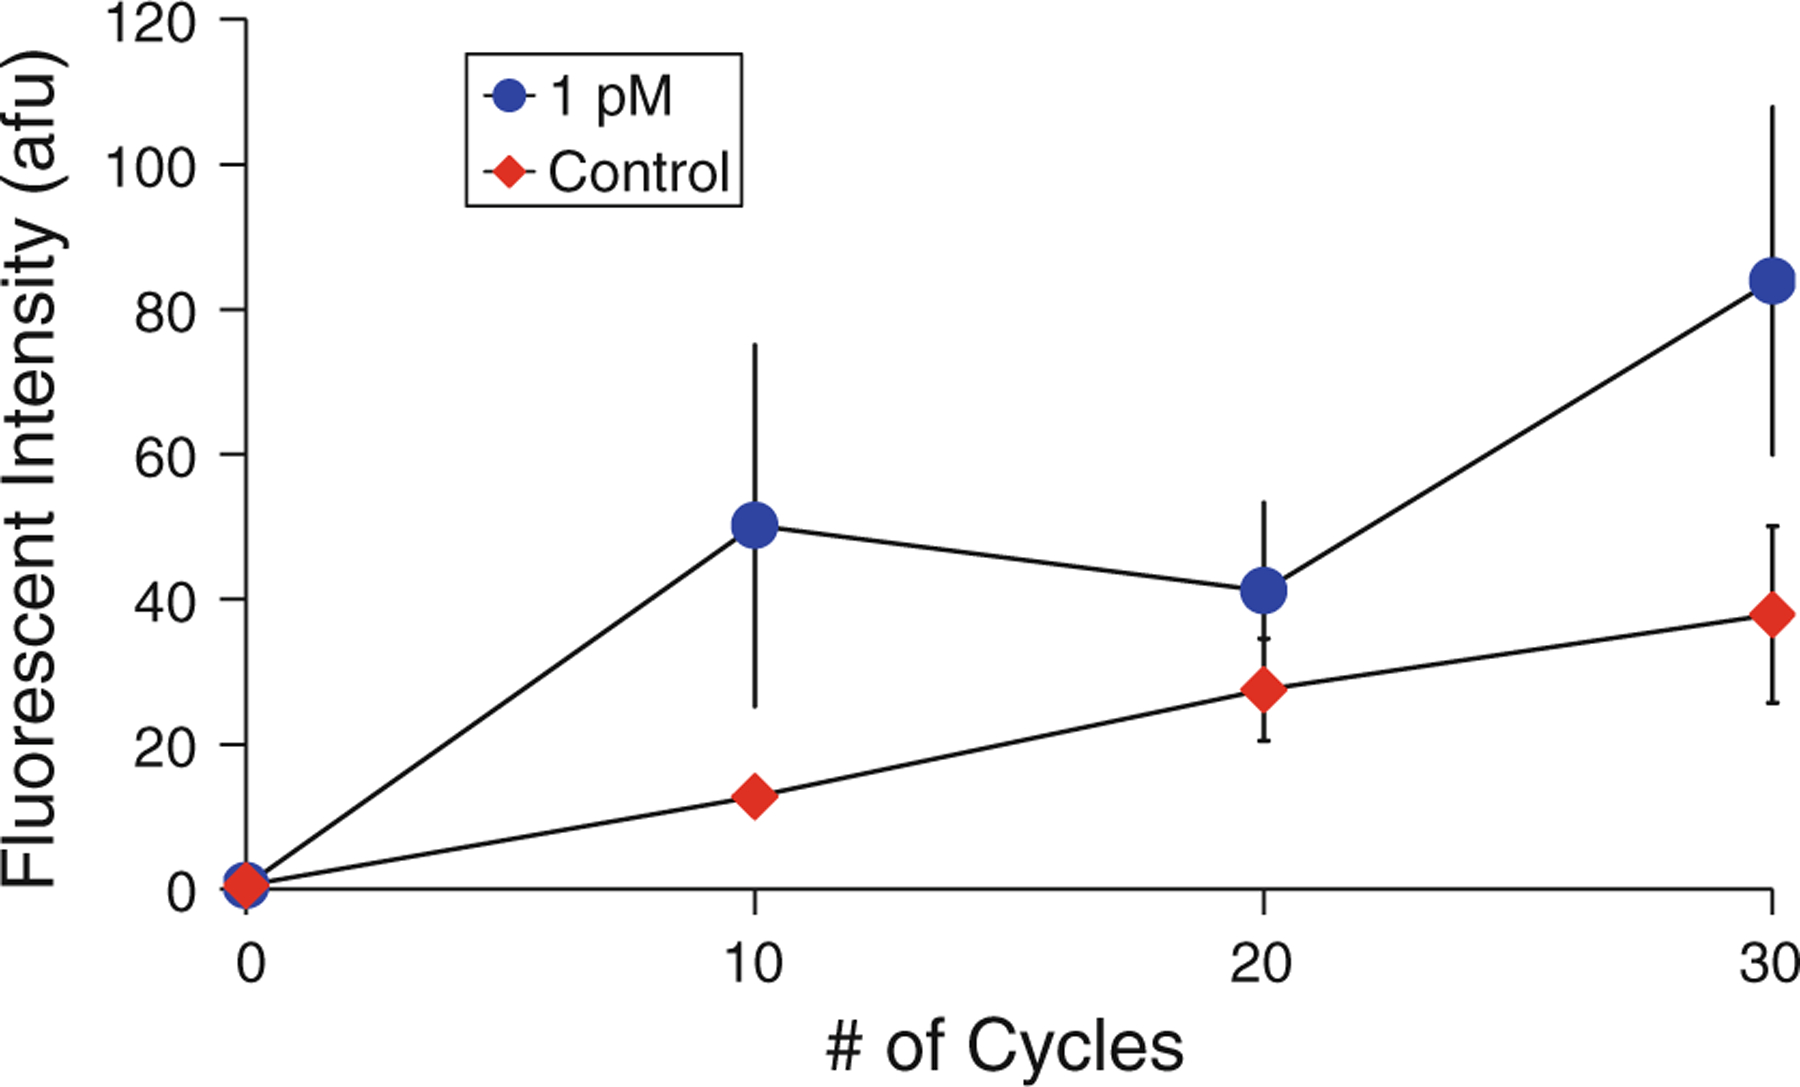
Relationship between signal intensity and the number of PCR cycles used during amplification of a 1 pM sample. Mean values from multiple tests (n = 3) are shown, error bars indicate standard deviation
These results have two important indications for the design of a bead-based PCR DNA detection test. First, the zero template control signal remains below that of the 1 pM signal, indicating that non-specific amplification does not impair the specificity of the test. Second, increasing the number of PCR cycles may not improve sensitivity. While the fluorescent signal intensity increases overall with increasing numbers of PCR cycles, the control signal increases as well. If this signal is considered to be background, the signal to background ratio as shown in this graph decreases with increasing numbers of PCR cycles, from 3.9 at 10 cycles to 2.2 at 30 cycles. This may be attributed to the continued generation of non-specific amplification products when amplifying with no template molecules (Brownie et al. 1997). As discussed in Sect. 3.2, the decrease in fluorescence may also be a result of quenching of fluorophores at the bead surfaces due to the proximity of other fluorophores and DNA. It appears that the signal does not mimic the exponential nature of PCR amplification; while data from the literature (Dressman et al. 2003; González et al. 1999; Holmberg et al. 2005) and our control tests (Fig. 4) showed that this was not a result of loss of DNA from the beads at elevated temperatures, the exact nature of the relationship between fluorescent signal intensity and surface density of DNA needs to be further investigated.
3.4. Integrated bead-based PCR operation
To demonstrate the utility of our bead-based PCR scheme in an integrated device, we performed DNA capture, amplification, detection, and purification in a single microfluidic chamber. A 5 μL volume of microbeads (concentration ~200 beads/μL) was inserted into the microchamber (Fig. 11a), and 10 pM template DNA (~6 × 10⁶ copies/μL) was then inserted and allowed to incubate for a period of 10 min (Fig. 11b). This solution was then removed and PCR reaction mixture introduced, at which point the integrated heaters and sensors were used to cycle the chamber temperature to effect 10 cycles of PCR. Following amplification, the reaction mixture was removed by washing with pure buffer, leaving only beads coated with fluorescently labeled DNA in the microchamber (Fig. 11c). Analysis of the fluorescent micrograph indicated that the beads fluoresced with an intensity of 75.9 afu, well above the detection limit determined in previous experiments (Sect. 3.3). The chamber temperature was then raised and maintained at 95 °C for 5 min, denaturing the bead-bound ssDNA and eluting it into a pure buffer solution. UV/VIS spectroscopy confirmed that the eluent contained 163.6 ng/μL ssDNA. A fluorescent micrograph of the microbeads that remained in the microchamber (not shown) confirmed that product ssDNA had indeed been removed from the beads. These results illustrate that the use of bead-based PCR can enable the design of a highly integrated microchip for DNA purification and detection, with precise control of buffer conditions during on-chip procedures. In the future, devices using this approach could easily be automated to perform all of the above procedures independent of user intervention.
Fig. 11.
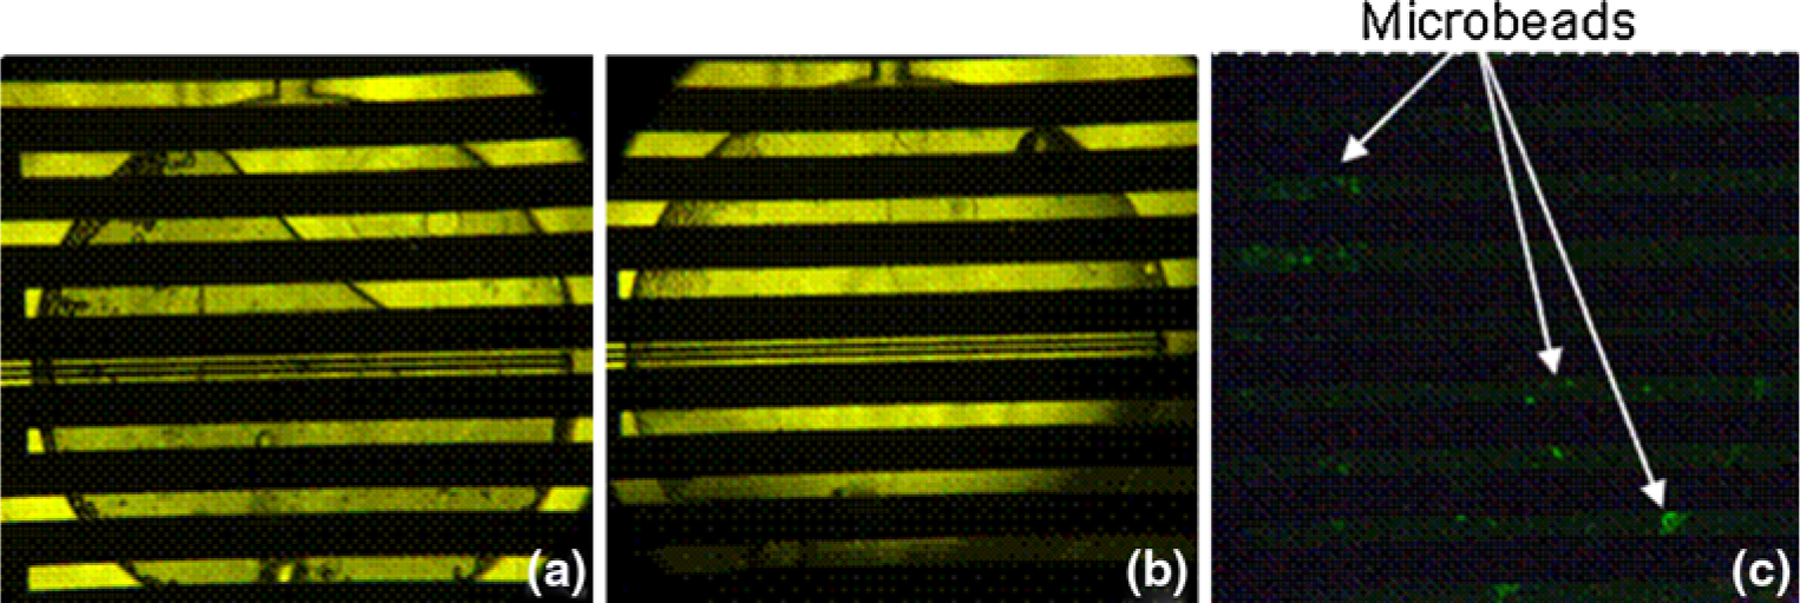
Micrographs of the microchamber illustrate the process of integrated microfluidic bead-based PCR. In a, a brightfield micrograph shows a microchamber in which beads have been inserted into the chamber and a DNA solution is being introduced (fluid flowing from top to bottom). In b, the DNA solution has been introduced, and template DNA is being captured from the solution onto bead surfaces by bead-bound reverse primers. Following PCR cycling, and washing with buffer, the fluorescent intensity of the microbeads was measured with minimal background fluorescence (c)
4. Conclusions
There is a strong need for innovative methods for DNA manipulation and detection to enable improved molecular biology analysis and diagnostics. Aiming to address this need, we have demonstrated a microchip that is capable of amplifying and detecting trace amounts of DNA via bead-based PCR amplification and fluorescent labeling and detection. The device uses dual-biotin labels on the reverse primers and carboxyfluorescein labels on the forward primers to produce labeled dsDNA on the surface of streptavidin-coated microbeads. Positive detection of 1 pM of template DNA was achieved in only 10 PCR cycles within 15 min. This is similar to other PCR devices making use of fluorescent probes, in which similar starting template concentrations are typically detected in a comparable number of PCR cycles (Wang et al. 2009).
In contrast to the previous devices that have attempted integration of sample pre-treatment with amplification for isolation of gDNA from lysate (Beyor et al. 2009; Easley et al. 2006; Liu et al. 2004), our approach exploits bead-based amplification and detection, and is hence potentially simpler and more efficient. Microfluidic PCR is capable of detecting as little as a single DNA molecule, (Zhang and Xing 2010), and our results have shown that the bead-based amplification process detects clinically relevant DNA concentrations and allows for single-chamber integration of amplification and detection to upstream and downstream processes that may have incompatible buffer requirements. While making use of polymer microbeads and streptavidin–biotin conjugation for simplicity, our design can easily be adapted to the use of other types of micro- or nanoscale beads (e.g., magnetic beads) as well as covalent attachment schemes that suit specific DNA amplification and analysis needs.
This approach could be extended in the future to include, for example, the improvement of the test specificity and signal to background ratio by generating primer sets that maintain specificity to a target genome while decreasing primer–dimer creation by minimizing affinity between the primers. This may minimize assay time by increasing the signal-to-noise ratio and reducing the number of PCR cycles necessary to attain detection. In addition, primer-coated beads could be used as a SPE matrix for gDNA samples in lysate mixtures (Yeung and Hsing 2006), demonstrating more complex protocols in relatively simple microfluidic devices. Thus, this approach can potentially lead to miniature clinical diagnostic systems with rapid sample-in, answer-out pathogen detection capabilities.
Acknowledgments
We gratefully acknowledge financial support from the National Science Foundation (Award No. CBET-0854030) and the National Institutes of Health (Award Nos. RR025816-02 and CA147925-01) as well as the Alternatives Research Development Foundation.
References
- Adessi C, Matton G, Ayala G, Turcatti G, Mermod J-J, Mayer P, Kawashima E (2000) Solid phase DNA amplification: characterisation of primer attachment and amplification mechanisms. Nucleic Acids Res 28(20):e87. doi: 10.1093/nar/28.20.e87 [DOI] [PMC free article] [PubMed] [Google Scholar]
- Bettiol S, Thompson MJ, Roberts NW, Perera R, Heneghan CJ, Harnden A (2010) Symptomatic treatment of the cough in whooping cough. Cochrane Database Syst Rev (1). doi: 10.1002/14651858.CD003257.pub3 [DOI] [PubMed] [Google Scholar]
- Beyor N, Yi LN, Seo TS, Mathies RA (2009) Integrated capture, concentration, polymerase chain reaction, and capillary electrophoretic analysis of pathogens on a chip. Anal Chem 81(9): 3523–3528. doi: 10.1021/ac900060r [DOI] [PMC free article] [PubMed] [Google Scholar]
- Brownie J, Shawcross S, Theaker J, Whitcombe D, Ferrie R, Newton C, Little S (1997) The elimination of primer–dimer accumulation in PCR. Nucleic Acids Res 25(16):3235–3241. doi: 10.1093/nar/25.16.3235 [DOI] [PMC free article] [PubMed] [Google Scholar]
- Diehl F, Li M, Dressman D, He YP, Shen D, Szabo S, Diaz LA, Goodman SN, David KA, Juhl H, Kinzler KW, Vogelstein B (2005) Detection and quantification of mutations in the plasma of patients with colorectal tumors. Proc Natl Acad Sci USA 102(45):16368–16373. doi: 10.1073/pnas.0507904102 [DOI] [PMC free article] [PubMed] [Google Scholar]
- Diehl F, Li M, He YP, Kinzler KW, Vogelstein B, Dressman D (2006) BEAMing: single-molecule PCR on microparticles in water-in-oil emulsions. Nat Methods 3(7):551–559. doi: 10.1038/nmeth898 [DOI] [PubMed] [Google Scholar]
- Diehl F, Schmidt K, Durkee KH, Moore KJ, Goodman SN, Shuber AP, Kinzler KW, Vogelstein B (2008) Analysis of mutations in DNA isolated from plasma and stool of colorectal cancer patients. Gastroenterology 135(2):489–498. doi: 10.1053/j.gastro.2008.05.039 [DOI] [PMC free article] [PubMed] [Google Scholar]
- Dressman D, Yan H, Traverso G, Kinzler KW, Vogelstein B (2003) Transforming single DNA molecules into fluorescent magnetic particles for detection and enumeration of genetic variations. Proc Natl Acad Sci USA 100(15):8817–8822. doi: 10.1073/pnas.1133470100 [DOI] [PMC free article] [PubMed] [Google Scholar]
- Easley CJ, Karlinsey JM, Bienvenue JM, Legendre LA, Roper MG, Feldman SH, Hughes MA, Hewlett EL, Merkel TJ, Ferrance JP, Landers JP (2006) A fully integrated microfluidic genetic analysis system with sample-in-answer-out capability. Proc Natl Acad Sci USA 103(51):19272–19277. doi: 10.1073/pnas.0604663103 [DOI] [PMC free article] [PubMed] [Google Scholar]
- Erickson D, Li D, Krull UJ (2003) Modeling of DNA hybridization kinetics for spatially resolved biochips. Anal Biochem 317(2):186–200. doi: 10.1016/s0003-2697(03)00090-3 [DOI] [PubMed] [Google Scholar]
- Ferguson BS, Buchsbaum SF, Swensen JS, Hsieh K, Lou XH, Soh HT (2009) Integrated microfluidic electrochemical DNA sensor. Anal Chem 81(15):6503–6508. doi: 10.1021/ac900923e [DOI] [PubMed] [Google Scholar]
- Gan R, Yamanaka Y, Kojima T, Nakano H (2008) Microbeads display of proteins using emulsion PCR and cell-free protein synthesis. Biotechnol Prog 24(5):1107–1114. doi: 10.1002/btpr.43 [DOI] [PubMed] [Google Scholar]
- Glare EM, Paton JC, Premier RR, Lawrence AJ, Nisbet IT (1990) Analysis of a repetitive DNA-sequence from Bordetella pertussis and its application to the diagnosis of pertussis using the polymerase chain reaction. J Clin Microbiol 28(9):1982–1987 [DOI] [PMC free article] [PubMed] [Google Scholar]
- González M, Argaraña CE, Fidelio GD (1999) Extremely high thermal stability of streptavidin and avidin upon biotin binding. Biomol Eng 16(1–4):67–72. doi: 10.1016/s1050-3862(99)00041-8 [DOI] [PubMed] [Google Scholar]
- Harris S, Jones DB (1997) Optimisation of the polymerase chain reaction. Br J Biomed Sci 54(3):166–173 [PubMed] [Google Scholar]
- He QS, Mertsola J, Soini H, Skurnik M, Ruuskanen O, Viljanen MK (1993) Comparison of polymerase chain-reaction with culture and enzyme-immunoassay for diagnosis of pertussis. J Clin Microbiol 31(3):642–645 [DOI] [PMC free article] [PubMed] [Google Scholar]
- Hiep HM, Kerman K, Endo T, Saito M, Tamiya E (2010) Nanostructured biochip for label-free and real-time optical detection of polymerase chain reaction. Anal Chim Acta 661(1): 111–116. doi: 10.1016/j.aca.2009.12.006 [DOI] [PubMed] [Google Scholar]
- Hilton JP, Nguyen TH, Pei RJ, Stojanovic M, Lin Q (2011) A microfluidic affinity sensor for the detection of cocaine. Sens Actuator A Phys 166(2):241–246. doi: 10.1016/j.sna.2009.12.006 [DOI] [Google Scholar]
- Holmberg A, Blomstergren A, Nord O, Lukacs M, Lundeberg J, Uhlen M (2005) The biotin-streptavidin interaction can be reversibly broken using water at elevated temperatures. Electrophoresis 26(3):501–510. doi: 10.1002/elps.200410070 [DOI] [PubMed] [Google Scholar]
- Kojima T, Takei Y, Ohtsuka M, Kawarasaki Y, Yamane T, Nakano H (2005) PCR amplification from single DNA molecules on magnetic beads in emulsion: application for high-throughput screening of transcription factor targets. Nucleic Acids Res 33(17):e150. doi: 10.1093/nar/gni143 [DOI] [PMC free article] [PubMed] [Google Scholar]
- Krawczyk MJ, Kulakowski K (2005) Off-lattice simulation of the solid phase DNA amplification. Comput Phys Commun 170(2):131–136. doi: 10.1016/j.cpc.2005.03.108 [DOI] [Google Scholar]
- Kumaresan P, Yang CJ, Cronier SA, Blazej RG, Mathies RA (2008) High-throughput single copy DNA amplification and cell analysis in engineered nanoliter droplets. Anal Chem 80(10): 3522–3529. doi: 10.1021/ac800327d [DOI] [PubMed] [Google Scholar]
- Lee JY, Kim JJ, Park TH (2003) Miniaturization of polymerase chain reaction. Biotechnol Bioprocess Eng 8(4):213–220 [Google Scholar]
- Lermo A, Campoy S, Barbe J, Hernandez S, Alegret S, Pividori MI (2007) In situ DNA amplification with magnetic primers for the electrochemical detection of food pathogens. Biosens Bioelectron 22(9–10):2010–2017. doi: 10.1016/j.bios.2006.08.048 [DOI] [PubMed] [Google Scholar]
- Li Y, Zhang C, Xing D (2011) Fast identification of foodborne pathogenic viruses using continuous-flow reverse transcription-PCR with fluorescence detection. Microfluid Nanofluid 10(2):367–380. doi: 10.1007/s10404-010-0675-3 [DOI] [Google Scholar]
- Lien KY, Lee SH, Tsai TJ, Chen TY, Lee GB (2009) A microfluidic-based system using reverse transcription polymerase chain reactions for rapid detection of aquaculture diseases. Microfluid Nanofluid 7(6):795–806. doi: 10.1007/s10404-009-0438-1 [DOI] [Google Scholar]
- Liu RH, Yang JN, Lenigk R, Bonanno J, Grodzinski P (2004) Self-contained, fully integrated biochip for sample preparation, polymerase chain reaction amplification, and DNA microarray detection. Anal Chem 76(7):1824–1831. doi: 10.1021/ac0353029 [DOI] [PubMed] [Google Scholar]
- Lonneborg A, Sharma P, Stougaard P (1995) Construction of subtractive cDNA library using magnetic beads and PCR. PCR Methods Appl 4(4):S168–S176 [DOI] [PubMed] [Google Scholar]
- Mercier J-F, Slater GW (2005) Solid phase DNA amplification: a Brownian dynamics study of crowding effects. Biophys J 89(1):32–42. doi: 10.1529/biophysj.104.051904 [DOI] [PMC free article] [PubMed] [Google Scholar]
- Mercier JF, Slater GW, Mayer P (2003) Solid phase DNA amplification: a simple Monte Carlo lattice model. Biophys J 85(4): 2075–2086 [DOI] [PMC free article] [PubMed] [Google Scholar]
- Mullis KB, Faloona FA (1987) Specific synthesis of DNA in vitro via a polymerase-catalyzed chain reaction. In: Ray W (ed) Methods in enzymology, vol 155. Academic Press, New York, pp 335–350 [DOI] [PubMed] [Google Scholar]
- Nazarenko I, Pires R, Lowe B, Obaidy M, Rashtchian A (2002) Effect of primary and secondary structure of oligodeoxyribonucleotides on the fluorescent properties of conjugated dyes. Nucleic Acids Res 30(9):2089–2095. doi: 10.1093/nar/30.9.2089 [DOI] [PMC free article] [PubMed] [Google Scholar]
- Northrup MA, Benett B, Hadley D, Landre P, Lehew S, Richards J, Stratton P (1998) A miniature analytical instrument for nucleic acids based on micromachined silicon reaction chambers. Anal Chem 70(5):918–922 [DOI] [PubMed] [Google Scholar]
- Probert WS, Ely J, Schrader K, Atwell J, Nossoff A, Kwan S (2008) Identification and evaluation of new target sequences for specific detection of Bordetella pertussis by real-time PCR. J Clin Microbiol 46(10):3228–3231. doi: 10.1128/jcm.00386-08 [DOI] [PMC free article] [PubMed] [Google Scholar]
- Roper MG, Easley CJ, Landers JP (2005) Advances in polymerase chain reaction on microfluidic chips. Anal Chem 77(12):3887–3893. doi: 10.1021/ac050756m [DOI] [PubMed] [Google Scholar]
- Roux KH (1995) Optimization and troubleshooting in PCR. Genome Res 4(5):S185–S194 [DOI] [PubMed] [Google Scholar]
- Shendure J, Porreca GJ, Reppas NB, Lin XX, McCutcheon JP, Rosenbaum AM, Wang MD, Zhang K, Mitra RD, Church GM (2005) Accurate multiplex polony sequencing of an evolved bacterial genome. Science 309(5741):1728–1732. doi: 10.1126/science.1117389 [DOI] [PubMed] [Google Scholar]
- Shin YS, Cho K, Lim SH, Chung S, Park SJ, Chung C, Han DC, Chang JK (2003) PDMS-based micro PCR chip with parylene coating. J Micromech Microeng 13(5):768–774 [Google Scholar]
- Tawfik DS, Griffiths AD (1998) Man-made cell-like compartments for molecular evolution. Nat Biotechnol 16(7):652–656 [DOI] [PubMed] [Google Scholar]
- Wang JH, Chien LJ, Hsieh TM, Luo CH, Chou WP, Chen PH, Chen PJ, Lee DS, Lee GB (2009) A miniaturized quantitative polymerase chain reaction system for DNA amplification and detection. Sens Actuator B Chem 141(1):329–337. doi: 10.1016/j.snb.2009.06.034 [DOI] [Google Scholar]
- Wendelboe AM, Van Rie A (2006) Diagnosis of pertussis: a historical review and recent developments. Expert Rev Mol Diagn 6(6):857–864. doi: 10.1586/14737159.6.6.857 [DOI] [PubMed] [Google Scholar]
- Yeung SW, Hsing IM (2006) Manipulation and extraction of genomic DNA from cell lysate by functionalized magnetic particles for lab on a chip applications. Biosens Bioelectron 21(7):989–997. doi: 10.1016/j.bios.2005.03.008 [DOI] [PubMed] [Google Scholar]
- Zhang C, Xing D (2010) Single-molecule DNA amplification and analysis using microfluidics. Chem Rev 110(8):4910–4947. doi: 10.1021/cr900081z [DOI] [PubMed] [Google Scholar]
- Zhang CS, Xu JL, Ma WL, Zheng WL (2006) PCR microfluidic devices for DNA amplification. Biotechnol Adv 24(3):243–284. doi: 10.1016/j.biotechadv.2005.10.002 [DOI] [PubMed] [Google Scholar]


