

Serotonin increased by stress mediates onset of dystonia through activation of 5HT-2A receptors in the deep cerebellar nuclei.
Abstract
Stress is a key risk factor for dystonia, a debilitating motor disorder characterized by cocontractions of muscles leading to abnormal body posture. While the serotonin (5HT) system is known to control emotional responses to stress, its role in dystonia remains unclear. Here, we reveal that 5HT neurons in the dorsal raphe nuclei (DRN) send projections to the fastigial deep cerebellar nuclei (fDCN) and that photostimulation of 5HT-fDCN induces dystonia in wild-type mice. Moreover, we report that photoinhibition of 5HT-fDCN reduces dystonia in a1Atot/tot mice, a genetic model of stress-induced dystonia, and administration of a 5HT-2A receptor inverse agonist (MDL100907; 0.1 to 1 mg/kg) or shRNA-mediated knockdown of the ht2ar gene in fDCN can notably reduce the onset of dystonia in a1Atot/tot mice. These results support the serotonin theory of dystonia and suggest strategies for alleviating symptoms in human patients by blocking 5HT-2A receptors.
INTRODUCTION
Dystonia is a movement disorder characterized by cocontraction of agonist and antagonist muscles, which results in abnormal body postures. Although various genetic and environmental factors are associated with the etiology of dystonia (1–3), patients commonly experience worse and more frequent motor symptoms under stressful or anxiety-inducing conditions (4–6). Thus, patients are advised to remain relaxed, often by controlling their environments and limiting social activity (7). Botulinum toxin therapy on target muscles and deep-brain stimulation of the basal ganglia have been used to prevent the typically unpredictable attacks of dystonia (8–11), but we currently lack an effective medication for this condition.
Indirect evidence has suggested that serotonin [5-hydroxytryptamine (5HT)] is involved in the pathophysiology of dystonia: The dorsal raphe nuclei (DRN), where 5HT neurons reside, show increased activity in patients with dystonia (12). Long-term administration of 5HT reuptake inhibitors (SSRIs) for depression can increase muscle tension and lead to dystonia as a side effect (13). DRN neurons send outputs to the basal ganglia and the deep cerebellar nuclei (DCN) (14), the activities of which increase in dystonia (15). Considering these lines of indirect evidence and the well-known role of 5HT in emotional responses to stress (16–20), we speculated that the 5HT system can be a link between stress and dystonia.
Here, we hypothesized that 5HT inputs to the DCN may underlie a circuit-based mechanism for the stress-dependent onset of dystonia. To test this hypothesis, we used “tottering” mice harboring a point mutation in a P/Q type calcium channel gene (a1Atot/tot) (21–23). These mutant mice develop whole-body dystonia under stressful conditions, such as when they are introduced to an unfamiliar environment (21, 22). Although inhibitory neurotransmission has been shown to occur at the synapses between cerebellar Purkinje cells and DCN neurons (24), the mechanism that triggers motor symptoms in response to stress remains unknown. By modulating 5HT-DCN inputs using optogenetics in wild-type (a1A+/+) and a1Atot/tot mice, we herein sought to validate the role of 5HT inputs in mediating the stress-induced onset of dystonia.
RESULTS
5HT inputs to the DCN are involved in the generation of dystonia-like symptoms
To examine the structure of 5HT inputs to each of the relevant nuclei, we virally transduced channelrhodopsin2 (ChR2; AAV2/1-EF1a-DIO-ChR2-mCherry) driven by ePet1-cre into the DRN (Fig. 1A) to label 5HT+ DRN neurons (fig. S3A). The three nuclei of the DCN are the fastigial nucleus (fDCN), the interposed nucleus (iDCN), and the dentate nucleus (dDCN); among them, we found that axons of 5HT+ DRN neurons are prominently abundant in the fDCN, compared to the iDCN or dDCN [F(2, 9) = 7.136, *P = 0.014, n = 4, one-way analysis of variance (ANOVA); fDCN versus iDCN, t = 3.166, *P = 0.023; fDCN versus dDCN, t = 3.368, *P = 0.025; iDCN versus dDCN, t = 0.202, P = 0.845] (Fig. 1B). To confirm the connection between the DRN and the fDCN, we injected the retrograde tracer, fluorescence-conjugated cholera toxin subunit B (CTB), into the fDCN and observed CTB-positive signals in the DRN (fig. S1). Our results collectively suggest that 5HT+ DRN neurons send axonal outputs predominantly to the fDCN among the three nuclei of the DCN.
Fig. 1. 5HT-fDCN circuits are involved in stress-induced dystonia.
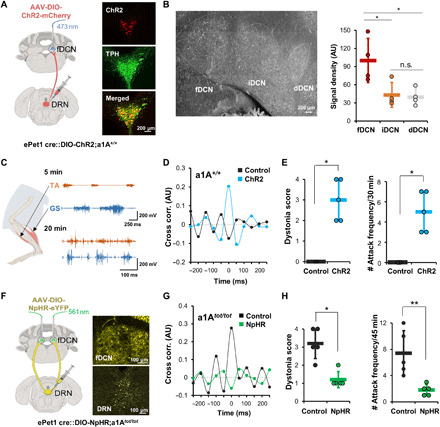
(A) Optogenetic stimulation of 5HT+ DRN-fDCN circuits in ePet1-cre mice. A confocal image, double-labeled for ChR2 virus (mCherry, red) and tryptophan hydroxylase (TPH) (green). All merged cells (yellow) mean TPH-positive (5HT+). Inset magnification, ×20. (B) Axons from DRN 5HT+ neurons are found more in the fDCN than in the iDCN or dDCN. Inset magnification, ×20. The signal density was measured as mean fluorescent pixel values in the selected area using ImageJ (44). The signal density (normalized to fDCN; 100%) was calculated for brain sections [anterioposterior (AP), −6.24 to −6.36 mm], including the three nuclei. AU, arbitrary units. (C) EMG traces during photostimulation from hind-limb muscles of wild-type mice. The traces represent results obtained for a 5-min (top) and 20-min (bottom) exposure to an open field. The traces at the bottom represent the dystonic state induced by photostimulations. (D) The cross-correlation of hind-limb muscles is increased in the photostimulation group (blue) but not in the unstimulated group (black). (E) The dystonia score and attack frequency are increased by photostimulations. Dots represent the worst dystonic score a mouse scored during the entire test session. (F) Optogenetic inhibition of 5HT+ DRN-fDCN circuits by 561-nm light in a1Atot/tot mice. Inset magnification, ×20. (G) The eNpHR group exhibits reduced cross-correlation among hind-limb muscles. (H) The eNpHR group shows a lower dystonia score and attack frequency compared to the control. Dots represent the worst dystonic score a mouse scored during the entire test session. Data are presented as means ± SD (error bars).
To optically stimulate the ChR2-expressing 5HT+ inputs, we implanted an optic fiber with the tip located in the fDCN (5HT-fDCNChR2; fig. S3B). We found that under photostimulation (473 nm; frequency, 20 Hz; pulse width, 10 ms; intensity, 5 mW), 5HT-fDCNChR2 mice gradually developed dystonia-like postures in an open-field box (movie S1). 5HT-fDCNChR2 mice showed an increase in cocontractions between agonist [tibialis anterior (TA)] and antagonist [gastrocnemius (GS)] muscles (Fig. 1C), an increase in the cross-correlation between the two (n = 4; Fig. 1D), an increase in dystonia score (15) (n = 5, *P = 0.01208, U = 0, Mann-Whitney U test; Fig. 1E, left, and fig. S2B), and an increase in dystonia attacks (Fig. 1E, right) compared to control group, in which a control vector (AAV2/5-EF1a-DIO-eYFP) was transfected into the DRN of ePet1-cre mice (5HT-fDCNeYFP; n = 5, *P = 0.01208, U = 0, Mann-Whitney U test). In electromyography (EMG) analyses, we found that photostimulation of 5HT-fDCN inputs increased bursting events (fig. S4A), spike frequency measured by the number of spikes beyond the EMG threshold during 5 s (fig. S4B) (25), power density (fig. S4D), and coherence (fig. S4C), indicating that there was an overall increase in muscular contractions. Power spectral density is the measure of the average power in a signal per unit of frequency as a function of frequency. When applied postmortem to mice, immunohistochemistry using a c-Fos antibody showed that photostimulation of 5HT-fDCN inputs did activate fDCN neurons (fig. S3B). These results suggest that 5HT+ inputs to the fDCN can produce dystonia symptoms and that this probably occurs via an increased excitability of DCN neurons.
Next, we asked whether the 5HT+ DRN inputs to the DCN modulate motor symptoms in tottering mice (a1Atot/tot), which represent a genetic model for stress-induced dystonia (21–23). When exposed to the novelty-induced stress of an open-field box, a1Atot/tot mice gradually developed dystonia (movie S2 and fig. S2A): They initially showed an increase in locomotion with jerky limb movements and eventually developed dystonia-like postures; this began with the hind limbs, expanded to the whole body over 10 min, and reached peak severity at around 35 min (fig. S5A) with increased cocontraction between TA and GS muscles (fig. S5B). Postmortem histological analyses revealed that a1Atot/tot mice that experienced dystonia had increased c-Fos activity in the DRN and fDCN, supporting the potential role of the 5HT system and fDCN neurons in their motor abnormalities (fig. S6).
To demonstrate the role of 5HT-fDCN inputs in tottering mice, we injected viruses harboring the light-dependent chloride channel gene, eNpHR3.0 (rAAV2/9-EF1a-DIO-eNpHR3.0-eYFP), or a control vector (AAV2/5-EF1a-DIO-eYFP) driven by ePet1-cre into the DRN of a1Atot/tot mice (ePet1::DIO-NpHR3.0;a1Atot/tot or ePet1::DIO-YFP;a1Atot/tot; Fig. 1F). We found that bilateral photoinhibition of 5HT-fDCN inputs using green light (561 nm, continuous; intensity, 2 mW) significantly reduced dystonia in 5HT-fDCNNpHR3.0;a1Atot/tot mice under novelty stress. The mice showed reduced dystonia symptoms in terms of cocontraction of muscles (n = 4; Fig. 1G), dystonia scores (n = 5, *P = 0.0164, U = 0.5, Mann-Whitney U test; Fig. 1H, left), and attack frequency (Fig. 1H, right, and movie S2) compared to control a1Atot/tot mice injected with a control vector (AAV2/5-EF1a-DIO-eYFP) driven by ePet1-cre into the DRN (n = 5, **P = 0.00760, t8 = 3.542, unpaired t test). EMG analyses revealed that photoinhibition of 5HT-fDCN inputs led to significant reductions in the number of spikes and the duration of bursting (fig. S5, C and D), accompanied by reductions in EMG power (fig. S5F) and coherence (fig. S5E). These results suggest that 5HT-fDCN inputs can induce dystonia symptoms in a1Atot/tot mice.
5HT+ inputs increase the excitability of fDCN neurons
To more precisely address the impact of 5HT-fDCN inputs on the excitability of fDCN neurons, we performed single-unit recordings in ePet1 cre::DIO-ChR2;a1A+/+ mice using tetrodes under a head-fixed condition, as previously described (fig. S3C) (26). We measured a significant change in firing rate in 81.8% of fDCN neurons (22 cells from five mice) upon 5HT-fDCN photostimulation (increased, 11; decreased, 7; no response, 4) (Fig. 2A and fig. S3C). We found that 50% of fDCN neurons showed an increased firing rate with kinetics similar to the onset of dystonia (Fig. 2, A and B). The rate was 19 Hz before photostimulation; it increased starting at 10 min of photostimulation and reached a peak average firing rate of 46 Hz after 30 min of photostimulation [F(2, 20) = 8.508, **P = 0.002, 11 cells from 5 mice, one-way repeated-measures (RM) ANOVA; OFF and 30 min, t = 4.096, **P = 0.002; 10 and 30 min, t = 2.47, *P = 0.045] (Fig. 2C). 5HT-fDCNChR2 mice showed more severe symptoms at 30 min compared to 10 min and also exhibited higher firing rates of fDCN neurons at 30 min compared to 10 min (Fig. 2C). This suggests that there may be a positive correlation between the firing rate of fDCN neurons and the severity of motor symptoms.
Fig. 2. Photostimulation of 5HT-fDCN circuit increases neuronal excitability in the fDCN.
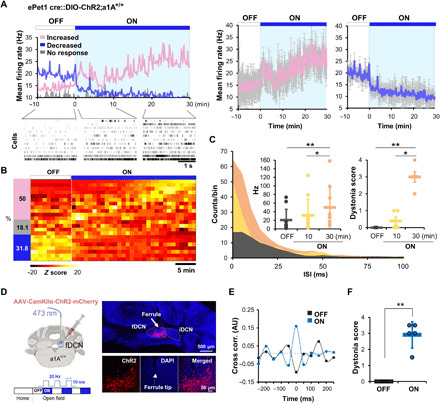
(A) (Left) Single-unit recording of fDCN neurons (22 cells from five mice) showing increased, decreased, or unchanged firing rates under photostimulation of 5HT-fDCN inputs. Rasters show firing patterns in the absence and presence of photostimulation. (Right) The increased group represents 11 cells from five mice, and the decreased group represents 7 cells from three mice (mean firing rate with SD). (B) Heatmap for the three types of neuronal responses. The z score was calculated by the equation: (x-mean)/SD. (C) Photostimulations (30 min, orange; 10 min, yellow) are associated with increased firing events with a shortened interspike interval (ISI). The mean firing rate of longer photostimulations (30 min, orange) is significantly higher than that under no (black) or 10-min (yellow) photostimulation; motor symptoms are also more severe at 30 min than at 10 min. Dots represent the worst dystonic score a mouse scored during the entire test session. (D) Schematic and confocal images showing mice that received intracerebellar injections and photostimulations. ChR2+ neurons (red, mCherry); all neurons (blue, DAPI). Inset magnification, ×20. (E) EMG cross-correlation between TA and GS muscles in the presence (ON) or absence (OFF) of photostimulation. Cross-correlations were performed on epochs wherein mice showed a dystonia score of 3 or 4. (F) Increased dystonia scores under photostimulation. Dots represent the worst dystonic score a mouse scored during the entire test session. Data are presented as means ± SD (error bars).
To determine whether this increased firing rate contributes to dystonia onset, we directly stimulated fDCN neurons with blue light (473 nm; frequency, 20 Hz; pulse width, 10 ms; intensity, 2 mW) using a CamKIIα-driven ChR2 gene in wild-type mice (CamKIIα-fDCN-ChR2;a1A+/+; Fig. 2D and fig. S7A). We found that photostimulation promptly induced dystonia in fDCNChR2 mice (fig. S7B; see onset latency around 55 ms), as assessed by the cocontraction of agonist and antagonist muscles (fig. S7B), as well as increased cross-correlation (n = 5; Fig. 2E) and dystonia scores (Fig. 2F and fig. S2C) compared to the light OFF state (n = 5, **P = 0.00139, t4 = −7.893, paired t test). These results suggest that the 5HT-dependent excitation of fDCN neurons can induce dystonia.
Increased excitability and Ca2+ signaling in fDCN neurons of a1Atot/tot mice
To physiologically verify the increased excitability of the fDCN in a1Atot/tot mice, we used time-correlated single-photon counting fiber optics (27, 28). To express the Ca2+ sensor GCaMP6m in the fDCN, we injected AAV-CMV-CRE and AAV-DIO-GCaMP6m vectors in the fDCN and then measured emitted fluorescence activity using a fiber optic photon detector (Fig. 3A), as previously described (29). We found that fDCN neurons of a1Atot/tot mice showed an increase in Ca2+ activity after just 10 min of exposure to an open-field box, reaching a peak after ~30 min of exposure [F(2, 6) = 11.643, **P = 0.009, n = 4, one-way RM ANOVA; 10 and 30 min, t = 4.792, **P = 0.009; 10 and 20 min, t = 2.887, P = 0.055; 20 and 30 min, t = 1.905, P = 0.105; Fig. 3B and movie S3]. In an event-based analysis, we found that the increase of Ca2+ activity in fDCN neurons was associated with bouts of dystonia in vehicle (0.9% saline)–treated control mice (Fig. 3C), rising to 9.5 times the baseline level during dystonia episodes [F(2, 6) = 8.508, **P = 0.006, n = 4, one-way RM ANOVA; resting and dystonia, t = 4.713, *P = 0.01; walking and dystonia, t = 4.255, *P = 0.011; Fig. 3D]. These results support the hypothesis that the excitatory outputs of fDCN neurons are positively correlated with dystonia in a1Atot/tot mice (Fig. 2).
Fig. 3. Optical detection of Ca2+-induced neuronal excitability in the fDCN.
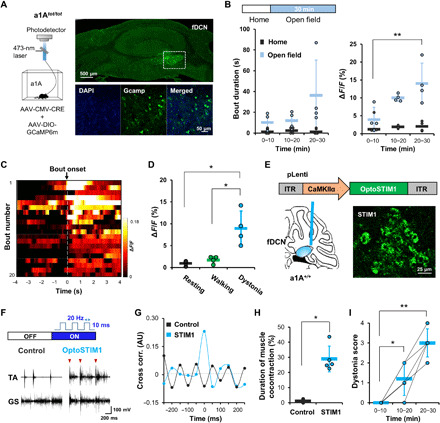
(A) Schematic for recording the neural activity of fDCN neurons using GCaMP6m. Images show cre-dependent expression of GCaMP6m in the fDCN. Inset magnification, ×20 and ×40. (B) Time-dependent changes of bout duration during dystonia attacks and ΔF/F in home cage or open field. (C) Heatmap of fluorescence changes in vehicle-treated (control; injected with 0.9% saline) mice. The color indicates the change in fluorescence (ΔF/Fmean). The “bout” is a dystonic attack. The heatmap is aligned to bout onset, which refers to the point of dystonia attack. (D) fDCN neurons show increased activities during dystonia, compared with resting or walking. ΔF/F represents changes in fluorescence from the median over the entire time series (0 to 30 min in the open field, every 1 s). (E) Schematic showing that mice received pLenti-CamKIIα-OptoSTIM1-eGFP (3.6 × 10¹¹ genomic copies/ml, 0.25 μl) in the right fDCN by intracerebellar injection. A ferrule was implanted just above the injection site. Representative image showing expression of OptoSTIM1 in the fDCN. Inset magnification, ×20. (F) EMG traces in the control and OptoSTIM1 groups. The control consisted of wild-type (a1A+/+) mice were injected with pLenti-CamKIIα-eGFP virus. Arrowheads indicate the onset point for simultaneous cocontraction of TA and GS muscles. (G) The OptoSTIM1 group shows higher cross-correlation upon stimulation than the control group. (H) The OptoSTIM1 group shows an increased time to muscle cocontraction compared to the control group. (I) Photostimulations lasting longer than 10 min increase the dystonia score in the OptoSTIM1 group. Dots represent the worst dystonic score a mouse scored during the entire test session. Data are presented as means ± SD (error bars).
To explore the role of increased intracellular Ca2+ in the onset of dystonia, we decided to use OptoSTIM1, a designer protein that increases intracellular Ca2+ regardless of membrane potential via the light-dependent oligomerization of Ca2+ release-activated Ca2+ channels (30), in wild-type mice (a1A+/+). We transfected lentiviruses harboring pLenti-CamKIIα-OptoSTIM1-eGFP into the fDCN and implanted a ferrule just above the injection site (Fig. 3E). Under light illumination in an open-field box (473 nm; frequency, 20 Hz; pulse width, 10 ms; intensity, 5 mW), we found that CamKIIα-fDCN-OptoSTIM1;a1A+/+ mice showed a greater tendency toward dystonia than CamKIIα-fDCN-eGFP;a1A+/+ mice (Fig. 3F), as measured by an increase in cocontractions (n = 5, *P = 0.01208, U = 0, Mann-Whitney U test; Fig. 3H) and cross-correlation (n = 5; Fig. 3G) between the TA and GS muscles compared to those of control mice transfected with lentiviruses harboring pLenti-CamKIIα-eGFP. We also found that the severity of their dystonia symptoms was proportional to the duration of photostimulation (n = 5; Fig. 3I). These results suggest that the increase in intracellular Ca2+, which likely occurs through activation of 5HT receptors (31) and voltage-gated Ca2+ channels (Fig. 2), is critical to increasing the excitability of the fDCN neurons that trigger stress-induced dystonia.
Blockage and knockdown of 5HT-2A receptors reduces stress-induced dystonia in a1Atot/tot mice
To determine which 5HT receptor is involved in stress-induced dystonia, we administered intraperitoneal injections of 5HT receptor antagonists to a1Atot/tot mice 30 min before moving them into an open-field box. Because DCN neurons express 5HT-1A, 5HT-2A, and 5HT-3 receptors (32), we administered antagonists to each of these serotonin receptors individually. We found that the 5HT-2A receptor inverse agonist MDL100907 (33, 34) efficiently reduced dystonia in a1Atot/tot mice (1 mg/kg; n = 5 vehicle, n = 5 MDL100907, n = 4 WAY100135, n = 4 ondansetron; n.s. indicates nonsignificant), as measured by reduced cocontraction of agonist/antagonist muscle pairs [F(3, 14) = 13.145, **P < 0.001, one-way ANOVA; vehicle versus MDL100907, t = 5.088, **P < 0.001; Fig. 4, A and B, left], a reduced dystonia score [F(3, 14) = 19.091, **P < 0.001, one-way ANOVA; vehicle versus MDL100907, t = 6.054, **P < 0.001; Fig. 4B, middle], fewer dystonia attacks [F(3, 14) = 14.968, **P < 0.001, one-way ANOVA; vehicle versus MDL100907, t = 4.971, **P < 0.001; Fig. 4B, right], and a desynchronization of the TA and GS muscles (fig. S8A). The therapeutic effect of MDL100907 was also at 0.1 mg/kg (fig. S8B). In contrast, neither WAY100135 nor ondansetron, which are antagonists for 5HT-1A and 5HT-3, respectively, affected dystonia in a1Atot/tot mice [P = 0.851 and 0.853, Fig. 4B, left; P = 0.98 and 0.925, Fig. 4B, middle; P = 0.889 and 0.935, Fig. 4B, right].
Fig. 4. 5HT-2A receptor inhibition reduces dystonia and neural activity in a1Atot/tot mice.
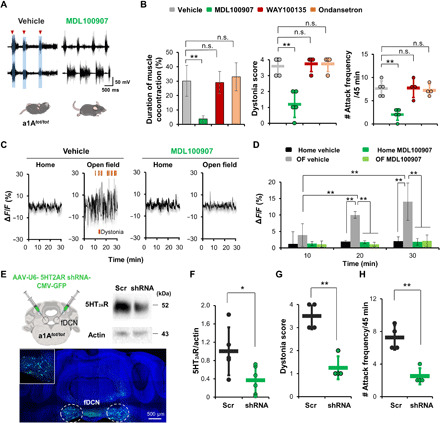
(A) Representative traces obtained after administration of vehicle or the 5HT-2A receptor antagonist MDL100907. Mice were intraperitoneally injected with drugs at 30 min before testing. (B) MDL100907 reduces the duration of muscle cocontraction and dystonia compared to the saline control. Antagonists for 5HT-1A (WAY100135) or 5HT-3 receptor (ondansetron) had no effect. Dots represent the worst dystonic score a mouse scored during the entire test session. (C and D) Vehicle-treated mice show increased neural activity when moved to an open-field box (OF) from their home cage. MDL100907 significantly reduces this novelty-induced increase of neural activity. (E) Schematic showing bilateral knockdown of 5HT-2A receptor genes using shRNA. Representative Western blot of fDCN lysate of a mouse injected with AAV-5HT-2ARshRNA-GFP. Images of histological sections from a mouse injected with AAV-5HT-2ARshRNA-GFP to the fDCN. Inset magnification, ×10 and ×20. (F) Knockdown of 5HT-2A gene by AAV-5HT-2ARshRNA-GFP decreases the amount of 5HT-2A protein compared to control (AAV-scramble nucleotides-eGFP). (G and H) Dystonia score and attack frequency are reduced by knockdown of 5HT-2A receptors. Dots represent the worst dystonic score a mouse scored during the entire test session. Data are presented as means ± SD (error bars).
EMG analyses showed that MDL100907 treatment led to a significant reduction in bursting of muscular action potentials [for TA muscles, left, F(3, 14) = 6.749, **P = 0.005, one-way ANOVA; vehicle versus MDL100907, t = 4.128, **P = 0.006; for GS muscles, F(3, 14) = 7.469, **P = 0.003, one-way ANOVA; vehicle versus MDL100907, t = 4.557, **P = 0.003; fig. S9A] and rate of EMG spiking [for TA muscles, F(3, 14) = 42.732, **P < 0.001, one-way ANOVA; vehicle versus MDL100907, t = 9.5023, **P < 0.001; for GS muscles, F(3, 14) = 32.263, **P < 0.001, one-way ANOVA; vehicle versus MDL100907, t = 8.795, **P < 0.001; fig. S9B] and that this was accompanied by reductions in EMG power density (fig. S9D) and coherence (fig. S9C). To address the action mechanism of MDL100907 in this context, we performed Ca2+ imaging of fDCN neurons using GCaMP6m in a1Atot/tot mice (Fig. 4, C and D). These results suggest that 5HT-2A receptors play key roles in stress-induced muscular tension and dystonia.
However, 5HT antagonists are known to exert therapeutic effects through other areas. For example, studies have shown that 5HT pathways pass from the medullary raphe nuclei to motor circuits in the spinal cord and may be activated by stress (35). To test the role of 5HT-2A receptors in the fDCN, we examined the effect of 5HT-2A receptor antagonism on the excitability of fDCN neurons using Ca2+ imaging. We found that MDL100907 (1 mg/kg) efficiently prevented the increase in excitability of fDCN neurons that is normally observed upon exposure to an open-field box [for group, F(3, 24) = 22.445, **P < 0.001; for time, F(2, 24) = 5.118, **P = 0.001; for group × time, F(6, 24) = 5.118, **P = 0.002, n = 4, two-way RM ANOVA; Fig. 4, C and D]. To knock down 5HT-2A receptors in the fDCN, we injected viruses harboring anti–5HT-2A short hairpin RNA (shRNA; AAV-U6-5HT-2ARshRNA-CMV-GFP) (Fig. 4E). In postmortem histology experiments, we observed a knockdown efficiency of ~63.5% (n = 5 scramble, n = 6 shRNA, *P = 0.0324, t9 = 2.526, unpaired t test; Fig. 4F). We further found that 5HT-2A receptor knockdown in the fDCN reduces dystonia scores (n = 4, **P = 0.00106, t6 = 5.892, unpaired t test; Fig. 4G) and attack frequencies (n = 4, **P = 0.00188, t6 = 5.270, unpaired t test; Fig. 4H and movie S5). The control mice consisted of a1Atot/tot mice injected with AAV-U6-scrambledshRNA-CMV-GFP virus. Together, these results indicate that 5HT-2A receptors are critical for the pathophysiology of dystonia in a1Atot/tot mice.
DISCUSSION
Patients who suffer from bouts of dystonia with unpredictable onset or whose motor symptoms grow worse under stressful conditions are typically prescribed some form of relaxation therapy (36). Our results reveal a circuit-based mechanism that explains the relationship between stress and dystonia: Stress enhances the excitability of fDCN neurons via the activation of 5HT-2A receptors, leading to increased intracellular Ca2+ (fig. S10A). We further found that inhibition of the 5HT-2A receptor via drugs or shRNAs significantly reduced the onset of symptoms in a genetic model of stress-induced dystonia (Fig. 4), signaling hope for patients who suffer from dystonia.
One alternative explanation for the therapeutic effect of 5HT-2A receptor blockade on stress-induced dystonia (Fig. 4) is that such treatment instead blocks the negative emotions associated with stress. However, it is 5HT agonism, not antagonism, that has been associated with a relief from emotional stress (37). Treatment with SSRIs (antidepressants that facilitate 5HT signaling) can instead increase the risk of muscular tension abnormalities like dystonia (13, 38). In addition, 5HT-2A receptors are highly expressed in motor-related areas such as the DCN and striatum (39). Thus, the 5HT system seems to control emotion and muscular tension via different 5HT receptors expressed in different brain areas.
It is worth noting that the fDCN was not previously a primary focus as a neural substrate for dystonia. Several studies reported that, of the three DCN nuclei, the dDCN plays a critical role in dystonia (15, 40, 41). Knockdown of torsin A, a gene associated with dystonia, in the dDCN was found to induce dystonia (40). The dDCN induces dystonia through a specific neural pathway wherein the excitatory outputs of dDCN neurons activate neurons in the centromedial or centrolateral thalamus (15). Our present study reveals that DRN-5HT neurons send inputs to the fDCN rather than the dDCN (Fig. 1), and the excitation of these fDCN neurons facilitates the onset of dystonia under stressful conditions. fDCN neurons, like dDCN neurons, send outputs to the centromedial or centrolateral thalamus (fig. S10B); the two DCN outputs converge in the thalamus such that coexcitation of dDCN and fDCN neurons may reduce the threshold for dystonia onset. Stress, however, seems to trigger dystonia through the 5HT-fDCN neuronal pathway.
Our study also provides clues regarding the physiological role of the 5HT-cerebellar circuit mechanism. As an adaptive response to potential danger, emotion-dependent muscle tension may facilitate more powerful motor reactions (42). Still, such tension has drawbacks in that it inevitably limits fine motor control and increases the risk of mistakes in sports and daily life (43). It is plausible that the 5HT-fDCN circuit smoothly increases overall muscle tension under physiological conditions, while leading to severe motor abnormalities and muscular aches under pathological conditions. Further studies on the postsynaptic targets of the fDCN are needed to clarify the physiological role of the 5HT-fDCN circuits in regulating muscular tension and coordination.
MATERIALS AND METHODS
Animals
All behavioral experiments were performed on 9- to 11-week-old male ePet1-cre, C57BL/6, and a1Atot/tot mice from The Jackson Laboratory (Bar Harbor, ME, USA). We used age- and gender-matched control mice. To make ePet1 CRE mice with the a1Atot/tot genetic background, we crossed male ePet1 cre/−;a1A+/tot mice with female a1A+/tot mice. Mice had free access to food and water and were kept on a 12-hour light-dark cycle at 22°C. All behavioral assays were conducted during the light phase of the light-dark cycle at the same time of day. Institutional Animal Care and Use Committee guidelines were followed with animal subjects. All of the care and handling of mice was performed according to the directives of the Animal Care and Use Committee of Korea Advanced Institute of Science and Technology (KAIST; Daejeon, Korea).
Virus injection and fiber optic ferrule implantation
Mice were anesthetized with 2,2,2-tribromoethanol (20 μl/g) by intraperitoneal injection and placed on a stereotaxic frame (David Kopf Instruments, USA). For optogenetic manipulation of DRN neurons, the DRN [anterior–posterior (AP), −4.6 mm; medial–lateral (ML), −0.65 mm; dorsal-ventral (DV), 2.8 mm, at a 16° angle lateral to midline] was injected with 7.8 × 10¹² genomic copies/ml for AAV2/1-EF1a-DIO-ChR2-mCherry (University of Pennsylvania, USA), 2.3 × 10¹² genomic copies/ml for AAV2/9-EF1a-DIO-eNpHR3.0-eYFP (University of Pennsylvania, USA), and 5.0 × 10¹² genomic copies/ml for AAV2/5-EF1a-DIO-eYFP (University of North Carolina Vector Core, USA) at a rate of 0.075 μl/min using a 10-μl Hamilton microsyringe (701N; Sigma-Aldrich, USA). Following viral injection, the needle was held at the injection site for 10 min. A total of 0.5 μl of virus was injected. The fastigial nucleus (AP, −6.24 to −6.64 mm; ML, −0.68 mm; DV, 2.65 mm) was injected with 1.5 × 10¹² genomic copies/ml for AAV2/9-CAG-FLEX-GCaMP6m (0.125 μl), 2.8 × 10¹² genomic copies/ml for AAV2/9-CMV-Cre (0.125 μl), and 1.0 × 10¹² genomic copies/ml for AAV2/9-CamKIIα-hChR2(H134R)-mCherry (all from the University of Pennsylvania, USA). In addition, 3.6 × 10¹¹ genomic copies/ml of pLenti-CamKIIα-OptoSTIM1-eGFP (KAIST, Korea) were injected for a total injection of 0.25 μl of virus. Fiber optic cannulas containing optic fiber (200 μm diameter; Doric Lenses, Canada) were implanted bilaterally into mice injected with eNpHR3.0. All mice injected with ChR2 received a unilateral implant of a fiber optic cannula (200 μm diameter; Doric Lenses). An optic fiber (MFC_200/245_0.53_3.8mm_MF2.5_FLT; Doric Lenses) was implanted into the fastigial nucleus. The coordinates of the optic fiber were deliberately set so the area of illumination would cover the fastigial nucleus (AP, −6.24 to −6.64 mm; ML, −0.68 mm; DV, 2.55 mm). The fiber was secured to the skull with dental adhesive (Sun Medical, Japan). After 3 to 4 weeks, a 473-nm laser (Shanghai Laser, China) was used for photostimulation of the DRN–fastigial nucleus (30 min). Before every behavioral test that included optical stimulation, the light intensity was measured using an optical power meter (Thorlabs, Germany). Mice were used only once for photostimulation experiments. eNpHR3.0 mice were stimulated (AP, −6.24 to −6.64 mm; ML, ±1.5 mm; DV, 2.6 mm, at a 16° angle lateral to midline) continuously at 561 nm (45 min) using a diode-pumped, solid-state laser (CrystaLaser, USA). Adeno-associated viral (AAV) vectors expressing shRNAs targeting the 5HT-2A receptor were produced and concentrated by Vigene Biosciences (SH885137; Rockville, MD, USA). A similar process was used to obtain shRNA constructs targeting 5HT (serotonin) receptor 2A (HTR2A) transcript variant 1 and a scrambled control. The 5HT-2AR shRNA sequence was 5′-AAAGCTGCAGAATGCCACCAACT-3′. The fastigial nucleus neurons (AP, −6.24 mm; ML, −0.68 mm; DV, ±2.65 mm) were infected with AAV virus (Vigene Bioscience, USA) harboring either shRNA-5HT-2AR (AAV-U6-5HT-2ARshRNA-CMV-GFP) or control shRNA (AAV-U6-scrambledshRNA-CMV-GFP). Titers of ~2 × 10¹² transduction units/ml were used, and a total of 0.25 μl of virus was injected.
Statistical analysis
No statistical analysis was performed to predetermine sample sizes; instead, we used sample sizes similar to those found in many previous studies that used similar neurochemical, electrophysiological, optogenetic, and behavioral techniques. All data analyses were performed using SigmaPlot (12.0; Systat Software, USA). For parameters that followed a normal distribution (Shapiro-Wilk test, P > 0.05), differences between two groups were analyzed with the Student’s t test. The Mann-Whitney U test was used for data that did not follow a normal distribution. Comparisons of three or more groups were performed with ANOVA. The Holm-Sidak method was used to correct for multiple comparisons. All other statistical tests were Student’s two-sided t tests. P values <0.05 were considered statistically significant (Tables 1 and 2). Data are expressed as means ± SD (Tables 3 to 5).
Table 1. Results (P values) of statistical tests.
| Figures | Statistical analysis | Mouse no. |
| Fig. 1B |
F(2, 9) = 7.136, *P = 0.014, one-way ANOVA; fDCN vs. iDCN, t = 3.166, *P = 0.023; fDCN vs. dDCN, t = 3.368, *P = 0.025; iDCN vs. dDCN, t = 0.202, P = 0.845; post hoc analysis with the Holm-Sidak method |
n = 4 |
| Fig. 1E | *P = 0.01208, U = 0, Mann-Whitney U test | n = 5 |
| Fig. 1H | (Left) *P = 0.0164, U = 0.5, Mann-Whitney U test; (right) **P = 0.00760, t8 = 3.542, unpaired t test |
n = 5 |
| Fig. 2C, left |
F(2, 20) = 8.508, **P = 0.002, one-way RM ANOVA; OFF and 30 min, t = 4.096, **P = 0.002; 10 and 30 min, t = 2.47, *P = 0.045; OFF and 10 min, t = 1.626, P = 0.12; post hoc analysis with the Holm-Sidak method |
n = 11 |
| Fig. 2C, right |
F(2, 8) = 72.364, **P < 0.001, one-way RM ANOVA; OFF and 30 min, t = 11.078, **P < 0.001; 10 and 30 min, t = 9.601, **P < 0.001; OFF and 10 min, t = 1.477, P = 0.178; post hoc analysis with the Holm-Sidak method |
n = 5 |
| Fig. 2F | **P = 0.00139, t4 = −7.893, paired t test | n = 5 |
| Fig. 3B |
F(2, 6) = 11.643, **P = 0.009, n = 4, one-way RM ANOVA; 10 and 30 min, t = 4.792, **P = 0.009; 10 and 20 min, t = 2.887, P = 0.055; 20 and 30 min, t = 1.905, P = 0.105; post hoc analysis with the Holm-Sidak method |
n = 4 |
| Fig. 3D |
F(2, 6) = 8.508, **P = 0.006, one-way RM ANOVA; resting and dystonia, t = 4.713, *P = 0.01; walking and dystonia, t = 4.255, *P = 0.011; resting and walking, t = 0.457, P = 0.664; post hoc analysis with the Holm-Sidak method |
n = 4 |
| Fig. 3H | *P = 0.01208, U = 0, Mann-Whitney U test | n = 5 |
| Fig. 3I |
F(2, 8) = 36, **P < 0.001, n = 4, one-way RM ANOVA; 0–10 and 10–20 min, t = 3.372, *P = 0.01; 0–10 and 20–30 min, t = 8.429, **P < 0.001; 10–20 and 20–30 min, t = 5.058, **P = 0.002; post hoc analysis with the Holm-Sidak method |
n = 5 |
| Fig. 4B, left |
F(3, 14) = 13.145, **P < 0.001, one-way ANOVA; vehicle vs. MDL100907, t = 5.088, **P < 0.001; vehicle vs. WAY100135, t = 0.192, P = 0.851; vehicle vs. ondansetron, t = 0.513, P = 0.853; post hoc analysis with the Holm-Sidak method |
n = 5 vehicle; n = 5 MDL100907; n = 4 WAY100135; n = 4 ondansetron |
| Fig. 4B, middle |
F(3, 14) = 19.091, **P < 0.001, one-way ANOVA; vehicle vs. MDL100907, t = 6.054, **P < 0.001; vehicle vs. WAY100135, t = 0.357, P = 0.98; vehicle vs. ondansetron, t = 0.357, P = 0.925; post hoc analysis with the Holm-Sidak method |
n = 5 vehicle; n = 5 MDL100907; n = 4 WAY100135; n = 4 ondansetron |
| Fig. 4B, right |
F(3, 14) = 14.968, **P < 0.001, one-way ANOVA; vehicle vs. MDL100907, t = 4.971, **P < 0.001; vehicle vs. WAY100135, t = 0.142, P = 0.889; vehicle vs. ondansetron, t = 0.331, P = 0.935; post hoc analysis with the Holm-Sidak method |
n = 5 vehicle; n = 5 MDL100907; n = 4 WAY100135; n = 4 ondansetron |
| Fig. 4D | For group, F(3, 24) = 22.445, **P < 0.001; for time, F(2, 24) = 5.118, **P = 0.001; for group × time, F(6, 24) = 5.118, **P = 0.002, two-way RM ANOVA; within OF vehicle, 10 and 20 min, t = 4.135, **P < 0.001; 10 and 30 min, t = 6.864, **P < 0.001; 20 and 30 min, t = 2.729, *P = 0.012; within 20 min, home and OF, t = 4.873, **P < 0.001; OF and home MDL, t = 4.957, **P < 0.001; OF and MDL, t = 5.336, **P < 0.001; within 30 min, home and OF, t = 7.128, **P < 0.001; OF and home MDL, t = 7.314, **P < 0.001; OF and MDL, t = 7.128, **P < 0.001; post hoc analysis with the Holm-Sidak method |
n = 4 |
| Fig. 4F | *P = 0.0324, t9 = 2.526, unpaired t test | Scramble n = 5; shRNA n = 6 |
| Fig. 4G | **P = 0.00106, t6 = 5.892, unpaired t test | Scramble n = 4; shRNA n = 4 |
| Fig. 4H | **P = 0.00188, t6 = 5.270, unpaired t test | Scramble n = 4; shRNA n = 4 |
| Fig. S4A, left | **P = 0.00819, t6 = −3.878, unpaired t test | n = 4 |
| Fig. S4A, right | **P = 0.000154, t6 = −8.411, unpaired t test | n = 4 |
| Fig. S4B, left | *P = 0.0435, t6 = −2.549, unpaired t test | n = 4 |
| Fig. S4B, right | **P = 0.000463, t6 = −6.885, unpaired t test | n = 4 |
| Fig. S5C, left | *P = 0.0144, t6 = 3.404, unpaired t test | n = 4 |
| Fig. S5C, right | *P = 0.0174, t6 = 3.255, unpaired t test | n = 4 |
| Fig. S5D, left | **P = 0.0000928, t6 = 9.204, unpaired t test | n = 4 |
| Fig. S5D, right | **P = 0.000216, t6 = 7.911, unpaired t test | n = 4 |
| Fig. S6C | (DRD) P = 0.0873, t9 = −1.918, unpaired t test; (DRV) *P = 0.0325, t9 = −2.525, unpaired t test |
Control n = 5; a1Atot/tot n = 6 |
| Fig. S6C | (fDCN) **P = 0.00453, t4 = −5.752, unpaired t test | n = 3 |
| Fig. S8B, left |
F(4, 14) = 14.84, **P < 0.001, one-way ANOVA; vehicle and 0.02 mg of MDL100907, t = 2.882, P = 0.07; vehicle and 0.1 mg, t = 5.174, **P = 0.001; vehicle and 1 mg, t = 6.352, **P < 0.001; vehicle and 2 mg, t = 6.156, **P < 0.001; post hoc analysis with the Holm-Sidak method |
n = 5 vehicle; n = 3 0.02 mg of MDL100907; n = 3 0.1 of mg MDL100907; n = 5 1 mg of MDL100907; n = 3 2 mg MDL100907 |
| Fig. S8B, right |
F(4, 14) = 13.386, **P < 0.001, one-way ANOVA; vehicle and 0.02 mg of MDL100907, t = 2.649, P = 0.109; vehicle and 0.1 mg, t = 4.741, **P = 0.003; vehicle and 1 mg, t = 5.797, **P < 0.001; vehicle and 2 mg, t = 5.797, **P < 0.001; post hoc analysis with the Holm-Sidak method |
n = 5 vehicle; n = 3 0.02 mg of MDL100907; n = 3 0.1 mg of MDL100907; n = 5 1 mg of MDL100907; n = 3 2 mg of MDL100907 |
| Fig. S9A, left |
F(3, 14) = 6.749, **P = 0.005, one-way ANOVA; vehicle vs. MDL100907, t = 4.128, **P = 0.006; vehicle vs. WAY100135, t = 0.47, P = 0.654; vehicle vs. ondansetron t = 0.989, P = 0.712; post hoc analysis with the Holm-Sidak method |
n = 5 vehicle; n = 5 MDL100907; n = 4 WAY100135; n = 4 ondansetron |
| Fig. S9A, right |
F(3, 14) = 7.469, **P = 0.003, one-way ANOVA; vehicle vs. MDL100907, t = 4.557, **P = 0.003; vehicle vs. WAY100135, t = 1.183, P = 0.447; vehicle vs. ondansetron, t = 1.312, P = 0.508; post hoc analysis with the Holm-Sidak method |
n = 5 vehicle; n = 5 MDL100907; n = 4 WAY100135; n = 4 ondansetron |
| Fig. S9B, left |
F(3, 14) = 42.732, **P < 0.001, one-way ANOVA; vehicle vs. MDL100907, t = 9.5023, **P < 0.001; vehicle vs. WAY100135, t = 0.251, P = 0.805; vehicle vs. ondansetron, t = 0.575, P = 0.819; post hoc analysis with the Holm-Sidak method |
n = 5 vehicle; n = 5 MDL100907; n = 4 WAY100135; n = 4 ondansetron |
| Fig. S9B, right |
F(3, 14) = 32.263, **P < 0.001, one-way ANOVA; vehicle vs. MDL100907, t = 8.795, **P < 0.001; vehicle vs. WAY100135, t = 0.703, P = 0.744; vehicle vs. ondansetron, t = 1.431, P = 0.437; post hoc analysis with the Holm-Sidak method |
n = 5 vehicle; n = 5 MDL100907; n = 4 WAY100135; n = 4 ondansetron |
Table 2. ANOVA followed by values of Holm-Sidak, Tukey, and Dunnett’s multiple comparisons tests.
| Figures | Holm-Sidak | Tukey | Dunnett’s |
| Fig. 1B | fDCN vs. iDCN, *P = 0.023; fDCN vs. dDCN, *P = 0.025; iDCN vs. dDCN, P = 0.845 |
fDCN vs. iDCN, *P = 0.028; fDCN vs. dDCN, *P = 0.021; iDCN vs. dDCN, P = 0.978 |
fDCN vs. iDCN, *P = 0.021; fDCN vs. dDCN, *P = 0.015 |
| Fig. 2C, left | OFF and 30 min, **P = 0.002; 10 and 30 min, *P = 0.045; OFF and 10 min, P = 0.12 |
OFF and 30 min, **P = 0.002; 10 and 30 min, P = 0.057; OFF and 10 min, P = 0.258 |
OFF and 30 min, **P = 0.001; OFF and 10 min, P = 0.205 |
| Fig. 2C, right | OFF and 30 min, **P < 0.001; 10 and 30 min, **P < 0.001; OFF and 10 min, P = 0.178 |
OFF and 30 min, **P < 0.001; 10 and 30 min, **P < 0.001; OFF and 10 min, P = 0.351 |
OFF and 30 min, **P < 0.001; OFF and 10 min, P = 0.292 |
| Fig. 3B | 10 and 30 min, **P = 0.009; 10 and 20 min, P = 0.055; 20 and 30 min, P = 0.105 |
10 and 30 min, **P = 0.007; 10 and 20 min, P = 0.063; 20 and 30 min, P = 0.217 |
10 and 30 min, **P = 0.005; 10 and 20 min, *P = 0.048 |
| Fig. 3D | Resting and dystonia, *P = 0.01; walking and dystonia, *P = 0.011; resting and walking, P = 0.664 |
Resting and dystonia, **P = 0.008; walking and dystonia, *P = 0.013; resting and walking, P = 0.893 |
Resting and dystonia, **P = 0.006; walking and dystonia, *P = 0.01 |
| Fig. 3I | 0–10 and 10–20 min, *P = 0.01; 0–10 and 20–30 min, **P < 0.001; 10–20 and 20–30 min, **P = 0.002 |
0–10 and 10–20 min, *P = 0.024; 0–10 and 20–30 min, **P < 0.001; 10–20 and 20–30 min, **P = 0.003 |
0–10 and 10–20 min, *P = 0.018; 0–10 and 20–30 min, **P < 0.001 |
| Fig. 4B, left | Vehicle vs. MDL100907, **P < 0.001; vehicle vs. WAY100135, P = 0.851; vehicle vs. ondansetron, P = 0.853 |
Number of samples to be compared is different | Vehicle vs. MDL100907, **P < 0.001; vehicle vs. WAY100135, P = 0.995; vehicle vs. ondansetron, P = 0.922 |
| Fig. 4B, middle | Vehicle vs. MDL100907, **P < 0.001; vehicle vs. WAY100135, P = 0.98; vehicle vs. ondansetron, P = 0.925 |
Number of samples to be compared is different | Vehicle vs. MDL100907, **P < 0.001; vehicle vs. WAY100135, P = 0.971; vehicle vs. ondansetron, P = 0.971 |
| Fig. 4B, right | Vehicle vs. MDL100907, **P < 0.001; vehicle vs. WAY100135, P = 0.889; vehicle vs. ondansetron, P = 0.935 |
Number of samples to be compared is different | Vehicle vs. MDL100907, **P < 0.001; vehicle vs. WAY100135, P = 0.998; vehicle vs. ondansetron, P = 0.976 |
| Fig. S8B, left | Vehicle and 0.02 mg, P = 0.07; vehicle and 0.1 mg, **P = 0.001; vehicle and 1 mg, **P < 0.001; vehicle and 2 mg, **P < 0.001 |
Number of samples to be compared is different | Vehicle and 0.02 mg, *P = 0.041; vehicle and 0.1 mg, **P < 0.001; vehicle and 1 mg, **P < 0.001; vehicle and 2 mg, **P < 0.001 |
| Fig. S8B, right | Vehicle and 0.02 mg, P = 0.109; vehicle and 0.1 mg, **P = 0.003; vehicle and 1 mg, **P < 0.001; vehicle and 2 mg, **P < 0.001 |
Number of samples to be compared is different | Vehicle and 0.02 mg, P = 0.064; vehicle and 0.1 mg, **P = 0.001; vehicle and 1 mg, **P < 0.001; vehicle and 2 mg, **P < 0.001 |
| Fig. S9A, left | Vehicle vs. MDL100907, **P = 0.006; vehicle vs. WAY100135, P = 0.654; vehicle vs. ondansetron, P = 0.712 |
Number of samples to be compared is different | Vehicle vs. MDL100907, **P = 0.003; vehicle vs. WAY100135, P = 0.938; vehicle vs. ondansetron, P = 0.651 |
| Fig. S9A, right | Vehicle vs. MDL100907, **P = 0.003; vehicle vs. WAY100135, P = 0.447; vehicle vs. ondansetron, P = 0.508 |
Number of samples to be compared is different | Vehicle vs. MDL100907, **P < 0.001; vehicle vs. WAY100135, P = 0.989; vehicle vs. ondansetron, P = 0.895 |
| Fig. S9B, left | Vehicle vs. MDL100907, **P < 0.001; vehicle vs. WAY100135, P = 0.805; vehicle vs. ondansetron, P = 0.819 |
Number of samples to be compared is different | Vehicle vs. MDL100907, **P < 0.001; vehicle vs. WAY100135, P = 0.989; vehicle vs. ondansetron, P = 0.895 |
| Fig. S9B, right | Vehicle vs. MDL100907, **P < 0.001; vehicle vs. WAY100135, P = 0.744; vehicle vs. ondansetron, P = 0.437 |
Number of samples to be compared is different | Vehicle vs. MDL100907, **P < 0.001; vehicle vs. WAY100135, P = 0.834; vehicle vs. ondansetron, P = 0.389 |
Table 3. Resulting SD.
| Figures | SD | Mouse no. |
| Fig. 1B | fDCN = 36.397, iDCN = 20.402, dDCN = 13.966 | n = 4 |
| Fig. 1E | (Left) control = 0, ChR2 = 1; (right) control = 0, ChR2 = 2 | n = 5 |
| Fig. 1H | (Left) control = 0.837, NpHR = 0.447; (right) control = 3.435, NpHR = 0.837 | n = 5 |
| Fig. 2C, left | OFF = 24.831, 10 min = 37.262, 30 min = 45.792 | n = 11 |
| Fig. 2C, right | OFF = 0, 10 min = 0.245, 30 min = 0.316 | n = 5 |
| Fig. 2F | OFF = 0, ON = 0.822 | n = 5 |
| Fig. 3B | 10 min = 3.434, 20 min = 1.013, 30 min = 5.67 | n = 4 |
| Fig. 3D | Resting = 0.547, walking = 0.82, dystonia = 3.938 | n = 4 |
| Fig. 3H | Control = 0.986, STIM1 = 8.484 | n = 5 |
| Fig. 3I | 0–10 min = 0.000, 10–20 min = 0.837, 20–30 min = 0.707 | n = 5 |
| Fig. 4B, left | Vehicle = 10.716, MDL100907 = 2.24; WAY100135 = 7.662, ondansetron = 9.73 |
n = 5 vehicle, n = 5 MDL100907, n = 4 WAY100135, n = 4 ondansetron |
| Fig. 4B, middle | Vehicle = 0.548, MDL100907 = 0.837; WAY100135 = 0.5, ondansetron = 0.5 |
n = 5 vehicle, n = 5 MDL100907, n = 4 WAY100135, n = 4 ondansetron |
| Fig. 4B, right | Vehicle = 1.673, MDL100907 = 1.225; WAY100135 = 2.062, ondansetron = 1.258 |
n = 5 vehicle, n = 5 MDL100907, n = 4 WAY100135, n = 4 ondansetron |
| Fig. 4D | Home vehicle 10, 20, and 30 min = 3.710, 0.413, and 1.351; OF vehicle 10, 20, and 30 min = 3.434, 1.013, and 5.670; home MDL100907 10, 20, and 30 min = 0.641, 0.432, and 1.015; OF MDL100907 10, 20, and 30 min = 0.959, 0.587, and 1.751 |
n = 4 |
| Fig. 4F | Scramble = 0.524, shRNA = 0.3 | Scramble n = 5, shRNA n = 6 |
| Fig. 4G | Scramble = 0.577, shRNA = 0.5 | Scramble n = 4, shRNA n = 4 |
| Fig. 4H | Scramble = 1.5, shRNA = 1 | Scramble n = 4, shRNA n = 4 |
| Fig. S4A, left | Control = 9.619, ChR2 = 52.1 | n = 4 |
| Fig. S4A, right | Control = 8.208, ChR2 = 36.854 | n = 4 |
| Fig. S4B, left | Control = 18.465, ChR2 = 125.02 | n = 4 |
| Fig. S4B, right | Control = 8.261, ChR2 = 45.392 | n = 4 |
| Fig. S5C, left | Control = 66.465, NpHR = 9.23 | n = 4 |
| Fig. S5C, right | Control = 48.614, NpHR = 30.759 | n = 4 |
| Fig. S5D, left | Control = 25.46, NpHR = 5.865 | n = 4 |
| Fig. S5D, right | Control = 25.512, NpHR = 9.843 | n = 4 |
| Fig. S6C | (DRD) control = 6.866, a1Atot/tot = 10.629; (DRV) control = 8.607, a1Atot/tot = 8.39 | Control n = 5, a1Atot/tot n = 6 |
| Fig. S6C | (fDCN) control = 4.283, a1Atot/tot = 9.592 | n = 3 |
| Fig. S7B | TA = 88.023, GS = 87.969 | n = 5 |
| Fig. S8B, left | Vehicle = 1.673, 0.02 mg of MDL100907 = 1.155, 0.1 mg of MDL100907 = 1.528, 1 mg of MDL100907 = 1.225, 2 mg of MDL100907 = 1.155 |
n = 5 vehicle, n = 3 0.02 mg of MDL100907, n = 3 0.1 mg of MDL100907, n = 5 1 mg of MDL100907, n = 3 2 mg of MDL100907 |
| Fig. S8B, right | Vehicle = 0.548, 0.02 mg of MDL100907 = 0.577, 0.1 mg of MDL100907 = 0.577, 1 mg of MDL100907 = 0.837, 2 mg of MDL100907 = 0.577 |
n = 5 vehicle, n = 3 0.02 mg of MDL100907, n = 3 0.1 mg of MDL100907, n = 5 1 mg of MDL100907, n = 3 2 mg of MDL100907 |
| Fig. S9A, left | Vehicle = 75.405, MDL100907 = 19.074, WAY100135 = 35.154, ondansetron = 3.851 |
n = 5 vehicle, n = 5 MDL100907, n = 4 WAY100135, n = 4 ondansetron |
| Fig. S9A, right | Vehicle = 97.898, MDL100907 = 8.169, WAY100135 = 19.439, ondansetron = 27.651 |
n = 5 vehicle, n = 5 MDL100907, n = 4 WAY100135, n = 4 ondansetron |
| Fig. S9B, left | Vehicle = 22.46, MDL100907 = 7.762, WAY100135 = 11.429, ondansetron = 14.655 |
n = 5 vehicle, n = 5 MDL100907, n = 4 WAY100135, n = 4 ondansetron |
| Fig. S9B, right | Vehicle = 22.094, MDL100907 = 6.627, WAY100135 = 6.635, ondansetron = 24.036 |
n = 5 vehicle, n = 5 MDL100907, n = 4 WAY100135, n = 4 ondansetron |
Table 5. Timelines of experiments.
| Figures | Timelines of experiments | Mouse |
| Fig. 1, A to E | Photostimulation for 30 min upon entering open-field box | ePet1 cre::DIO-ChR2;a1A+/+ |
| Fig. 1, F to H | Photoinhibition for 45 min upon entering open-field box | ePet1 cre::DIO-NpHR;a1Atot/tot |
| Fig. 2, A to C | OFF, 10-min photostimulation; ON, 30 min during single unit recording | ePet1 cre::DIO-ChR2;a1A+/+ |
| Fig. 2, D to F | Repeated three times (OFF, 30-s photostimulation; ON, 30 s) in an open-field box |
CamKIIα-fDCN-ChR2;a1A+/+ |
| Figs. 3, A to D, and 4, C and D | Mice were intraperitoneally injected with drugs at 30 min before testing—mice were recorded in their home cage or in an open-field box for 30 min |
a1Atot/tot |
| Fig. 3, E to I | Photostimulation for 30 min upon entering open-field box | CamKIIα-fDCN-OptoSTIM1;a1A+/+ |
| Fig. 4, A and B, and fig. S8 | Mice were intraperitoneally injected with drugs at 30 min before testing—mice were recorded in an open-field box for 45 min |
a1Atot/tot |
| Fig. 4, E to H | 45-min recording in an open-field box | U6-fDCN-5HT2AR shRNA;a1Atot/tot |
| Figs. S3A and S7A | Photostimulation in an open-field box—home cage for 90 min after the last photostimulation in the open-field box—perfusion |
ePet1 cre::DIO-ChR2;a1A+/+ CamKIIα-fDCN-ChR2;a1A+/+ |
| Fig. S6 | 45 min in an open-field box—90 min in their home cage—perfusion | a1Atot/tot |
Table 4. Table of reagents and resources.
| Reagent or resource | Source | Identifier |
| Antibody | ||
| Sheep anti-TPH | Millipore | AB1541 |
| Rabbit anti–c-Fos | Millipore | F7799 |
| FITC-conjugated donkey anti-sheep | Santa Cruz Biotechnology | SC-2476 |
| FITC-conjugated donkey anti-rabbit | Invitrogen | A-21206 |
| Anti-serotonin receptor 2A/HTR2A | Millipore | MABN1595 |
| Anti–β-actin | Santa Cruz Biotechnology | SC-47778 |
| Mouse IgG antibodies | Thermo Fisher Scientific | G-21040 |
| Virus strains | ||
| AAV2/1-EF1a-DIO-ChR2-mCherry | UPenn Vector core | AV-1-20297P |
| AAV2/9-EF1a-DIO-eNpHR3.0-eYFP | UPenn Vector core | AV-9-26966P |
| AAV2/5-EF1a-DIO-eYFP | UNC Vector core | AV-4310d |
| AAV2/9-CAG-FLEX-GCaMP6m | UPenn Vector core | V-5735 L |
| AAV2/9-CMV-Cre | UPenn Vector core | V4769MI-R-DL |
| AAV2/9-CamKIIα-hChR2(H134R)-mCherry | UPenn Vector core | 26969-AAV9 |
| pLenti-CamKIIα-OptoSTIM1-eGFP | KAIST | Dr. Won Do Heo |
| AAV-U6-5HT-2ARshRNA-CMV-GFP | Vigene Bioscience | SH885137 |
| Chemicals, recombinant proteins | ||
| DiI | Sigma-Aldrich | 42364; CAS: 41085–99-8 |
| Isoflurane | Hana Pharm. Co. Ltd. | N/A |
| Vectashield mounting medium with DAPI | Vector Labs | H-1200 |
| Triton X-100 | Sigma-Aldrich | 93443; CAS: 9002-93-1 |
| Normal donkey serum | Sigma-Aldrich | D9663 |
| NaCl | Sigma-Aldrich | S7653; CAS: 7647-14-5 |
| Sucrose | Biosesang | S1030; CAS:57–50-1 |
| NaHCO3 | Sigma-Aldrich | S6297; CAS: 144–55-8 |
| KCl | Sigma-Aldrich | P3911; CAS: 7447-40-7 |
| MgCl2 | Sigma-Aldrich | M9272; CAS: 7791-18-6 |
| Hepes | Sigma-Aldrich | H4034; CAS:7365-45-9 |
| Experimental model: strains | ||
| Mouse/a1Atot/tot | The Jackson Laboratory | Stock no. 000544 |
| Mouse/ePet1-cre | The Jackson Laboratory | Stock no. 012712 |
| Software and algorithms | ||
| Spike Extractor | Neuralynx | https://neuralynx.com/software/category/file-converters-utilities |
| SpikeSort 3D | Neuralynx | https://neuralynx.com/software/spikesort-3d |
| Neuroexplorer v.4.133 | Nex Technologies | http://www.neuroexplorer.com/ |
| MATLAB R2013a | MathWorks | https://kr.mathworks.com/products/matlab.html |
| pClamp | Molecular Devices | https://www.moleculardevices.com/systems/conventional-patch-clamp/pclamp-10-software |
| 5HT antagonists | ||
| MDL100907 | Sigma-Aldrich | M3324; CAS: 139290-65-6 |
| WAY100135 | Sigma-Aldrich | W1895; CAS: 149055-79-8 |
| Ondansetron | Sigma-Aldrich | O3639; CAS: 99614-02-5 |
| Other | ||
| 473-nm laser | Shanghai Laser | BL473T8 |
| 561-nm laser | CrystaLaser | CL-561-050 |
| Waveform generator | Agilent | 33521B |
| Teflon-coated tungsten wire (limb-muscle EMG) | A-M systems | 793200 |
| Stainless steel wire (ground reference) | A-M systems | 790700 |
| Electrode interface board | Neuralynx | EIB-16 |
| Polyimide-coated NiCr wire | Kanthal Precision Technology | PF002005 |
| Gold pins | Neuralynx | EIB-pin |
| Nano-Z | Neuralynx | N/A |
| Preamplifier head-stage | Neuralynx | HS-16 |
| Digital Lynx acquisition system | Neuralynx | Digital Lynx 4SX |
| Quartz-coated tetrode | Thomas Recording | AN000259 (Tip shape A) |
| AC amplifier | Thomas Recording | 16-PGMA; Article# AN000706 |
| Silicon optrode | NeuroNexus | A1x16-5 mm-25-177-OA16 |
| Cryotome | Leica | CM1850 |
| Confocal microscope | Carl Zeiss | LSM780 |
Acknowledgments
Funding: This work was performed using grants from the Bio & Medical Technology Development Program (2019M3E5D2A01066259) through the National Research Foundation of Korea (NRF) funded by the Ministry of Science and ICT, KAIST Institute of Technology Value Creation, Industry Liaison Center (G-CORE Project) grant funded by the Ministry of Science and ICT (N11200197). This paper is based on a research that has been conducted as part of the KAIST-funded Global Singularity Research Program for 2020. Imaging devices and analyses were supported by the KAIST Institute for the Bio Core Center. Author contributions: The behavioral experiments were performed by J.E.K., S.K., W.D.H., and D.K. and analyzed by J.E.K., S.C., S.K., Y.-J.J., and D.K. The Western blot experiments were performed by J.E.K., S.C., and M.-G.K. The c-Fos experiments and analyses were conducted by J.E.K. and Y.-J.J. The manuscript was written by D.K. and J.E.K. Competing interests: The authors declare that they have no competing interests. Data and materials availability: All data needed to evaluate the conclusions in the paper are present in the paper and/or the Supplementary Materials. Additional data related to this paper may be requested from the authors.
SUPPLEMENTARY MATERIALS
Supplementary material for this article is available at http://advances.sciencemag.org/cgi/content/full/7/10/eabb5735/DC1
REFERENCES AND NOTES
- 1.Németh A. H., The genetics of primary dystonias and related disorders. Brain 125, 695–721 (2002). [DOI] [PubMed] [Google Scholar]
- 2.Schneider S. A., Bhatia K. P., Secondary dystonia—Clinical clues and syndromic associations. Eur. J. Neurol. 17, 52–57 (2010). [DOI] [PubMed] [Google Scholar]
- 3.de Carvalho Aguiar P. M., Ozelius L. J., Classification and genetics of dystonia. Lancet Neurol. 1, 316–325 (2002). [DOI] [PubMed] [Google Scholar]
- 4.K. A. Gwinn-Hardy, C. H. Adler, A. L. Weaver, N. M. Fish, S. J. Newman, in Mayo Clinic Proceedings (Elsevier, 2000), vol. 75, pp. 235–240. [DOI] [PubMed] [Google Scholar]
- 5.Ioannou C. I., Furuya S., Altenmüller E., The impact of stress on motor performance in skilled musicians suffering from focal dystonia: Physiological and psychological characteristics. Neuropsychologia 85, 226–236 (2016). [DOI] [PubMed] [Google Scholar]
- 6.Altenmüller E., Jabusch H.-C., Focal hand dystonia in musicians: Phenomenology, etiology, and psychological trigger factors. J. Hand Ther. 22, 144–155 (2009). [DOI] [PubMed] [Google Scholar]
- 7.Werle R. W., Takeda S. Y. M., Zonta M. B., Guimarães A. T. B., Teive H. A. G., The physical, social and emotional aspects are the most affected in the quality of life of the patients with cervical dystonia. Arq. Neuropsiquiatr. 72, 405–410 (2014). [DOI] [PubMed] [Google Scholar]
- 8.Jankovic J., Treatment of dystonia. Lancet Neurol. 5, 864–872 (2006). [DOI] [PubMed] [Google Scholar]
- 9.Vercueil L., Pollak P., Fraix V., Caputo E., Moro E., Benazzouz A., Xie J., Koudsie A., Benabid A.-L., Deep brain stimulation in the treatment of severe dystonia. J. Neurol. 248, 695–700 (2001). [DOI] [PubMed] [Google Scholar]
- 10.Krauss J. K., Pohle T., Weber S., Ozdoba C., Burgunder J.-M., Bilateral stimulation of globus pallidus internus for treatment of cervical dystonia. Lancet 354, 837–838 (1999). [DOI] [PubMed] [Google Scholar]
- 11.Jankovic J., Brin M. F., Therapeutic uses of botulinum toxin. N. Engl. J. Med. 324, 1186–1194 (1991). [DOI] [PubMed] [Google Scholar]
- 12.Smit M., García D. V., de Jong B. M., Zoons E., Booij J., Dierckx R. A., Willemsen A. T., de Vries E. F., Bartels A. L., Tijssen M. A., Relationships between serotonin transporter binding in the raphe nuclei, basal ganglia, and hippocampus with clinical symptoms in cervical dystonia: A [11C] DASB positron emission tomography study. Front. Neurol. 9, 88 (2018). [DOI] [PMC free article] [PubMed] [Google Scholar]
- 13.Fitzgerald K., Healy D., Dystonias and dyskinesias of the jaw associated with the use of SSRIs. Hum. Psychopharmacol. 10, 215–219 (1995). [Google Scholar]
- 14.C. Batini, The cerebellar projection from the neurons of the raphe nuclei and the origin of the serotoninergic innervation of the cerebellum, in Serotonin, the Cerebellum, and Ataxia, P. Trouillas, K. Fuxe, Eds. (New York: Raven, 1993), pp. 51–61. [Google Scholar]
- 15.Calderon D. P., Fremont R., Kraenzlin F., Khodakhah K., The neural substrates of rapid-onset dystonia-parkinsonism. Nat. Neurosci. 14, 357–365 (2011). [DOI] [PMC free article] [PubMed] [Google Scholar]
- 16.Bouwknecht J. A., Spiga F., Staub D. R., Hale M. W., Shekhar A., Lowry C. A., Differential effects of exposure to low-light or high-light open-field on anxiety-related behaviors: Relationship to c-Fos expression in serotonergic and non-serotonergic neurons in the dorsal raphe nucleus. Brain Res. Bull. 72, 32–43 (2007). [DOI] [PMC free article] [PubMed] [Google Scholar]
- 17.Kirby L. G., Freeman-Daniels E., Lemos J. C., Nunan J. D., Lamy C., Akanwa A., Beck S. G., Corticotropin-releasing factor increases GABA synaptic activity and induces inward current in 5-hydroxytryptamine dorsal raphe neurons. J. Neurosci. 28, 12927–12937 (2008). [DOI] [PMC free article] [PubMed] [Google Scholar]
- 18.Lowry C. A., Rodda J. E., Lightman S. L., Ingram C. D., Corticotropin-releasing factor increases in vitro firing rates of serotonergic neurons in the rat dorsal raphe nucleus: Evidence for activation of a topographically organized mesolimbocortical serotonergic system. J. Neurosci. 20, 7728–7736 (2000). [DOI] [PMC free article] [PubMed] [Google Scholar]
- 19.Maswood S., Barter J. E., Watkins L. R., Maier S. F., Exposure to inescapable but not escapable shock increases extracellular levels of 5-HT in the dorsal raphe nucleus of the rat. Brain Res. 783, 115–120 (1998). [DOI] [PubMed] [Google Scholar]
- 20.Takase L. F., Nogueira M. I., Baratta M., TBland S., R Watkins L., FMaier S., AFornal C., LJacobs B., Inescapable shock activates serotonergic neurons in all raphe nuclei of rat. Behav. Brain Res. 153, 233–239 (2004). [DOI] [PubMed] [Google Scholar]
- 21.Fureman B. E., Jinnah H., Hess E. J., Triggers of paroxysmal dyskinesia in the calcium channel mouse mutant tottering. Pharmacol. Biochem. Behav. 73, 631–637 (2002). [DOI] [PubMed] [Google Scholar]
- 22.Shirley T. L., Rao L. M., Hess E. J., Jinnah H., Paroxysmal dyskinesias in mice. Mov. Disord. 23, 259–264 (2008). [DOI] [PMC free article] [PubMed] [Google Scholar]
- 23.Fletcher C. F., Lutz C. M., O’Sullivan T. N., Shaughnessy J. D. Jr., Hawkes R., Frankel W. N., Copeland N. G., Jenkins N. A., Absence epilepsy in tottering mutant mice is associated with calcium channel defects. Cell 87, 607–617 (1996). [DOI] [PubMed] [Google Scholar]
- 24.Walter J. T., Alviña K., Womack M. D., Chevez C., Khodakhah K., Decreases in the precision of Purkinje cell pacemaking cause cerebellar dysfunction and ataxia. Nat. Neurosci. 9, 389–397 (2006). [DOI] [PubMed] [Google Scholar]
- 25.Brocard C., Plantier V., Boulenguez P., Liabeuf S., Bouhadfane M., Viallat-Lieutaud A., Vinay L., Brocard F., Cleavage of Na+ channels by calpain increases persistent Na+ current and promotes spasticity after spinal cord injury. Nat. Med. 22, 404–411 (2016). [DOI] [PubMed] [Google Scholar]
- 26.Kim J., Kim Y., Nakajima R., Shin A., Jeong M., Park A. H., Jeong Y., Jo S., Yang S., Park H., Cho S.-H., Cho K.-H., Shim I., Chung J. H., Paik S.-B., Augustine G. J., Kim D., Inhibitory basal ganglia inputs induce excitatory motor signals in the thalamus. Neuron 95, 1181–1196.e8 (2017). [DOI] [PubMed] [Google Scholar]
- 27.Matthews G. A., Nieh E. H., Vander Weele C. M., Halbert S. A., Pradhan R. V., Yosafat A. S., Glober G. F., Izadmehr E. M., Thomas R. E., Lacy G. D., Wildes C. P., Ungless M. A., Tye K. M., Dorsal raphe dopamine neurons represent the experience of social isolation. Cell 164, 617–631 (2016). [DOI] [PMC free article] [PubMed] [Google Scholar]
- 28.Cui G., Jun S. B., Jin X., Pham M. D., Vogel S. S., Lovinger D. M., Costa R. M., Concurrent activation of striatal direct and indirect pathways during action initiation. Nature 494, 238–242 (2013). [DOI] [PMC free article] [PubMed] [Google Scholar]
- 29.Park S.-G., Jeong Y.-C., Kim D.-G., Lee M.-H., Shin A., Park G., Ryoo J., Hong J., Bae S., Kim C.-H., Lee P.-S., Kim D., Medial preoptic circuit induces hunting-like actions to target objects and prey. Nat. Neurosci. 21, 364–372 (2018). [DOI] [PubMed] [Google Scholar]
- 30.Kyung T., Lee S., Kim J. E., Cho T., Park H., Jeong Y.-M., Kim D., Shin A., Kim S., Baek J., Kim J., Kim N. Y., Woo D., Chae S., Kim C.-H., Shin H.-S., Han Y.-M., Kim D., Heo W. D., Optogenetic control of endogenous Ca2+ channels in vivo. Nat. Biotechnol. 33, 1092–1096 (2015). [DOI] [PubMed] [Google Scholar]
- 31.I. Raote, A. Bhattacharya, M. M. Panicker, Serotonin 2A (5-HT2A) receptor function: Ligand-dependent mechanisms and pathways, in Serotonin Receptors in Neurobiology, A. Chattopadhyay, Ed. (CRC Press/Taylor & Francis, 2007), pp. 105–132. [PubMed] [Google Scholar]
- 32.Oostland M., Buijink M. R., Teunisse G. M., von Oerthel L., Smidt M. P., van Hooft J. A., Distinct temporal expression of 5-HT1A and 5-HT2A receptors on cerebellar granule cells in mice. Cerebellum 13, 491–500 (2014). [DOI] [PMC free article] [PubMed] [Google Scholar]
- 33.Magalhaes A. C., Holmes K. D., Dale L. B., Comps-Agrar L., Lee D., Yadav P. N., Drysdale L., Poulter M. O., Roth B. L., Pin J.-P., Anisman H., Ferguson S. S. G., CRF receptor 1 regulates anxiety behavior via sensitization of 5-HT2 receptor signaling. Nat. Neurosci. 13, 622–629 (2010). [DOI] [PMC free article] [PubMed] [Google Scholar]
- 34.Hanson G. R., Bush L. G., Taylor V. L., Gibb J. W., Davis K., Schmidt C. J., Comparison of neurotensin responses to MDL 100,907, a selective 5HT2A antagonist, with clozapine and haloperidol. Brain Res. Bull. 42, 211–219 (1997). [DOI] [PubMed] [Google Scholar]
- 35.Harvey P. J., Li X., Li Y., Bennett D. J., 5-HT2 receptor activation facilitates a persistent sodium current and repetitive firing in spinal motoneurons of rats with and without chronic spinal cord injury. J. Neurophysiol. 96, 1158–1170 (2006). [DOI] [PMC free article] [PubMed] [Google Scholar]
- 36.Delnooz C. C., Horstink M. W., Tijssen M. A., van de Warrenburg B. P., Paramedical treatment in primary dystonia: A systematic review. Mov. Disord. 24, 2187–2198 (2009). [DOI] [PubMed] [Google Scholar]
- 37.Handley S. L., McBlane J. W., 5HT drugs in animal models of anxiety. Psychopharmacology (Berl.) 112, 13–20 (1993). [DOI] [PubMed] [Google Scholar]
- 38.Reccoppa L., Welch W. A., Ware M. R., Acute dystonia and fluoxetine. J. Clin. Psychiatry 51, 487 (1990). [PubMed] [Google Scholar]
- 39.Cornea-Hébert V., Riad M., Wu C., Singh S. K., Descarries L., Cellular and subcellular distribution of the serotonin 5-HT2A receptor in the central nervous system of adult rat. J. Comp. Neurol. 409, 187–209 (1999). [DOI] [PubMed] [Google Scholar]
- 40.Fremont R., Tewari A., Angueyra C., Khodakhah K., A role for cerebellum in the hereditary dystonia DYT1. eLife 6, e22775 (2017). [DOI] [PMC free article] [PubMed] [Google Scholar]
- 41.Chen C. H., Fremont R., Arteaga-Bracho E. E., Khodakhah K., Short latency cerebellar modulation of the basal ganglia. Nat. Neurosci. 17, 1767–1775 (2014). [DOI] [PMC free article] [PubMed] [Google Scholar]
- 42.Park Y.-G., Kim J., Kim D., The potential roles of T-type Ca2+ channels in motor coordination. Front. Neural Circuits 7, 172 (2013). [DOI] [PMC free article] [PubMed] [Google Scholar]
- 43.Anshel M. H., Kaissidis A. N., Coping style and situational appraisals as predictors of coping strategies following stressful events in sport as a function of gender and skill level. Br. J. Psychol. 88, 263–276 (1997). [DOI] [PubMed] [Google Scholar]
- 44.Rieger S., Sagasti A., Hydrogen peroxide promotes injury-induced peripheral sensory axon regeneration in the zebrafish skin. PLOS Biol. 9, e1000621 (2011). [DOI] [PMC free article] [PubMed] [Google Scholar]
- 45.Conte W. L., Kamishina H., Reep R. L., Multiple neuroanatomical tract-tracing using fluorescent Alexa Fluor conjugates of cholera toxin subunit B in rats. Nat. Protoc. 4, 1157–1166 (2009). [DOI] [PubMed] [Google Scholar]
- 46.Neychev V. K., Fan X., Mitev V., Hess E. J., Jinnah H., The basal ganglia and cerebellum interact in the expression of dystonic movement. Brain 131, 2499–2509 (2008). [DOI] [PMC free article] [PubMed] [Google Scholar]
- 47.Pearson K. G., Acharya H., Fouad K., A new electrode configuration for recording electromyographic activity in behaving mice. J. Neurosci. Methods 148, 36–42 (2005). [DOI] [PubMed] [Google Scholar]
- 48.Wang J., Cao B., Yu T. R., Jelfs B., Yan J., Chan R. H. M., Li Y., Theta-frequency phase-locking of single anterior cingulate cortex neurons and synchronization with the medial thalamus are modulated by visceral noxious stimulation in rats. Neuroscience 298, 200–210 (2015). [DOI] [PubMed] [Google Scholar]
- 49.Di Nardo F., Mengarelli A., Maranesi E., Burattini L., Fioretti S., Assessment of the ankle muscle co-contraction during normal gait: A surface electromyography study. J. Electromyogr. Kinesiol. 25, 347–354 (2015). [DOI] [PubMed] [Google Scholar]
- 50.Berardelli A., Rothwell J. C., Hallett M., Thompson P. D., Manfredi M., Marsden C. D., The pathophysiology of primary dystonia. Brain 121, 1195–1212 (1998). [DOI] [PubMed] [Google Scholar]
- 51.Tenan M. S., Tweedell A. J., Haynes C. A., Analysis of statistical and standard algorithms for detecting muscle onset with surface electromyography. PLOS ONE 12, e0177312 (2017). [DOI] [PMC free article] [PubMed] [Google Scholar]
- 52.Wang D. D., de Hemptinne C., Miocinovic S., Ostrem J. L., Galifianakis N. B., San Luciano M., Starr P. A., Pallidal deep-brain stimulation disrupts pallidal beta oscillations and coherence with primary motor cortex in Parkinson’s disease. J. Neurosci. 38, 4556–4568 (2018). [DOI] [PMC free article] [PubMed] [Google Scholar]
- 53.Kattla S., Lowery M. M., Fatigue related changes in electromyographic coherence between synergistic hand muscles. Exp. Brain Res. 202, 89–99 (2010). [DOI] [PubMed] [Google Scholar]
- 54.Go S. A., Coleman-Wood K., Kaufman K. R., Frequency analysis of lower extremity electromyography signals for the quantitative diagnosis of dystonia. J. Electromyogr. Kinesiol. 24, 31–36 (2014). [DOI] [PMC free article] [PubMed] [Google Scholar]
- 55.Chaniary K., Baron M., Rice A., Wetzel P., Shapiro S., Electromyographic characterization in an animal model of dystonia. Mov. Disord. 23, 1122–1129 (2008). [DOI] [PubMed] [Google Scholar]
- 56.Hong J., Kim D., Freezing response-independent facilitation of fear extinction memory in the prefrontal cortex. Sci. Rep. 7, 5363 (2017). [DOI] [PMC free article] [PubMed] [Google Scholar]
- 57.K. B. Franklin, G. Paxinos, The Mouse Brain in Stereotaxic Coordinates (Elsevier, 2008). [Google Scholar]
- 58.Löscher W., Richter A., The novel selective and silent 5-HT1A receptor antagonist (+)-WAY-100135 aggravates dystonic movements in a mutant hamster model. Eur. J. Pharmacol. 255, 235–238 (1994). [DOI] [PubMed] [Google Scholar]
- 59.Barr A. M., Lehmann-Masten V., Paulus M., Gainetdinov R. R., Caron M. G., Geyer M. A., The selective serotonin-2A receptor antagonist M100907 reverses behavioral deficits in dopamine transporter knockout mice. Neuropsychopharmacology 29, 221–228 (2004). [DOI] [PubMed] [Google Scholar]
- 60.Minville V., Fourcade O., Mazoit J. X., Girolami J. P., Tack I., Ondansetron does not block paracetamol-induced analgesia in a mouse model of fracture pain. Br. J. Anaesth. 106, 112–118 (2011). [DOI] [PubMed] [Google Scholar]
Associated Data
This section collects any data citations, data availability statements, or supplementary materials included in this article.
Supplementary Materials
Supplementary material for this article is available at http://advances.sciencemag.org/cgi/content/full/7/10/eabb5735/DC1