Figure 3:

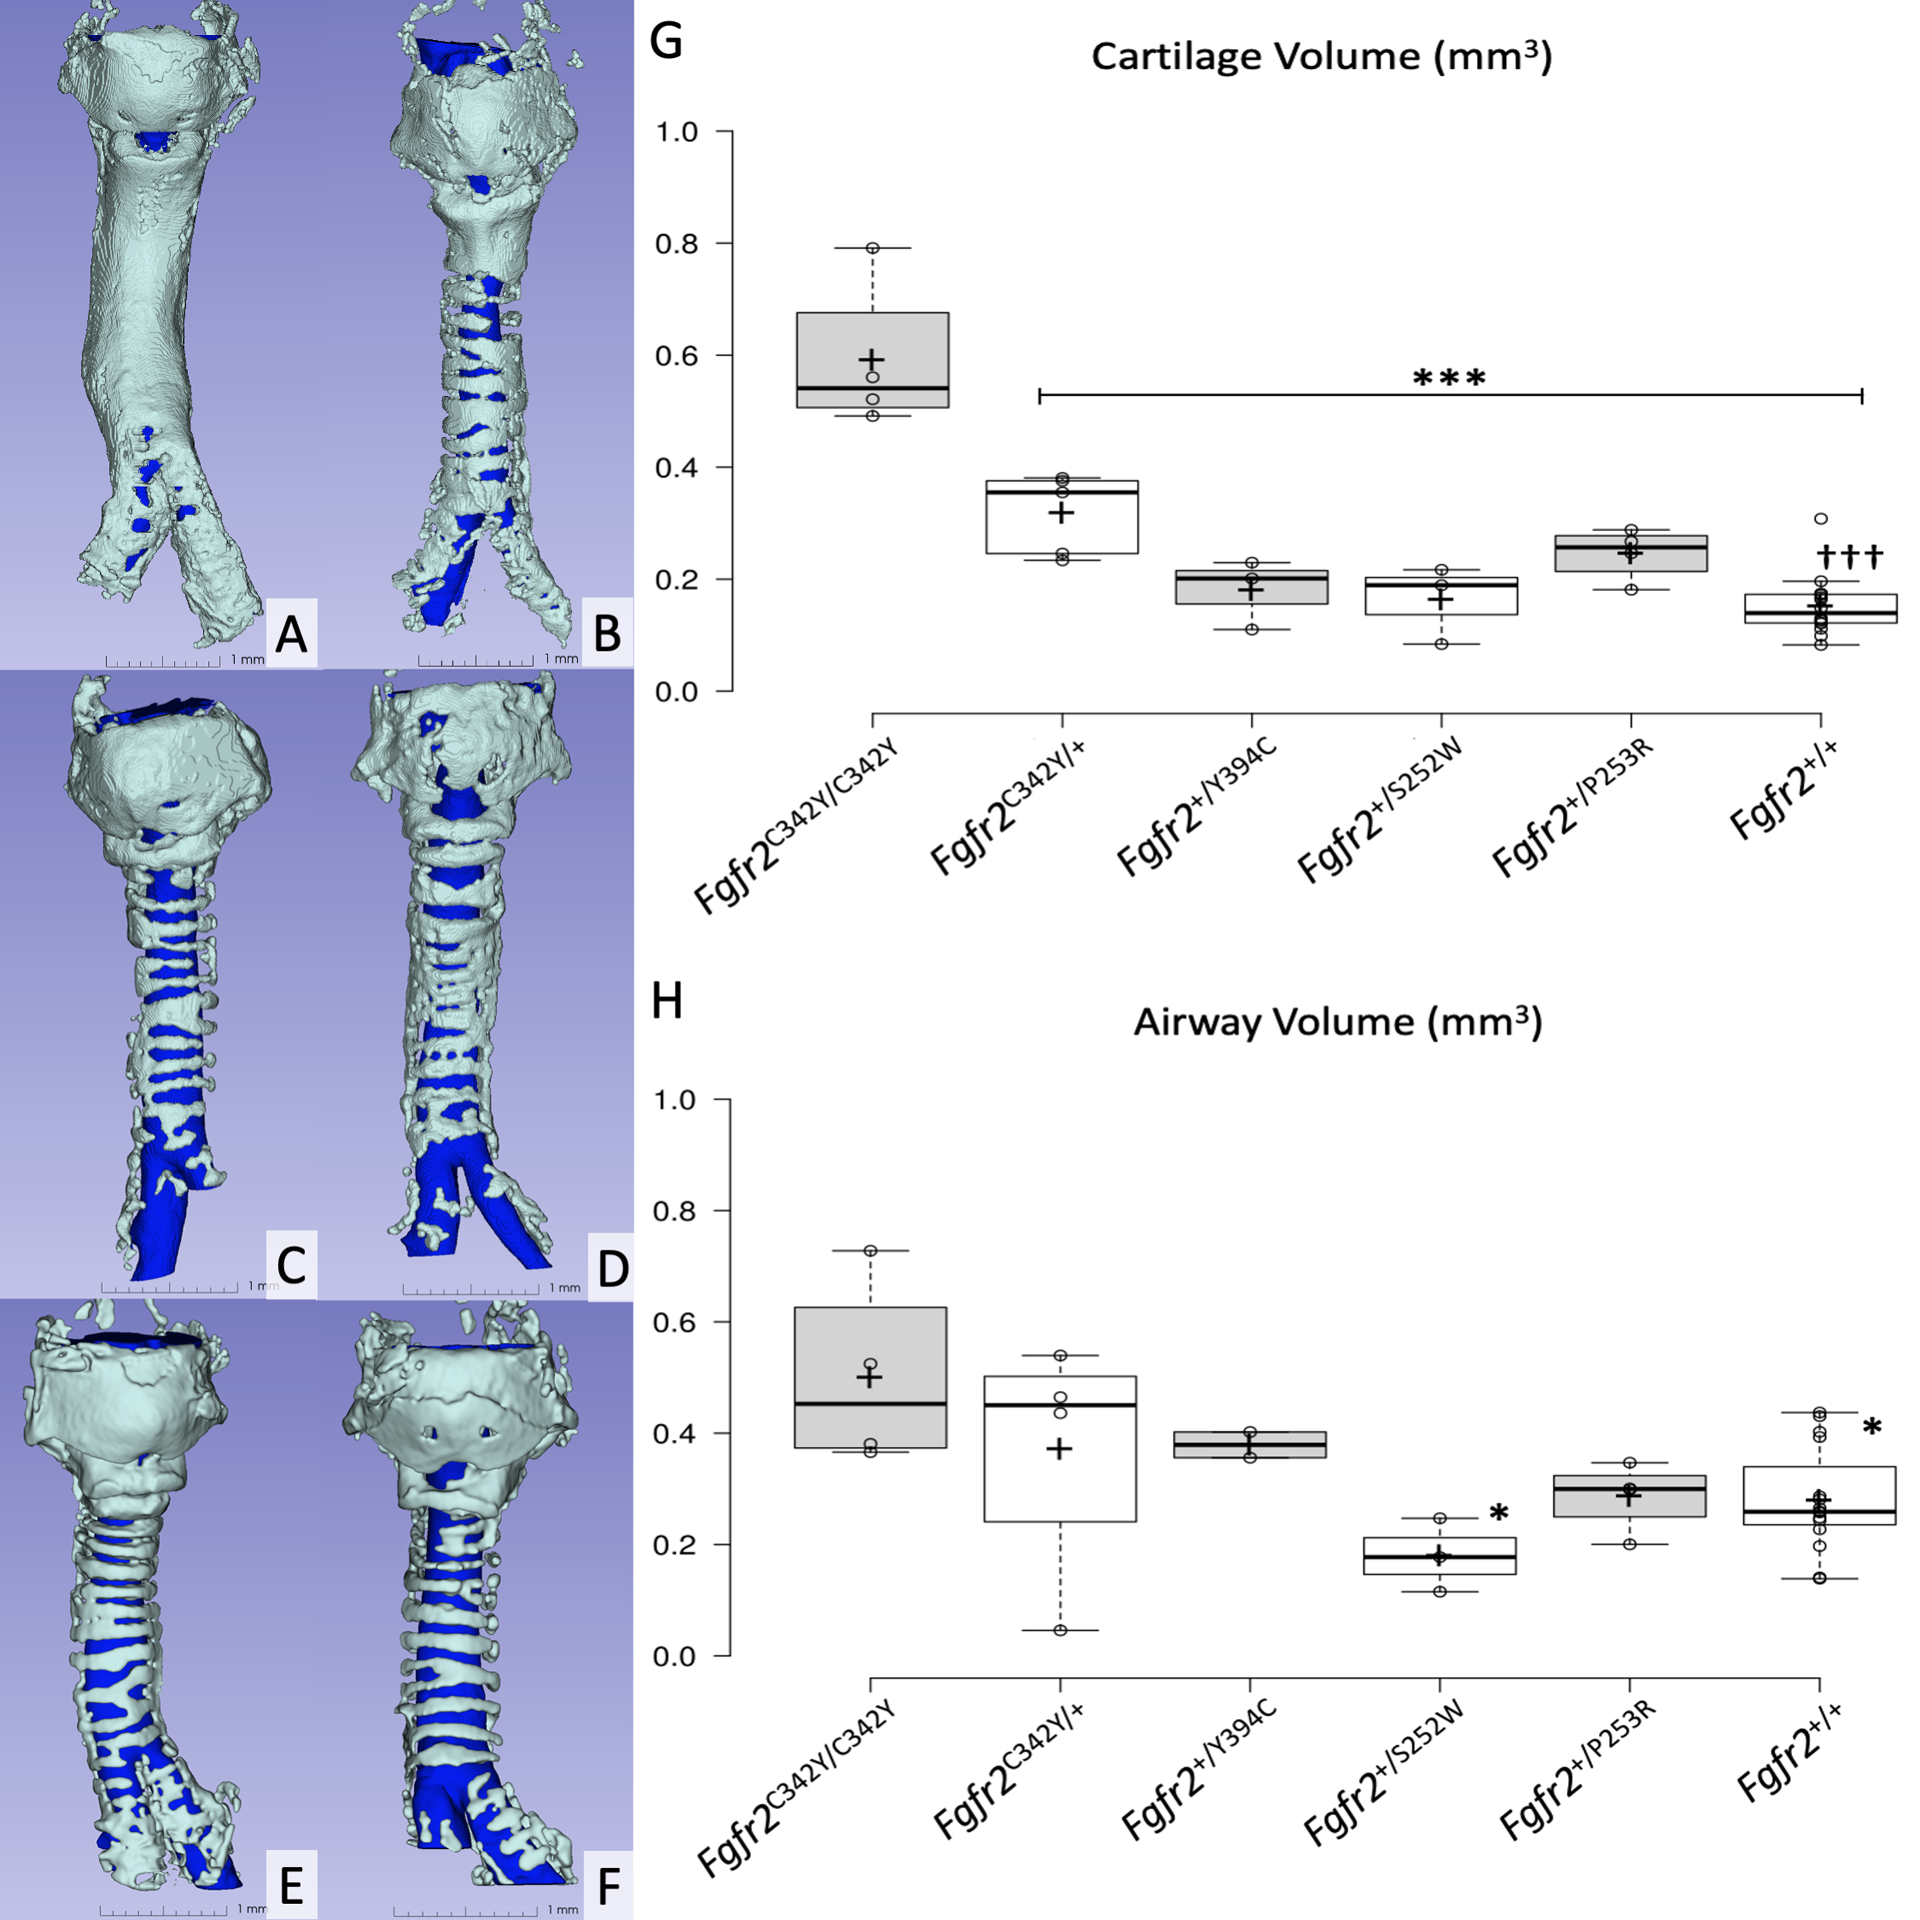
Panels A-F represent 3D-reconstructions of microcomputed-tomography specimens, A) Fgfr2C342Y/C342Y, B) Fgfr2C342Y/+, C) Fgfr2+/Y394C, D) Fgfr2+/S252W, E) Fgfr2+/P253R and F) Fgfr2+/+. Scale bars = 1.0 mm.
Panels G and H demonstrate box and whisker plots representing cartilage volume and airway volume, respectively. Center lines show the medians; box limits indicate the 25th and 75th percentiles; whiskers extend 1.5 times the interquartile range from the 25th and 75th percentiles; crosses represent sample means; data points are plotted as open circles.
* p < .05 vs Fgfr2C342Y/C342Y
*** p < .001 vs Fgfr2C342Y/C342Y
††† p < .001 vs Fgfr2C342Y/+
