

Abstract
Focal stacks are an alternative spatial arrangement of enamel rods within the inner enamel of mandibular mouse incisors where short rows comprised of 2–45 enamel rods are nestled at the side of much longer rows, both sharing the same rod tilt directed mesially or laterally. The significance of focal stacks to enamel function is unknown, but their high frequency in transverse sections (30% of all rows) suggests that they serve some purpose beyond representing an oddity of enamel development. In this study, we characterized the spatial distribution of focal stacks in random transverse sections relative to different regions of the inner enamel and to different locations across enamel thickness. The curving dentinoenamel junction (DEJ) in transverse sections complicated spatial distribution analyses, and a technique was developed to “unbend” the curving DEJ allowing for more linear quantitative analyses to be carried out. The data indicated that on average there were 36 ± 7 focal stacks located variably within the inner enamel in any given transverse section. Consistent with area distributions, focal stacks were four times more frequent in the lateral region (53%) and twice as frequent in the mesial region (33%) compared to the central region (14%). Focal stacks were equally split by tilt (52% mesial vs. 48% lateral, not significant), but those having a mesial tilt were more frequently encountered in the lateral and central regions (2:1) and those having a lateral tilt were more numerous in the mesial region (1:3). Focal stacks having a mesial tilt were longer on average compared to those having a lateral tilt (7.5 ± 5.6 vs. 5.9 ± 4.0 rods per row, p < 0.01). There was no relationship between the length of a focal stack and its location within the inner enamel. All results were consistent with the notion that focal stacks travel from the DEJ to the outer enamel the same as the longer and decussating companion rows to which they are paired. The spatial distribution of focal stacks within the inner enamel was not spatially random but best fit a null model based on a heterogenous Poisson point process dependent on regional location within the transverse plane of the enamel layer.
Keywords: enamel rods, focal stacks, mouse incisor, quantification, row organization, spatial distribution
The objective of this study is to ascertain if current techniques in 2D spatial point pattern analyses can be applied to mouse incisor enamel to establish if the packing of rows across the thickness of the inner enamel is spatially random or shows clustering or some type of repeating pattern. Knowledge of the spatial distribution characteristics of rows of enamel rods could provide new insights into how rows of ameloblasts initially form at the start of enamel formation.

1. INTRODUCTION
The basic organization of tooth enamel in the form of rods (prisms) and equally mineralized interrod areas (interprismatic material) filling the spaces between the rods is a common feature in all mammalian enamels (Boyde, 1989; Koenigswald & Clemens, 1992; Line & Novaes, 2005; Stern & Crompton, 1995; Wood et al., 1999). What differs between mammals are attributes like total enamel thickness, the shape and 3D path along which the enamel rods travel from the dentinoenamel junction (DEJ) to the outer surface, and how the enamel rods are bundled together into groups. Grouping of enamel rods is believed to be a direct reflection of how the ameloblasts were organized into rows and moved through space during the secretory stage of amelogenesis when the rods are formed, reviewed in (Smith et al., 2019a,b). Enamel rod grouping ultimately has implications to the level of fracture and abrasion resistance capable by a given enamel layer (Habelitz, 2015; Smith et al., 2019a; Yilmaz et al., 2015).
One of the more extreme examples of ameloblast, and by extension enamel rod, grouping is seen in rodent incisors (Smith et al., 2019a). The enamel in these teeth is constructed in four distinct layers: initial, inner, outer, and final (Warshawsky, 1971). The initial and final layers are exclusively interrod‐type enamel and only a few micrometers in thickness. They act essentially as binding layers for enamel rods, the initial layer between the DEJ and the inner enamel where enamel rods begin, and the final layer covering over and smoothening the terminal ends of the enamel rods in the outer enamel (Warshawsky, 1971). Most of enamel thickness is formed by the inner and outer enamel but the amount contributed by each to total enamel thickness varies on maxillary and mandibular incisors as well as between different rodent species (Koenigswald & Clemens, 1992; Martin, 1999; Moinichen et al., 1996). On mandibular incisors of mice, the inner:outer ratio is 10:2 (Smith et al., 2019b). The inner and outer enamel layers correspond to different portions of enamel rods traveling between the initial and final layers (Warshawsky & Smith, 1971). The inner enamel portions of the enamel rods in mandibular mouse incisors are angled about 45° away from the DEJ in an incisal direction (Moinichen et al., 1996). They are also variably tilted in either a mesial or a lateral direction as they course through the inner layer (Smith et al., 2019a). The inner enamel portions of rods are arranged in rows and all of the rods in the same row have the same tilt. The rows in many cases alternate tilts sequentially across the thickness of the inner enamel (Moinichen et al., 1996). The outer enamel portions are usually smaller in diameter than the inner enamel portions and are angled at 20° in an incisal direction toward the outer surface relative to the horizontal boundary with the inner layer (Moinichen et al., 1996). The outer enamel portions of the rods all appear to travel parallel to each other as they traverse the outer enamel to terminate in the final layer at the enamel surface (Moinichen et al., 1996; Warshawsky & Smith, 1971; Figure 1).
FIGURE 1.
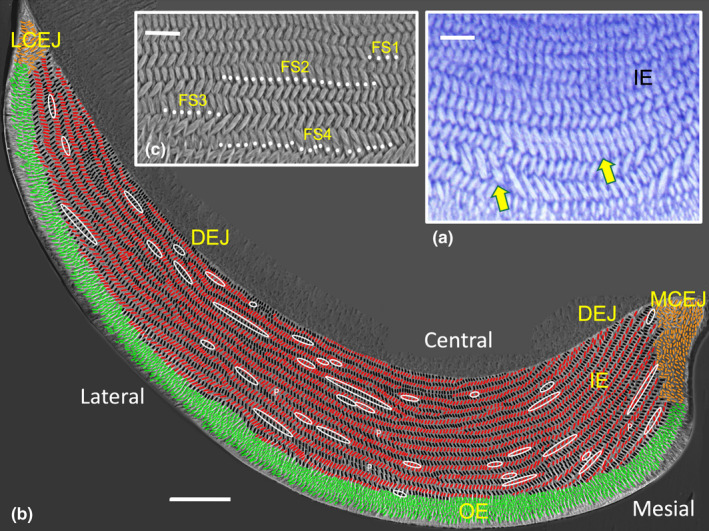
Transverse sections of mandibular mouse incisor enamel. (a) Light microscope image of decalcified enamel from the central region stained with toluidine blue showing a portion of inner enamel (IE) near its transition into outer enamel (OE, panel b). Two focal stacks, one short and another longer row nestled at the sides of longer rows having the same tilt, are indicated by the yellow arrows. (b) Backscatter electron microscope image of the whole enamel layer. Rows of sliced open rods in the IE layer having a mesial tilt are drawn in black and rows having a lateral tilt are drawn in red. Cut open rods forming the OE layer are drawn in green and the poorly organized and short enamel rods near the mesial and lateral cementoenamel junctions (MCEJ, LCEJ) are drawn in tan (see also Figure S5). The 38 focal stacks present in this section are circled in white (see also Figure S3). Focal stacks are sometimes difficult to distinguish from instances of row pairing (P), sites where two usually long rows having the same tilt lie adjacent to each other over short distances. (c) High power image from the lateral enamel region showing 4 focal stacks of various lengths in association with rows to which they are nestled. Bars in a and c = 10 µm; Bar in b = 50 µm. DEJ, dentinoenamel junction
The complexity of row arrangements within transverse sections of the inner enamel of mandibular mouse incisors was recently described in detail (Smith et al., 2019a). Among many unexpected results were findings that the length of rows, expressed as the number of rods per row (RPR), was exceedingly variable (2–233 RPR) and the tilt of sequential rows was often the same rather than alternating. The majority of rows (51%) were short in length and contained <21 RPR. Almost one half (43%) of two neighboring rows shared the same tilt across their entire lengths and an additional 29% of rows shared the same tilt at various focal sites along their lengths. Hence, while the rhythmic alternation of row tilts in transverse sections on a row‐to‐next‐row basis creates striking patterns, there is actually considerable pairing of row tilts in this enamel.
Arguably, the most surprising result in the previous study was the finding that in the short row category (2–20 RPR) the majority (56%) were arrayed as focal stacks, that is, short rows nestled at the side of a neighboring row and possessing the same tilt. A very small number of focal stacks (2%) were a little larger, up to 45 RPR in length, but arrayed no differently with a companion row than the shorter focal stacks versions. The remaining 44% of short rows exist in some other spatial arrangement most often as a short uniform row or as a short branching/merging row with alternating tilts between neighboring rows unlike the focal stacks that share the same tilt as the longer rows to which they are nestled. Focal stacks were observed at many locations throughout the inner enamel but showed greatest frequency within the lateral region. The relationship of focal stacks to enamel function is unclear. It was proposed that they may relate to the evolution of a uniserial pattern seen in modern rat and mouse incisor enamel from a multilayered ancestor (multiserial; multiple rows having the same tilt alternating with multiple rows having a different tilt; Smith et al., 2019a).
The objective of this study is to ascertain if current techniques in 2D spatial point pattern analyses can be applied to mouse incisor enamel to establish if the packing of rows across the thickness of the inner enamel is spatially random or shows clustering or some type of repeating pattern (Wiegand & Moloney, 2014). Knowledge of the spatial distribution characteristics of rows of enamel rods could provide new insights into how rows of ameloblasts initially form at the start of enamel formation. We chose for this study focal stacks because they are easy to identify by scanning electron microscopy (SEM) and are a simple grouping arrangement making them suitable for data reduction using the row midpoint to represent the spatial location of the whole row. Short rows are subject to potentially fewer distortions following coordinate manipulations that were necessary for this investigation. In order to do these analyses with minimal distortion errors, we developed software to “unbend” the curving DEJ surface seen in transverse sections thereby allowing more linear analyses to be done in virtual coordinate space. A model is presented of how focal stacks may extrapolate in 3D to their point of origins near the DEJ where a heterogeneous Poisson point process dictated spatial locations where short rows of ameloblasts would differentiate and start forming the focal stacks.
2. MATERIAL AND METHODS
2.1. Ethical compliance
All procedures involving the handling and treatment of 7‐week‐old C57BL/6 wild‐type mice were reviewed and approved by the IACUC committee at the University of Michigan (UCUCA).
2.2. Mandibular mouse incisor enamel preparations
Details regarding tissue fixation, the preparation of fully mineralized mandibular mouse incisors for transverse slicing at Level 8 (near the gingival margin) and processing of 1‐mm‐thick slices for embedding in plastics, polishing and etching, and imaging by backscatter scanning electron microscopy have been described in detail previously (Smith et al., 2019b). The methods used to create high resolution montage maps of the enamel layer, to obtain coordinate data and other quantitative information about enamel rod profiles using ImageJ (https://imagej.nih.gov/ij/), and the procedures employed for analyzing and classifying rows of enamel rods are also explained elsewhere (Smith et al., 2019a,b).
2.3. Software for virtual unbending of the DEJ
Virtual unbending of the curving DEJ in transverse sections was accomplished using software written in the python computer language (Figures S1A and S6). Briefly, for each of the random transverse slices cut at Level 8 from 24 different mandibular incisors from wild‐type mice, the curvilinear outline of the DEJ in the transverse section was traced in ImageJ and the x, y anatomical coordinates saved in one file. A second file contained information about enamel rods within the inner enamel obtained from ImageJ including enamel rod profile ID number, the direction of rod tilt (coded as BLACK for mesial tilt and RED for lateral tilt), the actual tilt angle in degrees of positive or negative elevation from the 3 o'clock position (Feret angle), the row number to which the enamel rod belonged, and the x and y coordinate position of the enamel rod in the section in anatomical coordinates. These two files for each transverse section was called into the python program where the x and y coordinates of the DEJ trace in the first file were spline‐interpolated to obtain an evenly sampled and smoothed DEJ extending from lateral CEJ (x 0) to the original y‐axis level of the mesial CEJ (x max; Figure S1B, 1400 in anatomical coordinates along the y‐axis). The distance (d) of each rod coordinate to the nearest point (j) on the interpolated DEJ was then calculated. The x‐coordinate of the rod position in unbent coordinates then become the cumulative distance of “j” along the interpolated DEJ as extended from the lateral CEJ towards the mesial CEJ. The y‐coordinate remained its distance “d” from the DEJ (Figures S1 and S2). The unbent data in anatomical coordinates were then converted into virtual coordinates by normalizing each transformed rod coordinate using maximum coordinate values (Vxub = x ( j )/x max; Vyub = d (j)/d max; V = virtual coordinate, x or y = x‐axis or y‐axis, ub = unbent coordinates; Figure S2). The focal stacks present within the inner enamel on each incisor were identified and represented as single points in 2D space by their row midpoints (Figure S3 one incisor; Figure 2 for all incisors).
FIGURE 2.
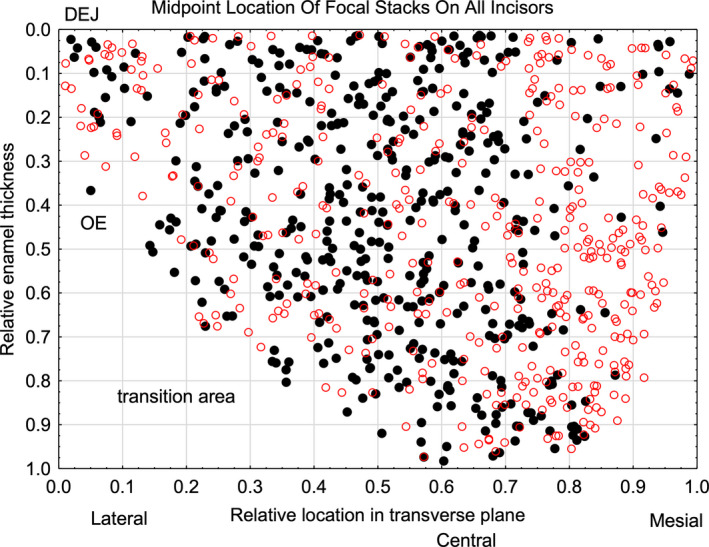
Scatter plot in unbent virtual coordinates of the midpoint locations of focal stacks found within inner enamel of 24 incisors (N = 869 total as 451 with mesial tilt [black] and 418 with lateral tilt [red]). The dentinoenamel junction (DEJ) is at top of the y‐axis and the transition area into outer enamel and then enamel surface is at the bottom of the y‐axis (see also Figure 1). There are some locations within the inner enamel layer where focal stacks having a mesial tilt (black) are frequently present (e.g., 0.4–0.5 on x‐axis) and other sites where focal stacks having a lateral tilt (red) predominate (e.g., 0.8–0.9 on x‐axis)
2.4. Software for quantifying 2D spatial distributions of focal stacks
Programita software, version 2014 for Windows (https://www.ufz.de/index.php?en=41413), was used for carrying out univariate and bivariate spatial point pattern analyses of focal stack row midpoints distributions relative to all focal stacks and their subdivision by row tilt including determination of the paired correlation function (g), the L‐function and the K2‐function (Dixon, 2013; Gimond, 2019; Perry et al., 2006; Szmyt, 2014; Velázquez et al., 2016; Wiegand & Moloney, 2014). Since focal stacks on average have short row lengths (7 ± 5 RPR), the midpoint of the focal stack row was used to represent the whole row to simplify analyses. This software was also used for Monte Carlos simulations of null models using 200 repetitions followed by goodness of fit estimates (Wiegand & Moloney, 2014). For the purposes of this investigation, the 878 focal stacks originally identified in 24 incisor samples (Smith et al., 2019a) were reevaluated and 9 of them were deleted from this spatial analyses as potential outliers leaving a total of 869 focal stacks processed in the final analyses. PAST software, version 3.26 for Windows (Hammer et al., 2001; https://folk.uio.no/ohammer/past/), was used for computing and plotting kernel density functions and to carry out various basic test for spatial randomness including minimal spanning trees and correlation length analyses (Cartwright et al., 2011). Statistica, version 13.3 for Windows (https://www.tibco.com/products/tibco‐statistica), was used for graphing and for conducting routine statistical analyses including standard t test, analysis of variance, and Z‐score tests for two population proportions. Explanations regarding the division of the inner enamel into three regions based on virtual coordinate partitioning along the x‐axis (Vxub) was given in a previous investigations (Smith et al., 2019a; Smith et al., 2019b). Specifically, the lateral region was defined as Vxub <0.6, the central region as Vxub = 0.6 to <0.7, and the mesial region as Vxub = 0.7–1.0.
3. RESULTS
3.1. Focal stack properties and their distributions within inner enamel
Focal stacks ranged in length from 2–45 RPR and were found at many different locations throughout the inner enamel (Smith et al., 2019a; Figures 1 and 2). They appeared mostly as short rows nestled at the sides of other usually much longer rows having the same rod tilt (730 of 869 focal stacks [84%] had 10 or less RPR; Figure 1). They were relatively easy to identify by SEM in transverse sections but less obvious in sagittal sections (e.g., Figure S4B) and in LM sections cut in either plane (Figure 1).
The number of focal stacks present in any given random transverse section varied widely from 24–48 per section but averaged 36 ± 7 focal stacks equally distributed by mesial and lateral rod tilts (Smith et al., 2019a). The global distribution of focal stacks across random transverse sections was not uniform (Figures 1, 2, 3, 4, 5). Focal stacks were found more frequently within the lateral half (Vxub, <0.6; 51%) and the inner half (Vyub, 0.0–0.5; 58%) of the inner enamel (Figures 3, 4, 5). In more specific terms, focal stacks were found most frequently in the lateral region (51% of all focal stacks) and the mesial region (32% of all focal stacks) compared to the central region (17% of all focal stacks; (Figure 3). These ratios were roughly proportional to the area occupied by each region (Figure 3). Focal stacks having a mesial tilt were encountered more frequently in the lateral region and central region whereas those having a lateral tilt were encountered at high frequency in the mesial region (Figures 3 and 4b). There was no correlation found between the length of focal stacks and their location across the transverse plane or across enamel thickness.
FIGURE 3.
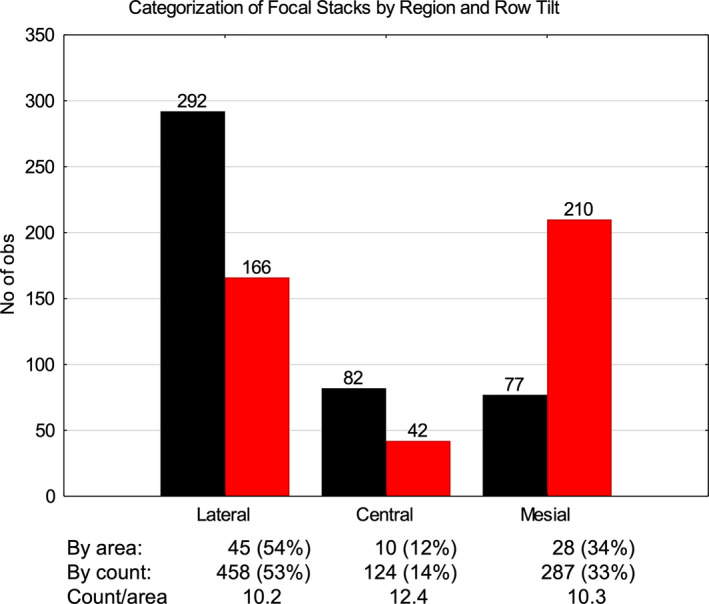
Histogram comparing the frequency of focal stacks by row tilt within the lateral, central, and mesial regions of the inner enamel (unbent virtual x‐axis coordinates 0.0 to <0.6, 0.6 to <0.7, 0.7–1.0 respectively). Focal stacks having a mesial tilt (black) are more frequently present in the central and lateral regions (x2) and those having a lateral tilt (red) predominate in the mesial region (x3). The total number of focal stacks in each region, however, correlates closely with the proportion of area each region occupies (count/area). Differences between regions for either tilt and differences by tilt within a given region are significant (p < 0.01). Differences for count/area are not significant
FIGURE 4.
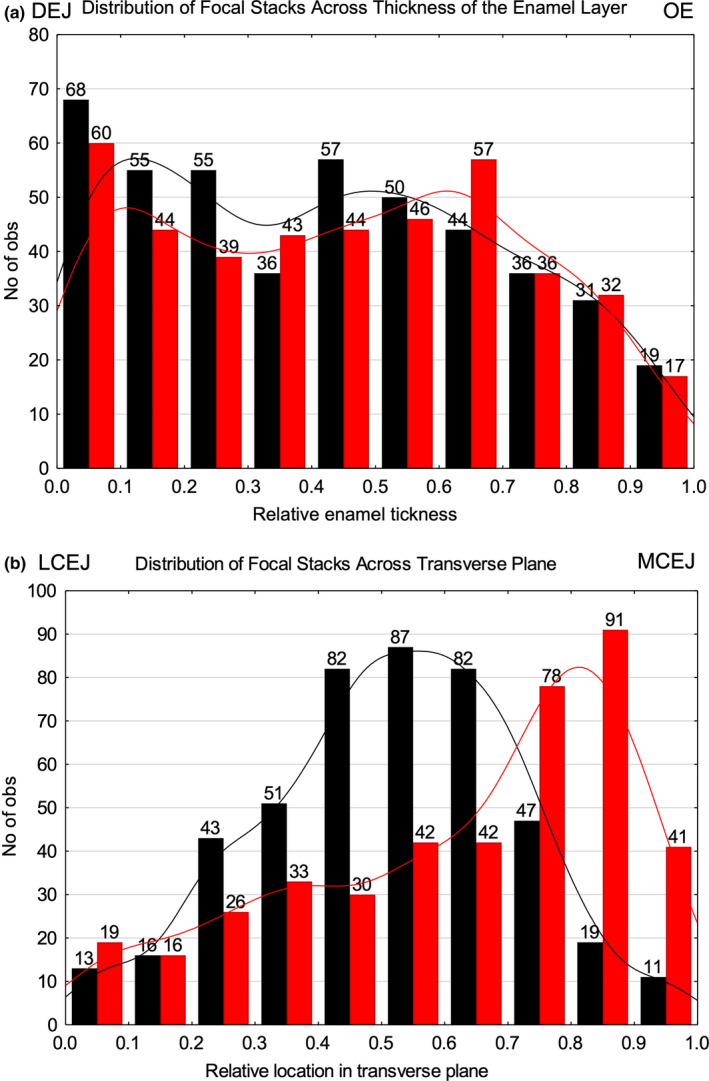
Histograms showing a breakdown in the frequency of focal stacks having a mesial (black) or lateral (red) tilt present in 10 subdivisions into which the inner enamel was divided across its the thickness (a) and width (b). Gaussian kernel density functions are fitted by row tilt in each histogram. On a uniform random basis, we would expect to observe about 44 focal stacks per tilt within each of 10 unit subdivisions of space. (a) The frequency of focal stacks pooled from 24 transverse sections varies across enamel thickness with maximum counts near the dentinoenamel junction (DEJ; subdivision 0.0–0.1) and minimum counts at the transition between inner enamel (IE) and outer enamel (OE; subdivision 0.9–1.0). Counts by tilt within each subdivision are not significantly different, whereas total counts per subdivision are significantly different comparing subdivisions 0.0–0.1 to 0.1–0.2, 0.6–0.7 to 0.7–0.8, and 0.8–0.9 to 0.9–1.0 (p < 0.05). (b) Extreme differences in focal stack counts by row tilt are evident across the transverse plane of inner enamel. The lowest counts are seen for both row tilts in two subdivisions near the lateral cementoenamel junction (LCEJ; 0.0–0.2) and for focal stacks having a mesial tilt in two subdivisions near the mesial cementoenamel junction (MCEJ; 0.8–1.0). Counts for focal stacks having a mesial tilt are significantly higher than those having a lateral tilt within subdivisions 0.3–0.7 and counts for focal stacks having a lateral tilt are significantly higher than those having a mesial tilt in subdivisions 0.7–1.0 (p < 0.05). Note in a and b that many of the total counts for a given tilt are in the expected range of 44 focal stacks per tilt but in b the peak counts are almost double the expected amounts from mid‐lateral to mesial side of the IE layer (0.4–1.0)
FIGURE 5.
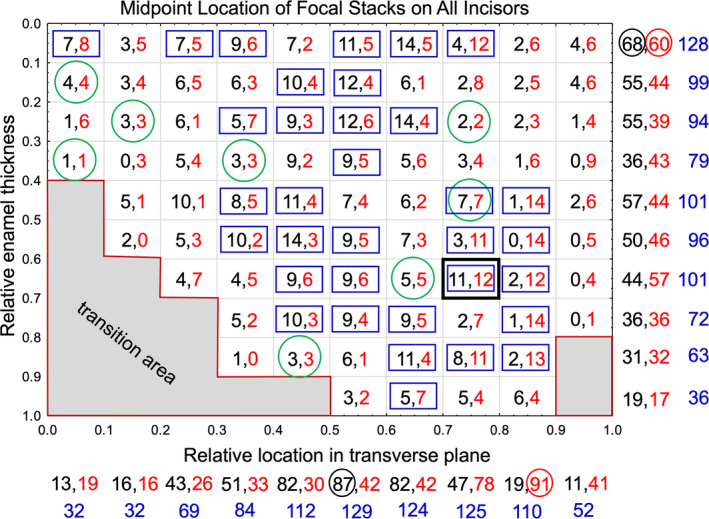
Graphic representation of results from counts of focal stack frequencies for each of the 83 unbent virtual coordinate subdivisions into which the inner enamel was partitioned. We would expect around five focal stacks of either tilt in each of the 83 subdivisions on a random uniform basis. While presented as squares for graphic purposes, each subdivision in the real world represents a rectangle 10 μm in height by 60 μm in width (see Figure 11). Each subdivision shows counts by tilt (mesial tilt in black and lateral tilt in red). The green circles indicate a few instances where counts for each tilt were equal while the blue squares indicate cases where the sum of counts was equal to or greater than half the total number of incisors examined (12–24 summed counts total). The numbers below the x‐axis and to the right side of the y‐axis show the summed counts for each tilt (summarized in Figure 4) followed by the total counts for all tilts (blue). The circled numbers are the highest number of counts found for focal stacks having a mesial or lateral tilt in the horizontal and vertical directions. This figure illustrates the trend for highly variable counts per tilt in a given subdivision and for a consistently higher frequency of focal stacks associated with the mid‐lateral and central regions for focal stacks having a mesial tilt and in the mesial region for focal stacks having a lateral tilt
A somewhat different impression of focal stack distributions was obtained when the inner enamel was partitioned into 0.1 or 0.2 units of unbent virtual coordinate space (Vxub, Vyub; Figures 5, 6, 7). For example, the inner enamel could be partitioned into 83 subdivisions representing 0.1 unit of unbent virtual coordinate space on each side (Figure 5; in real world terms, each subdivision is 10 µm tall by 60 µm wide). The number of focal stacks found in each of these subdivisions varied markedly from one instance in 24 incisors (4%, e.g., coordinates 0.9–1.0, 0.7–0.8) to as many as 23 instances of 24 incisors (96%, coordinates 0.7–0.8, 0.6–0.7; Figure 5, black box). The majority of subdivisions (49 of 83; 58%) had low focal stack counts of <12 instances out of 24 incisors, especially at the extreme lateral (Vxub = 0.0–0.2) and mesial (Vxub = 0.9–1.0) sides (Figure 5). It was very rare to have the same number of focal stacks by row tilt present within the same subdivision (8 of 83; 10%; Figure 5). The greatest number of focal stacks having a mesial tilt were located near or within the central region (Vxub, 0.4–0.6; 251 of 451 focal stacks with mesial tilt; 56%) while the greatest concentration of focal stacks having a lateral tilt were seen in the mesial region (Vxub, 0.7–0.9; 210 of 418; 50%; Figures 4b and 5). The greatest number of focal stacks in toto was found in a vertical strip of 10 subdivisions located to the lateral side of the central region (Vxub, 0.5–0.6; 129 total focal stacks from 24 incisor samples; Figures 4b and 5) and within a horizontal strip of 10 subdivisions abutting the DEJ (Vyub, 0.0–0.1; 128 total focal stacks from 24 incisor samples; Figures 4a and 5).
FIGURE 6.
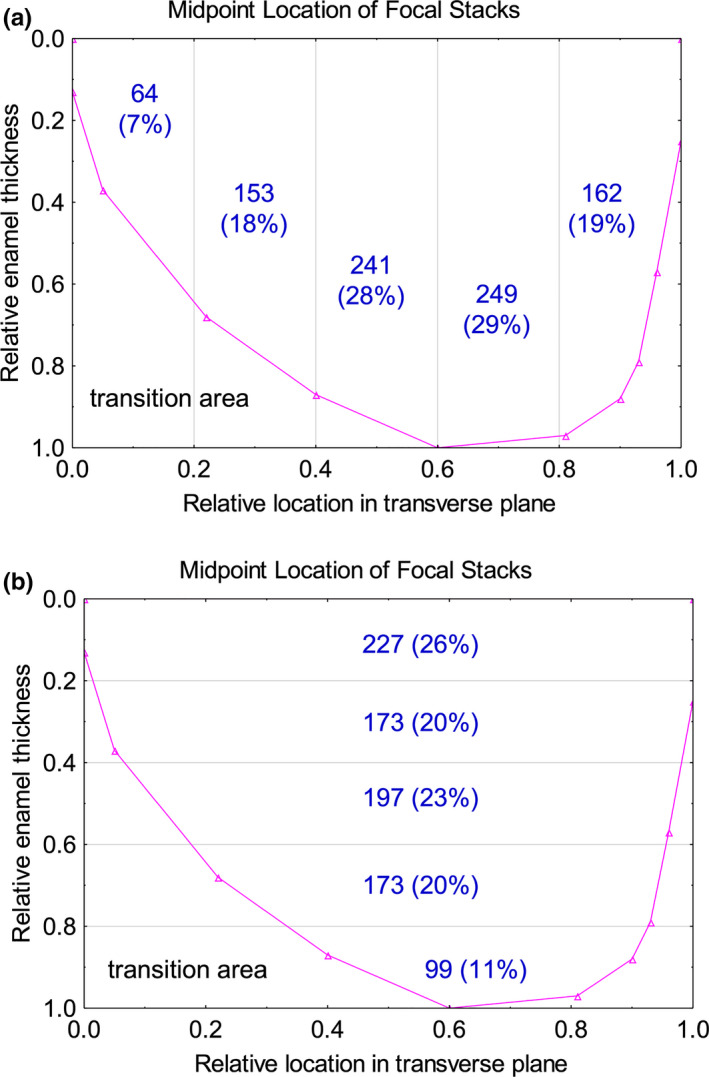
Graphic representation of summed counts for focal stacks in two subdivision steps across the transverse plane (a) and the thickness (b) of inner enamel. Pooled counts suggest a pattern in focal stack distributions not readily evident in histograms (Figure 4) or raw single subdivision counts (Figure 5). We would expect around 174 focal stacks on a random uniform basis in each of five subdivisions of inner enamel. (a) Within the transverse plane focal stacks are most often present in ±0.2 subdivisions of the central region (x‐axis, 0.4–0.6 and 0.6–0.8). A significantly lower (p < 0.05) but near random number of focal stacks are found in the next 0.2 subdivisions of the inner enamel (IE) layer in a lateral (0.2–0.4) and mesial (0.8–1.0) direction, and a 2.4‐fold and significantly lower number of focal stacks are found within the thinnest part of the IE at the lateral side (0.0–0.2; p < 0.05 compared to 0.2–0.4). (b) The frequency of focal stacks is similar and near random across most of the thickness of the inner enamel (y‐axis, 0.2–0.8) but their frequency is significantly higher near the dentinoenamel junction (0.0–0.2) and lowest approaching the outer enamel (0.8–1.0; p < 0.05 for both)
FIGURE 7.
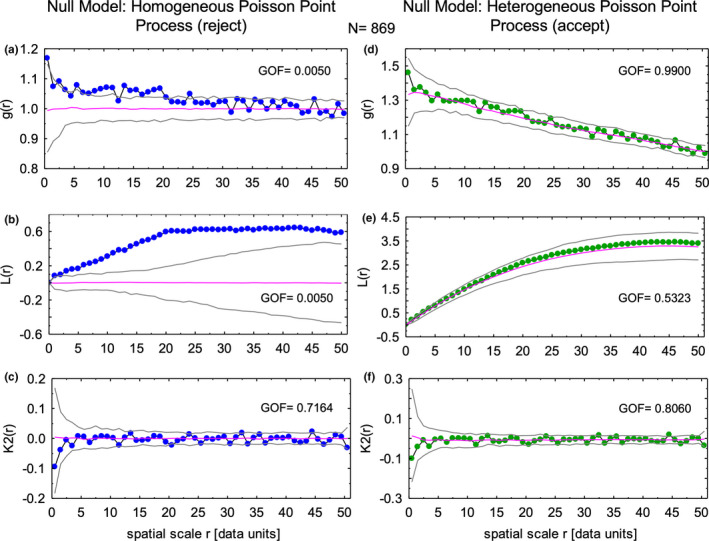
Spatial distribution of all focal stacks within inner enamel irrespective of row tilt. Spatial point distribution analyses of the locations of midpoints of focal stacks using the Programita software package indicates that the paired correlation function g(r) (a) and L functions (b) for focal stack distributions do not fit a null model based on a homogeneous Poisson point process (corrected for irregular shape area and edge effects), but they show a good fit to a null mode based on a heterogeneous Poisson point process (d,e). The K2 function for focal stacks fit well to both null models (c,f) suggestive that clustering of points indicated by experiment curves positioned above the magenta line at 1.0 and 0.0 for the g(r) function (a) and the L function (b) were caused by minor irregularities in the distribution of focal stacks rather than true clustering of focal stack locations
Partitioning of the inner enamel vertically into 0.2 units of unbent virtual coordinate space revealed that roughly half of all focal stacks (57%) were located within ±0.2 relative units of the central labial region across the transverse plane (Vxub, 0.4–0.8; Figure 6a). An additional 37% of focal stacks were found within the next ±0.2 relative units on the lateral (Vxub, 0.2–0.4) and mesial (Vxub, 0.8–1.0) sides of the central region with the final 7% of focal stacks located near the lateral CEJ (Vxub, 0.0–0.2; Figure 6a). When tallied horizontally in 0.2 units of unbent virtual coordinate space, focal stacks were distributed into roughly similar area‐adjusted frequencies across the thickness of the inner enamel as expected in 3D terms in random sections if focal stacks extended from the DEJ to the outer enamel like all other rows of enamel rods (Smith et al., 2019a,b; Figure 6b).
3.2. Spatial point pattern analyses: univariate distributions
3.2.1. PAST software
Nearest neighbor analyses of the midpoint locations of all focal stacks identified in 24 pooled incisor samples indicated that they could be randomly distributed as a Poisson process across the inner enamel as compared to randomly distributed points in an area of similar size (p = 0.70098, N = 869). However, minimal spanning tree analyses indicated that these distances were much shorter than expected for a spatially random distribution suggestive that there was a preference to certain sites where focal stacks were located (p = 0.001, N = 869). This was supported by a Ripley's K plot using the L(d)‐d function which yielded a curve for focal stacks situated well above the expected 95% confidence interval for random point distributions. Correlation length analyses also indicated that the midpoint locations of focal stacks were likely not randomly distributed spatially (p = 0.001, N = 869).
3.2.2. Programita software
More detailed spatial modeling revealed that the sites where focal stacks were observed in 24 pooled incisor samples did not follow a spatially random distribution but were best modeled as a heterogeneous Poisson point process (Figure 7; compare a–c to d–f). That is, there were sites within the enamel layer both transversely from lateral to mesial sides and across the thickness of the inner enamel where focal stacks were found more frequently. Of interest was the K2(r) function for all focal stacks (N = 869) which was similar when modeled either as a homogeneous Poisson point process (p = 0.9150) or as a heterogeneous Poisson point process (p = 0.8700; Figure 7c,f). This indicated that clustering suggested by the pair correlation function (g(r)) and especially the L(r) function for spatial scale r values greater than two was mild relative to the overall distribution of focal stacks (Figure 7a,b). The heterogeneous nature of focal stack distributions applied equally to both rod tilts, with focal stacks having a lateral tilt showing a somewhat better goodness of fit to the heterogeneous Poisson point process null model (p = 0.9602, N = 418) than those having a mesial tilt (p = 0.4826, N = 451) when modeled individually (Figure 8). As expected from previous descriptions of unit grid counts (Figures 4d and 5), the intensity function for focal stacks having a mesial tilt was highest at x‐axis position 0.4–0.7 in unbent virtual coordinate space within the inner and middle part of the inner enamel (Figure 8a, red color kernel density map). The intensity function for focal stacks having a lateral tilt was highest at x‐axis position 0.8–0.9 in unbent virtual coordinate space toward the outer part of the inner enamel (Figure 8b, red color in kernel density map).
FIGURE 8.
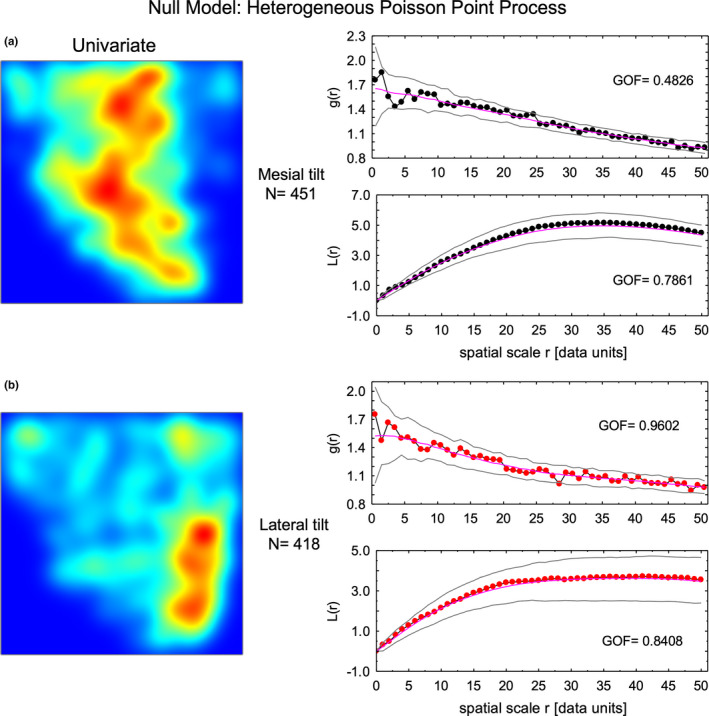
Spatial distribution of focal stacks by row tilt. The null model for a heterogeneous Poisson point process involves calculating a kernel density map (intensity function) for the point distributions which are very different for focal stacks having a mesial tilt (a, left side color map) versus those having a lateral tilt (b, left side color map). In both cases, the resultant g(r) and L function calculations show an acceptable univariate goodness of fit for focal stacks having a mesial tilt (a, graphs at right side) and especially for those having a lateral tilt (b, graphs at right side)
3.3. Spatial point pattern analyses: bivariate distributions
Bivariate analyses (spatial relationships between mesial and lateral tilts) indicated that when the midpoints of focal stacks having one tilt were randomly distributed around the midpoints of focal stacks having the opposite tilt there was no correlation when the intensity function for the fixed tilt was used for modeling (Figures 9B1, B2 and 10B1,B2) but a high goodness of fit when the intensity function for the tilt being moved was substituted in the modeling (Figures 9C1,C2 and 10C1,C2). An acceptable goodness of fit was also obtained when a toroidal shift null model was carried out separately for each row tilt (Figures 9D1,D2 and 10D1,D2). These results were consistent with the conclusion that the distribution of focal stacks having a mesial tilt is independent of focal stacks having a lateral tilt, one of the essential requirements for a heterogeneous Poisson point process.
FIGURE 9.
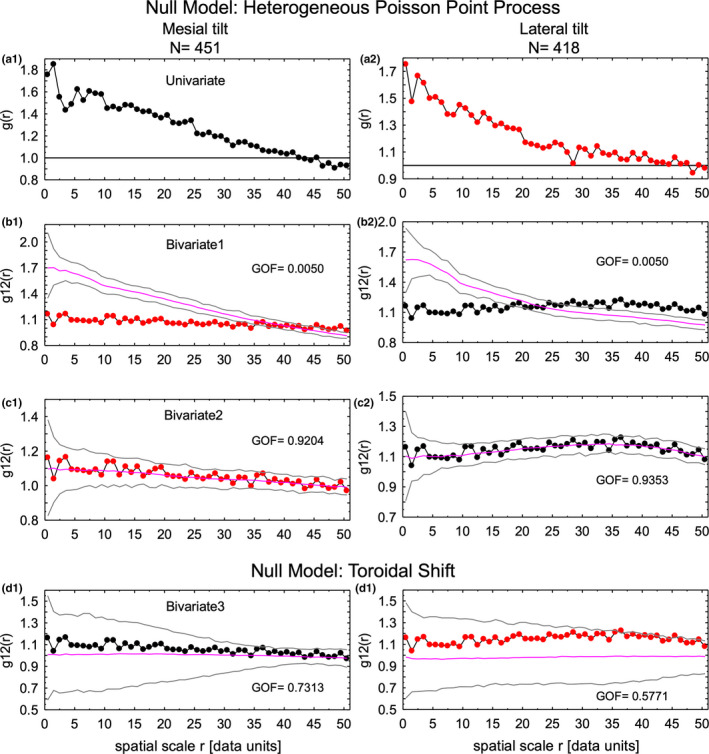
Spatial distribution of focal stacks having a mesial tilt as compared to those having a lateral tilt (bivariate distributions) using the paired correlation function (g(r), g12(r)). In a1 and a2, the univariate g(r) function generated for the raw point distributions for focal stacks having a mesial (black) and lateral (red) tilt (Figure 2) are presented for reference (see Figure 8). When the point distribution in unbent virtual coordinate space for one tilt was kept fixed and the same number of points from the opposite tilt were randomly plotted around the fixed point using a heterogeneous Poisson point process null model with intensity function dictated by the fixed points, no bivariate fit was obtained for the moved points (b1, lateral tilt move around fixed mesial tilt locations with mesial intensity function; b2, mesial tilt moved around fixed lateral tilt locations with lateral intensity function). However, if the intensity function for the points being moved was substituted in the calculation then a good bivariate fit was obtained (c1, lateral tilt move around fixed mesial tilt locations with lateral intensity function; c2, mesial tilt moved around fixed lateral tilt locations with mesial intensity function). These results suggest that focal stacks having a mesial tilt are independently distributed from those having a lateral tilt and vice versa. This was supported by running null models based on toroidal shift of points (Wiegand & Moloney, 2014) for each tilt type which showed acceptable bivariate fit (d1, mesial tilt; d2, lateral tilt). The results in d1 and d2 illustrate well that the distribution of focal stacks having a mesial tilt (d1) are different from focal stacks having a lateral tilt (d2)
FIGURE 10.
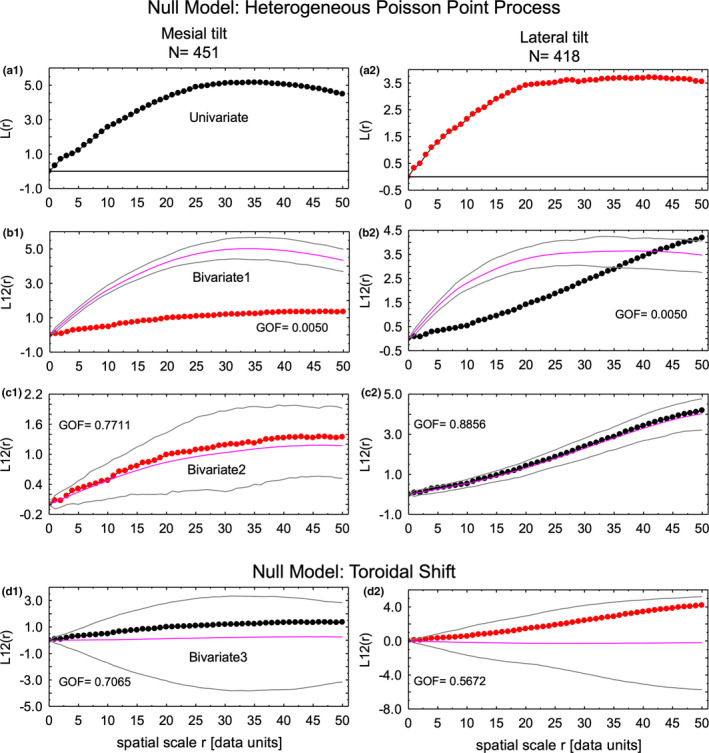
Spatial distribution of focal stacks having a mesial tilt as compared to those having a lateral tilt (bivariate distributions) using the L function [L(r), L12(r)]. The same results were obtaining as in Figure 9 with the exception that the L12 curves better revealed differences in spatial distribution of focal stacks having a mesial tilt versus those having a lateral tilt (b1, b2); a1, a2, univariate curves for reference to the tilt having fixed points; b1, b2, the intensity function for the fixed points is used for the calculations; c1, c2, the intensity function for the points being moved are used in the calculations; d1, d2, results from the toroidal shift null model indicating that focal stacks having a mesial tilt are distributed independently of focal stacks having a lateral tilt
4. DISCUSSION
This investigation to the knowledge of the authors is among the first to use standard techniques in spatial point pattern analyses (Wiegand & Moloney, 2014) to investigate how one type of short row grouping of enamel rods are spatially distributed in mouse incisor enamel. The results clearly show that the row arrangement classified as focal stacks possesses some elements of randomness to the manner in which they are spatially distributed, but there is also a strong tendency for focal stacks to be found at specific regional sites within the transverse plane of the enamel layer, specifically to a zone within and extending slightly to the lateral and mesial sides of the central region (0.4–0.8 in Figure 6a). Focal stacks having a mesial tilt in this location are enriched laterally and those having a lateral tilt are more numerous mesially relative to the central region. We do not have any good explanation at this time as to the reason(s) for this enrichment by row tilt, but we suspect it could be related to the fact that during early development row formation spreads as a wave along the DEJ along a C‐shaped curve outwards from the central region (0.6–0.7) in a lateral and mesial direction (Smith & Warshawsky, 1976). There could be structural reasons for needing initial enrichment of rows of enamel rods pointing mesially along the lateral arm and rows pointing laterally along the mesial arm of this curve.
The results of this study provide a good example of the many challenges associated with trying to understand and explain how enamel rods in rodent incisors develop and are organized spatially particularly when extrapolating rod positions seen in transverse sections to their possible starting locations near the DEJ in the sagittal (longitudinal) plane (Figures 11 and 12; Figures S4 and S5). Focal stacks with their short row lengths represent a simple grouping arrangement (Smith et al., 2019a), yet as data in this study revealed their distribution within the inner enamel, their relationships to longer companion rows to which they are paired and the locations near the DEJ where the innermost part of the rods begin are clearly complex problems to explain and visualize. The finding that focal stacks in transverse sections follow a spatial distribution pattern consistent with their development by a heterogeneous Poisson point process further complicates matters. There are many examples of heterogeneous Poisson processes associated with nonbiological events (e.g., train arrival times, fractures in rocks, frequency of earthquakes) but only a limited number of biological systems described to date where Poisson processes have been shown to have developmental implications (Colomb et al., 2019; Mattfeldt, 2005; Summers et al., 2015; Szmyt, 2014; Wiegand & Moloney, 2014).
FIGURE 11.
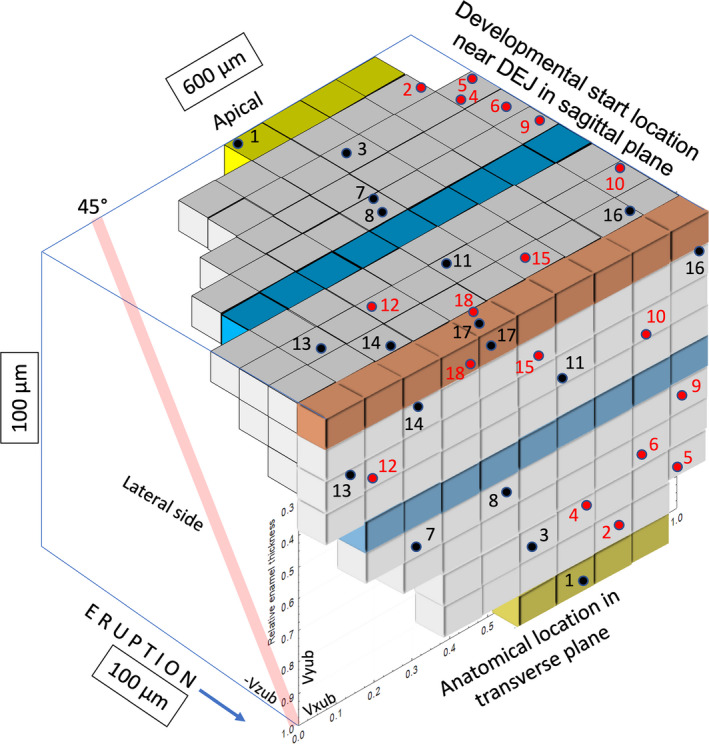
3D extrapolation into unbent virtual coordinate space putting in perspective how enamel rods forming the inner enamel seen in any single transverse section of mouse incisor enamel (front plane of cube) might reflect more apically into the sagittal eruptive plane. The inner enamel is shown in 3 arbitrary color strips to aid visualization (brown, adjacent to dentinoenamel junction [DEJ]; blue, halfway across inner enamel; yellow, thickest part of the inner enamel before outer enamel begins). The black and red circles indicate the midpoints of 18 arbitrarily selected focal stacks shown in Figure S3. These are reflected apically into the sagittal plane to show their presumed starting location near the DEJ based on their measured sectional tilt angle and the general assumption that all enamel rods passing through the inner enamel are angled incisally at about 45° to the DEJ (Moinichen et al., 1996) in transit to outer enamel (illustrated by the red cylinder at the lateral side). Note that the 3D tilt direction for some focal stacks seen in the transverse plane of the cube having a mesial tilt (black dots) when reflected in an apical direction sometimes run counter to their observed 2D tilt direction (e.g., focal stacks 7 and 13). Unbent virtual coordinates are shown in lower left front face of the cube. Subdivisions forming the cube represent 60 µm width (Vxub) by 10 µm height (Vyub) by −10 µm depth (−Vzub)
FIGURE 12.
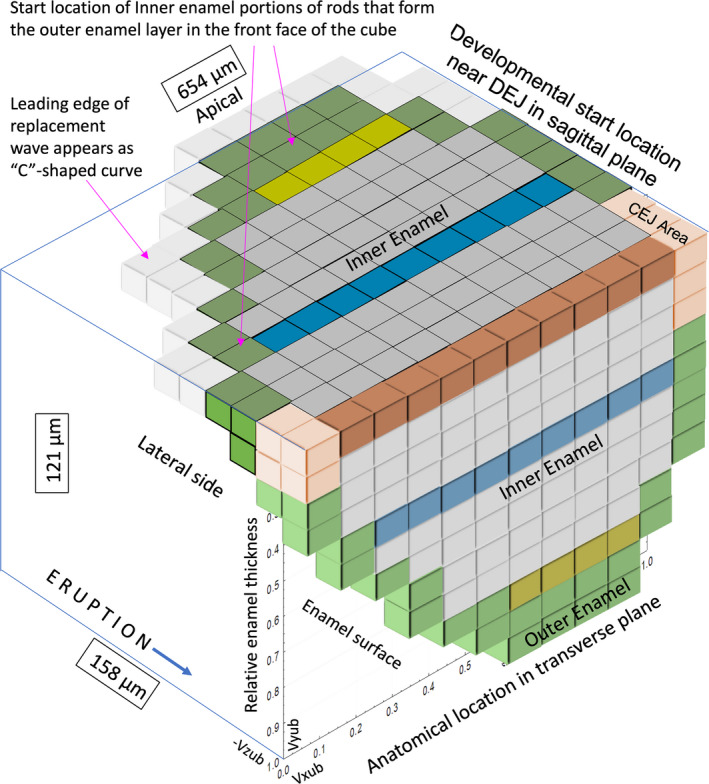
3D extrapolation into unbent virtual coordinate space putting in perspective all enamel rods seen in a single transverse section (front plane of cube; see Figure 1; Figure S5) and how they may reflect apically into the sagittal eruptive plane. The inner enamel is duplicated in the same color scheme from Figure 11, the outer enamel is illustrated in green, and the peculiar enamel rods near the mesial and lateral cementoenamel junction areas are shown in tan as in Figure 1b. The top of the cube shows the developmental relationships for the enamel rods seen at the front of the cube keeping in mind that when the outer enamel portions of rods shown in green reflect apically they become part of posteriorly positioned inner enamel (all bins near the dentinoenamel junction [DEJ] in the sagittal plane would be the start position of enamel rods forming first the inner enamel (IE) followed by the outer enamel (OE). Taking into account the “extra” bins related to the OE in a typical transverse section, this figure predicts that there are probably a total of 45 focal stacks per renewal block during enamel development (36 on average for IE layer seen a transverse section plus 8 more for the enamel rods seen as the OE layer in the same section when reflected apically). This figure also illustrates the origin of the “C”‐shaped curve along which development occurs during the secretory stage when the enamel rods are formed (Smith & Warshawsky, 1976). The enamel rods illustrated in the tan bins do not form rows and are poorly defined. Unbent virtual coordinates are shown in lower left front face of the cube. Subdivisions forming the cube represent 55 µm width (Vxub) by 10 µm height (Vyub) by −13 µm depth (−Vzub)
We did not investigate in this study the spatial distribution of fixed objects like trees that are rooted to one specific and unmovable location in 3D space (Wiegand & Moloney, 2014). Focal stacks are suspected like all rows of enamel rods to originate at one location near the DEJ and travel through space along with the row of rods to which they are associated to another location in 3D space that is positioned more forward (incisal) and more sideways (in a mesial or a lateral direction) from their point of origin (Figure 11; Figure S4; Smith et al., 2019a,b). Our basic assumption is that, from a formative standpoint, the short length focal stacks are “preassigned” to a longer companion row sometime during ameloblast differentiation (see figure 7 in Smith et al., 2019a). These locations are developmental events apparently defined by a heterogeneous Poisson point process (Figures 7 and 8), the nature of which remains to be identified (Figures 11 and 12). The ameloblasts then create the enamel rods for the focal stack as they move away from the DEJ in tandem with the ameloblasts manufacturing the enamel rods in the companion row having the same tilt to which the focal stack is paired (Figure S4). Random sections cut through the enamel layer in the transverse plane therefore show focal stacks located at various distances away from the DEJ as well as at various sites from lateral to mesial sides across the transverse plane of the enamel layer (Figure 2). Most existing spatial analysis software packages do not easily take these spatial factors into account. If focal stacks travel continuously as postulated from near the DEJ to the outer enamel angled incsally at 45° (Moinichen et al., 1996) then we expect on a random sampling basis that a fairly similar number of slices through focal stacks would be encountered at equally stepped intervals across enamel thickness (Figure 11; Figure S4B). Although our data were a little noisy, this is essentially what we observed as validated in Figures 4a, 5 and 6b.
The distribution of focal stacks across the transverse plane is more complicated to explain in part because of the opposing mesial and lateral tilts of the rows, which cause a sideways diversion between the origin of rods near the DEJ and their point of transition into outer enamel (Figure 11; Figures S4A and S6; see figure 8 in Smith et al., 2019a). There is also the problem that enamel rod development in this plane does not start from one side (e.g., mesial) and spread progressively toward the opposite side (e.g., lateral). Instead, enamel rod and row development starts in the central region (equivalent to a cusp tip; Simmer et al., 2010) and then splits into two developmental fronts, one that spreads in a mesial direction to end at the mesial CEJ and another that spreads in a lateral direction and continues for twice the length of time as the mesial front to end at the lateral CEJ (Smith et al., 2019b). This creates a curving “C”‐shaped developmental front that makes comparisons across the transverse plane curvilinear as opposed to more linear comparisons that can be made in the sagittal plane (Figure 12; Smith & Warshawsky, 1976).
It should be noted that initial studies for this investigation were carried out using virtual anatomical coordinates along a curving DEJ for investigating the spatial distribution of focal stacks in the inner enamel. Although it was obvious that reflections of the midpoint locations of focal stacks to the x‐axis was distorted by a length compression effect especially at the extreme lateral and mesial sides of the inner enamel (Figure S1), the analysis of these data by the Programita software gave exactly the same results as we present in Figures 7, 8, 9, 10 for unbent virtual coordinates. This includes the observations that the spatial distribution of the midpoints of focal stacks in the transverse plane best fit a heterogeneous Poisson point process (Figure S7), that the intensity function for focal stacks having a mesial tilt is different from those having a lateral tilt with the former positioned more laterally and the latter more mesially (Figure 8), and that distributions of focal stacks having either tilt were independent of each other (Figures 9 and 10). What was different in the case of using virtual anatomical coordinates was that the goodness of fit of curves to the Monte Carlo simulated boundaries of the null models was much lower than what was obtained using unbent virtual coordinates (cleaner data). Independence in spatial distribution of points/events is one of the essential requirements for a Poisson point process (Wiegand & Moloney, 2014).
The manner in which a heterogeneous Poisson point process might operate to create a spatial distribution of focal stacks identified in this investigation cannot be defined with any certainty at this time due to a lack of critical information about several key events/processes occurring in mandibular mouse incisors. One is the rate of eruption in mandibular mouse incisors where there has been a surprisingly wide range of estimates from as little as 108 µm/day to as much as 400 µm/day (Hu et al., 2008; Hwang & Tonna, 1965; Notes, 2003). An accurate determination of the rate of eruption is needed in order to calculate the amount of time required to create one unit subdivision in unbent virtual coordinate space within the sagittal plane (Figures 11 and 12; −Vzub axis). Part of the problem seems to relate to a decrease in the rate of eruption with age in mandibular mouse incisors (Hwang & Tonna, 1965; Popova et al., 2007). There are also variations in eruption rate that can be caused by differences in the hardness of diet consumed by the rodents (Burn‐Murdoch, 1993; Ness, 1965; Taylor & Butcher, 1951). The most commonly cited value for rate of eruption in mandibular mouse incisors is 244–255 µm/day (Meyer et al., 1951).
A second problem is the presently unknown rate at which the wave of differentiation for ameloblasts (ameloblast extension rate, Shellis, 1998) spreads mesially and laterally from the first induction event occurring in the central region at the start of each new renewal cycle (Figures 11 and 12; figure 10 in Smith et al., 2019b). This is important because the same spatial sequence of development will occur when ameloblasts complete their differentiation and begin secreting enamel (Häkkinen et al., 2019; Simmer et al., 2010). The first inductive event for focal stacks per renewal cycle in unbent virtual coordinate space for inner enamel presumably occurs in one of the yellow boxes as illustrated in Figure 11 when considering renewal in just inner enamel, or one of the most apical green boxes shown in Figure 12 when considering renewal of the entire enamel layer. A further unknown factor is whether ameloblast extension moves at a constant rate into and through the mesial and lateral regions or if there are differences in this rate when traveling in either or both of these directions.
A third problem in trying to model a Poisson point process in this system is closely related to the ameloblast extension rate. This is the duration of ameloblast extension, which is the amount of time required for the wave of ameloblast differentiation to reach the mesial and lateral cementoenamel junctions where differentiation ceases for a single renewal cycle (Simmer et al., 2010; Smith & Warshawsky, 1976). This value is needed in order to calculate the amount of time required to create one unit subdivision in unbent virtual coordinate space in the transverse plane (Figures 11 and 12, Vxub axis). We are unaware of any estimates for this duration in the published literature for mandibular mouse incisors.
The fourth and final problem that needs clarification is the rate of appositional growth of the enamel layer in mandibular mouse incisors, previously defined as the spreading rate of appositional termination (Simmer et al., 2010). This value is needed in order to calculate the amount of time required to create one unit subdivision in unbent virtual coordinate space in the vertical plane (Figures 11 and 12, Vyub axis). The best estimate for timing across the secretory stage in mandibular mouse incisors was given by Hwang and Tonna (1965). They reported that the migrating front of labeled ameloblasts reaches the beginning of the secretory by 1 day after injection of thymidine labelling and appears 9 days later in early maturation. Enamel layer thickness in the central region in 7‐week‐old mice on average is 121 ± 2.7 µm in transverse sections (Smith et al., 2019b), suggestive of an appositional growth rate of 13.4 µm/day (121/9). This is remarkably similar to the appositional growth rate for enamel in the mandibular incisors of 100 g rats (Smith & Nanci, 1996). Assuming the appositional growth rate is linear over time, these data predict that the inner enamel layer which comprises 83% of the total enamel thickness in mandibular mouse incisors (Smith et al., 2019b) would be formed in 7.5 days.
In summary, the results of this study indicate that in any random transverse section of inner enamel from the mandibular incisors of 7‐week‐old mice will contain on average 36 ± 7 focal stacks, half of which will have a mesial tilt and the other half will have a lateral tilt (see Figure S3). Roughly 10 of the focal stacks having a mesial tilt will be found between a mid‐lateral and a mid‐mesial regional location (0.4–0.7) whereas nine of the focal stacks having a lateral tilt will be found within the mesial region (0.7–1.0). Five focal stacks having a mesial tilt will be present in the extreme lateral side (0.0–0.4) and three additional focal stacks with a mesial tilt will be found in the mesial region (0.7–1.0). Seven focal stacks having a lateral tilt will be seen in lateral region (0.0–0.6) and 2 will be found in central region (0.6–0.7). Focal stacks irrespective of tilt can be found anywhere across the thickness of the inner enamel. This spatial distribution pattern for focal stacks originates during early development by an as yet to be defined heterogeneous Poisson point process that dictates sites where short rows of ameloblasts will start forming focal stacks in tandem with longer companion rows sharing the same rod tilt.
CONFLICT OF INTEREST
The authors declare no conflict of interest.
AUTHOR CONTRIBUTIONS
This study was designed principally by C.E.S. with contributions by J.P.S. and J.C‐C.H. The incisors were prepared, sectioned, polished, and BEI‐imaged by Y.H. Growth and mating of mice was overseen by J.C‐C.H. Software for unbending the DEJ was created by M.S. Data analysis and preparation of the first draft of the manuscript and figures was done by C.E.S. The figures were modified by J.P.S. The manuscript was critically reviewed by M.S., J.C‐C.H., and J.P.S.
Supporting information
Figures S1‐S6
ACKNOWLEDGMENT
This study was supported by NIDCR/NIH grant 1R01DE015846 (J.C‐C.H.) and 1R01DE027675 (JPS).
Smith CE, Hu Y, Strauss M, Hu JC, Simmer JP. The spatial distribution of focal stacks within the inner enamel layer of mandibular mouse incisors. J Anat.2021;238:970–985. 10.1111/joa.13352
DATA AVAILABILITY STATEMENT
The locations for the 869 focal stacks described in this paper can be obtained in anatomical or unbent coordinates if desired by request to the first author. The python language program for converting anatomical to unbent coordinates is given in Supporting Information (Figure S6).
REFERENCES
- Boyde, A. (1989) Enamel. In: Oksche, A. & Vollrath, L. (Eds.) Handbook of microscopic anatomy: teeth. Berlin, Heidelberg: Springer‐Verlag, pp. 309–473. [Google Scholar]
- Burn‐Murdoch, R.A. (1993) The effect of the consistency of the diet on eruption rates and lengths of incisor teeth in rats. Archives of Oral Biology, 38, 699–706. [DOI] [PubMed] [Google Scholar]
- Cartwright, A. , Moss, J. & Cartwright, J. (2011) New statistical methods for investigating submarine pockmarks. Computers & Geosciences, 37, 1595–1601. [Google Scholar]
- Colomb, W. , Osmond, M. , Durfee, C. , Krebs, M.D. & Sarkar, S.K. (2019) Quantification of cellular distribution as Poisson process in 3D matrix using a multiview light‐sheet microscope. Microscopy and Microanalysis, 25, 753–761. [DOI] [PubMed] [Google Scholar]
- Dixon, P.M. (2013) Ripley's K function. Encyclopedia of Environmetrics, 3, 1796–1803. [Google Scholar]
- Gimond, M. (2019) Intro to GIS and spatial analysis. Colby College. Available at: https://mgimond.github.io/Spatial/introGIS.html#whats‐in‐an‐acronym. Accessed June 20, 2020. [Google Scholar]
- Habelitz, S. (2015) Materials engineering by ameloblasts. Journal of Dental Research, 94, 759–767. [DOI] [PMC free article] [PubMed] [Google Scholar]
- Häkkinen, T.J. , Sova, S.S. , Corfe, I.J. , Tjäderhane, L. , Hannukainen, A. & Jernvall, J. (2019) Modeling enamel matrix secretion in mammalian teeth. PLoS Computational Biology, 15, e1007058. [DOI] [PMC free article] [PubMed] [Google Scholar]
- Hammer, H.D.A.T. , Harper, D.A.T. & Ryan, P.D. (2001) PAST: Paleontological statistics software package for education and data analysis. Palaeontologia Electronica, 4, 1–9. [Google Scholar]
- Hu, J.C. , Hu, Y. , Smith, C.E. , McKee, M.D. , Wright, J.T. , Yamakoshi, Y. et al. (2008) Enamel defects and ameloblast‐specific expression in Enam knock‐out/lacz knock‐in mice. Journal of Biological Chemistry, 283, 10858–10871. [DOI] [PMC free article] [PubMed] [Google Scholar]
- Hwang, W.S. & Tonna, E.A. (1965) Autoradiographic analysis of labeling indices and migration rates of cellular component of mouse incisors using tritiated thymidine (H3tdr). Journal of Dental Research, 44, 42–53. [DOI] [PubMed] [Google Scholar]
- Koenigswald, W.V. & Clemens, W.A. (1992) Levels of complexity in the microstructure of mammalian enamel and their application in studies of systematics. Scanning Microscopy, 6, 195–217; discussion 217–218. [PubMed] [Google Scholar]
- Line, S.R.P. & Novaes, P.D. (2005) The development and evolution of mammalian enamel: structural and functional aspects. Brazilian Journal of Morphological Sciences, 22, 67–72. [Google Scholar]
- Martin, T. (1999) Evolution of incisor enamel microstructure in Theridomyidae (Rodentia). Journal of Vertebrate Paleontology, 19, 550–565. [Google Scholar]
- Mattfeldt, T. (2005) Explorative statistical analysis of planar point processes in microscopy. Journal of Microscopy, 220, 131–139. [DOI] [PubMed] [Google Scholar]
- Meyer, J. , Henry, J.L. & Weinmann, J.P. (1951) The effect of 8‐azaguanine on physiologic growth measured by the rate of eruption of the incisor of the mouse. Cancer Research, 11, 437–441. [PubMed] [Google Scholar]
- Moinichen, C.B. , Lyngstadaas, S.P. & Risnes, S. (1996) Morphological characteristics of mouse incisor enamel. Journal of Anatomy, 189, 325–333. [PMC free article] [PubMed] [Google Scholar]
- Ness, A.R. (1965) Eruption rates of impeded and unimpeded mandibular incisors of the adult laboratory mouse. Archives of Oral Biology, 10, 439–451. [DOI] [PubMed] [Google Scholar]
- Notes, J. (2003) Malocclusion in the laboratory mouse. The Jackson Laboratory. Available at: https://www.jax.org/news‐and‐insights/2003/april/malocclusion‐in‐the‐laboratory‐mouse. Accessed July 2, 2020. [Google Scholar]
- Perry, G. , Miller, B.P. & Enright, N.J. (2006) A comparison of some methods for the statistical analysis of spatial point patterns in plant ecology. Plant Ecology, 187, 59–82. [Google Scholar]
- Popova, S.N. , Barczyk, M. , Tiger, C.F. , Beertsen, W. , Zigrino, P. , Aszodi, A. et al. (2007) Alpha11 beta1 integrin‐dependent regulation of periodontal ligament function in the erupting mouse incisor. Molecular and Cellular Biology, 27, 4306–4316. [DOI] [PMC free article] [PubMed] [Google Scholar]
- Shellis, R.P. (1998) Utilization of periodic markings in enamel to obtain information on tooth growth. Journal of Human Evolution, 35, 387–400. [DOI] [PubMed] [Google Scholar]
- Simmer, J.P. , Papagerakis, P. , Smith, C.E. , Fisher, D.C. , Rountrey, A.N. , Zheng, L. et al. (2010) Regulation of dental enamel shape and hardness. Journal of Dental Research, 89, 1024–1038. [DOI] [PMC free article] [PubMed] [Google Scholar]
- Smith, C.E. , Hu, Y. , Hu, J.C. & Simmer, J.P. (2019a) Characteristics of the transverse 2D uniserial arrangement of rows of decussating enamel rods in the inner enamel layer of mouse mandibular incisors. Journal of Anatomy, 235, 912–930. [DOI] [PMC free article] [PubMed] [Google Scholar]
- Smith, C.E. , Hu, Y. , Hu, J.C. & Simmer, J.P. (2019b) Quantitative analysis of the core 2D arrangement and distribution of enamel rods in cross‐sections of mandibular mouse incisors. Journal of Anatomy, 234, 274–290. [DOI] [PMC free article] [PubMed] [Google Scholar]
- Smith, C.E. & Nanci, A. (1996) Protein dynamics of amelogenesis. Anatomical Record, 245, 186–207. [DOI] [PubMed] [Google Scholar]
- Smith, C.E. & Warshawsky, H. (1976) Movement of entire cell populations during renewal of the rat incisor as shown by radoioautography after labeling with 3H‐thymidine. The concept of a continuously differentiating cross‐sectional segment. (With an appendix on the development of the periodontal ligament). The American Journal of Anatomy, 145, 225–259. [DOI] [PubMed] [Google Scholar]
- Stern, D. & Crompton, A.W. (1995) A study of enamel organization, from reptiles to mammals. In: Moggi‐Cecchi, J. (Ed.) Aspects of dental biology: paleontology, anthropology and evolution. Florence: International Institute for the Study of Man, pp. 1–25. [Google Scholar]
- Summers, H.D. , Wills, J.W. , Brown, M.R. & Rees, P. (2015) Poisson‐event‐based analysis of cell proliferation. Cytometry Part A, 87, 385–392. [DOI] [PMC free article] [PubMed] [Google Scholar]
- Szmyt, J. (2014) Spatial statistics in ecological analysis: from indices to functions. Silva Fennica, 48, 1008. [Google Scholar]
- Taylor, A.C. & Butcher, E.O. (1951) The regulation of eruption rate in the incisor teeth of the white rat. Journal of Experimental Zoology, 117, 165–188. [Google Scholar]
- Velázquez, E. , Martínez, I. , Getzin, S. , Moloney, K.A. & Wiegand, T. (2016) An evaluation of the state of spatial point pattern analysis in ecology. Ecography, 39, 1042–1055. [Google Scholar]
- Warshawsky, H. (1971) A light and electron microscopic study of the nearly mature enamel of rat incisors. Anatomical Record, 169, 559–583. [DOI] [PubMed] [Google Scholar]
- Warshawsky, H. & Smith, C.E. (1971) A three‐dimensional reconstruction of the rods in rat maxillary incisor enamel. Anatomical Record, 169, 585–591. [DOI] [PubMed] [Google Scholar]
- Wiegand, T. & Moloney, K.A. (2014) Handbook of spatial point‐pattern analysis in ecology. Boca Raton: CRC Press. [Google Scholar]
- Wood, C.B. , Dumont, E.R. & Crompton, A.W. (1999) New studies of enamel microstructure in mesozoic mammals: a review of enamel prisms as a mammalian synapomorphy. Journal of Mammalian Evolution, 6, 177–213. [Google Scholar]
- Yilmaz, E.D. , Schneider, G.A. & Swain, M.V. (2015) Influence of structural hierarchy on the fracture behaviour of tooth enamel. Philosophical Transactions of the Royal Society A: Mathematical, Physical and Engineering Sciences, 373(2014), 0130. [DOI] [PubMed] [Google Scholar]
Associated Data
This section collects any data citations, data availability statements, or supplementary materials included in this article.
Supplementary Materials
Figures S1‐S6
Data Availability Statement
The locations for the 869 focal stacks described in this paper can be obtained in anatomical or unbent coordinates if desired by request to the first author. The python language program for converting anatomical to unbent coordinates is given in Supporting Information (Figure S6).