Abstract
Understanding of normal fetal organ development is crucial for the evaluation of the pathogenesis of congenital anomalies. Various techniques have been used to generate imaging of fetal rat organogenesis, such as histological dissection with 3‐dimensional reconstruction and scanning electron microscopy. However, these techniques did not imply quantitative measurements of developing organs (volumes, surface areas of organs). Furthermore, a partial or total destruction of the embryos prior to analysis was inevitable. Recently, micro‐computed tomography (micro‐CT) has been established as a novel tool to investigate embryonic development in non‐dissected embryos of rodents. In this study, we used the micro‐CT technique to generate 4D datasets of rat embryos aged between embryonic day 15–22 and newborns. Lungs, hearts, diaphragms, and livers were digitally segmented in order to measure organ volumes and analyze organ development as well as generate high‐resolution 3D images. These data provide objective values compiling a 4D atlas of pulmonary, cardiac, diaphragmatic, and hepatic development in the fetal rat.
Keywords: 3D imaging, 4D imaging, fetal liver development, fetal lung development, fetal rat, micro‐computed tomography, micro‐CT
Understanding of normal fetal organ development is crucial for the evaluation of the pathogenesis of congenital anomalies. Various techniques have been used to generate imaging of fetal rat organogenesis, such as histological dissection with 3‐dimensional reconstruction and scanning electron microscopy. However, these techniques did not imply quantitative measurements of developing organs (volumes, surface areas of organs). Furthermore, a partial or total destruction of the embryos prior to analysis was inevitable. Recently, micro‐computed tomography (micro‐CT) has been established as a novel tool to investigate embryonic development in non‐dissected embryos of rodents. In this study, we used the micro‐CT technique to generate 4D datasets of rat embryos aged between embryonic day 15 to 22 and newborns. Lungs, hearts, diaphragms and livers were digitally segmented in order to measure organ volumes and analyze organ development as well as generate high‐resolution 3D images. These data provide objective values compiling a 4D atlas of pulmonary, cardiac, diaphragmatic and hepatic development in the fetal rat.
1. INTRODUCTION
Traditionally, embryologists utilized illustrations such as drawings and schemes, to describe and visualize the dynamics of fetal organ development. These were based on histological sections of embryos, followed by 3D‐reconstructions or on scanning electron microscopy (SEM) (Moschopulos & Burri, 1992; Mayer et al., 2011). A meticulous and time‐consuming dissection of embryos prior to analysis of specific regions of interest was needed, subsequently leading to loss of information, which limited the overall understanding of developing processes. Furthermore, these techniques did not allow a valid quantitative measurement like volumes, surface areas or lengths of developing organs (Mayer et al., 2011; Starborg & Kadler, 2015).
Micro‐computed tomography (micro‐CT) was originally established for material science. Later, it was applied in small animal imaging and many different research fields, like imaging of osseous or vascular structures and abdominal organs. More recently, the implications of micro‐CT imaging for embryological research were highlighted by our group and others (Brosig, 2017; Schambach et al., 2010).
Previous studies were mainly based on complete body scans and morphological analysis of pre‐ and postnatal mice (Wong et al, 2012). There are only few studies focusing on fetal development of single visceral organs in chicks and rodents (CDH; Happel et al., 2010; Pelizzo et al., 2017, 2018). In the rat, micro‐CT was utilized to investigate organ development of certain congenital malformations at single time‐points (Pelizzo et al., 2017, 2018). However, longitudinal data on fetal rat organ development are not available and a comprehensive analysis, evaluating objective volumetric organ development is lacking.
The aim of the present study was to provide a comprehensive volumetric database applicable for research in fetal rats. Therefore, a longitudinal study of a selection of fetal visceral organs in the rat was performed using the micro‐CT technique. We assembled detailed chronological imaging of developing lung, heart, and liver (examples for whole organ development) and diaphragm (example for muscular tissue) of rat embryos aged between embryonic day (ED) 15 and 22 as well as newborns (N0).
2. MATERIALS AND METHODS
2.1. Animals
Animal care and experimental procedures were approved by the institutional review board (T14/15 and T44/16). Sprague‐Dawley rats were mated and pregnancy was verified by positive vaginal smear at ED 0 of pregnancy. Animals were housed at the Medical Experimental Center (MEZ), University of Leipzig, in rooms with a controlled temperature (22°C), humidity (55%) and 12 h light‐dark cycle. Food and water were freely available. Pregnant rats were euthanized by a lethal i.p. injection of pentobarbital (150 mg/kg body weight). Cesarean section was performed for animals from age ED15‐ED22. Newborns (N0) were harvested after spontaneous delivery and euthanized by decapitation.
2.2. Sample preparation
Sixty‐one embryos aged between ED15 and N0 were analyzed. From ED15 to ED22, six embryos obtained from 2 L (three animals each) were scanned. For improvement of fixation and imaging contrast the skin was removed in animals from ED20 to N0. On the first day of life (N0), three embryos per group were obtained for scans 0, 60, 120 (n = 4), and 240 min after birth. Each embryo was fixed immediately in Bouin's solution. Duration of fixation ranged according to the developmental stage between 2 and 5 days. Subsequently, samples were transferred in 80% ethanol and processed using the “critical point” drying technique: All samples were dehydrated in graded series of ethanol, thereafter rinsed several times with liquid carbon dioxide and dried in the Critical point dryer CPD 2 (Pelco, Ted Pella, Inc., CA, USA). All samples were kept dry until scanning. Detailed processing was previously described by our group (Brosig, 2017).
2.3. Micro‐CT scanning and reconstruction
Each sample was analyzed using a SkyScan 1172 intermediate‐high resolution micro‐CT scanner (Bruker microCT, Kontich, Belgium). All samples were scanned at 40 kV and 250 µA without filter and the voxel size ranged between 2.04 and 7.63 µm. Each specimen was rotated 360° around the vertical axis. Images were reconstructed by the scanner software (NRecon 1.7.0.4; Bruker) and converted to 16 bit Tiff‐format images for analysis. The 3D viewing software provided with the micro‐CT scanner (DataViewer®, CTvox®, CTAn®) was used to generate the volume rendering and virtual sections. While the DataViewer (Version 1.5.2.4; Bruker) produced images of embryos in frontal, sagittal, and transversal plane simultaneously, CTvox and CTAn® (Version 3.2.0; Bruker) created rendered 3D models for virtual sections of all regions.
2.4. Processing of specimen and virtual dissection
The segmentation of embryonic structures was performed by CT‐Analyzer (CTAn®, Version 1.16.1.0; Bruker). The datasets of all samples were blinded regarding age of the fetus. For volumetric measurements regions of interest (ROIs) of lung, heart, liver, and diaphragm total organic volumes (mm3) were measured manually. After measuring the ROIs the software generated 3D models from the manually chosen ROIs (Figure S2). Additionally, the software distinguished between total volume (TV), which is defined by organ volume within the regions of interest (ROIs), and the object volume (OV) that depicts the tissue volume within the ROIs without empty spaces like air. TV and OV were determined in absolute numbers as well as in organ volume to humeral ratio (mm2). Therefore, the absolute volume (mm3) was divided by mean length of both humeri (mm), providing a correction for methodological shrinkage. The ratio is based on the logarithmic scaling of individual total volumes of lung, heart, liver, and diaphragm, yielding in a linear relationship to the mean humeral length at every single timepoint (Figure S1). Thus, despite that specimen underwent fixation and drying processes, the development of the organs is consistent with the growth of the humerus. For dissection of left and right cardiac ventricles we included the ventricular septum to each of the measurements. This is due to the fact that the muscular tissue of the ventricular septum could not clearly be assigned to left or right ventricle.
All data are presented as mean ± SD. Graphs were created with GraphPad Prism 7 (GraphPad, La Jolla, CA, USA).
2.5. Histological sectioning
To correlate the micro‐CT findings of the pulmonary developmental stages to established histological characteristics, lung tissue (ED15, ED20, and N0) was fixed in 4% formalin, dehydrated in graded ethanol, embedded in paraffin. We used 5‐µm sections for staining with hematoxylin and eosin (H&E). Histological evaluation was performed using light microscope with objectives giving ×10 magnification.
3. RESULTS
Processing of the specimen resulted in high‐resolution 3D images of whole fetal rat bodies. The 3D reconstructions provide spatial information including precise visualization of organ structures and tissue surfaces from ED15 to N0 (Figures 1 and 2).
Figure 1.
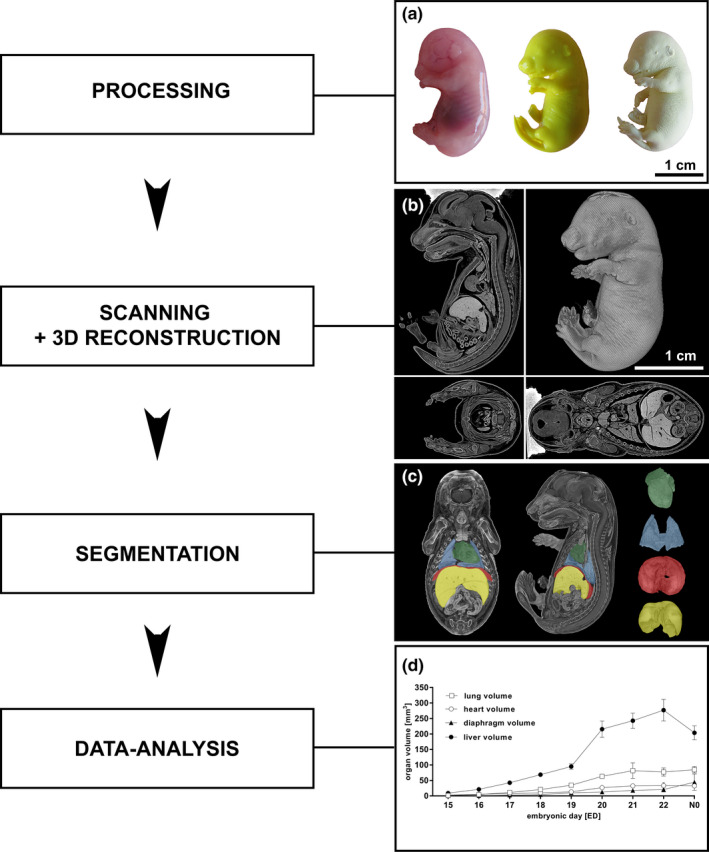
Processing of fetal rat specimen, three‐dimensional reconstruction, and data analysis (a‐d). A native fetal rat (ED18; a left) was fixated in Bouin´s fluid (a center) and dried using CO2(“critical point drying”; a right). The dried specimen was scanned in the micro‐CT and the reconstructed data set was converted into a 3D model in sagittal, coronal, and transversal plane (b). Raw data sets were segmented from transversal sections into 3D models of single organs or structures using CTAn software leading to high‐resolution 3D models of single organs: heart (green), lung (blue), diaphragm (red), and liver (yellow) (c). Subsequently, total organ volumes of heart, lung, liver, and diaphragm from ED15 to N0 were calculated (d). All values presented as mean ± SD
Figure 2.
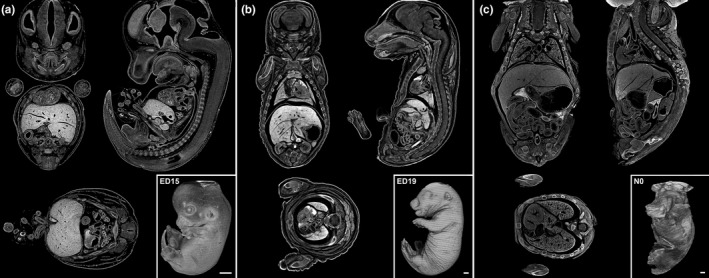
Exemplified whole body scans and sagittal, coronal as well as transversal plane of ED15, ED19, and N0 rats (a‐c). Whole Body scan of fetal rats with sections; ED15 (a), ED19 (b), N0 (c). Scale bar 1 mm
3.1. Lung development
In order to display the prenatal pulmonary development, 3D reconstructions were generated from ED15 to N0 including postnatal time‐points of 60–240 min.
3.1.1. Volumetry
Analysis of lung development revealed a continuous growth (Figure 3a,b). The pulmonary volume was 1.4 ± 0.1 mm3 on ED15. Values of the total volume increased to 77.2 ± 13.1 mm3 at ED22 and dropped to 69.3 ± 7.4 mm3 directly after birth (N0). To investigate the lung expansion directly after birth we performed scans at 0 (N = 3), 60 (N = 3), 120 (N = 4), and 240 (N = 3) minutes post‐partum (Figure 3b). After 60 min the lung volume increased to 77.4 ± 6.4 mm3 and remained unchanged for 240 min. On N0 the mean volumetric volume was 84.8 ± 10.7 mm3. The humeral ratio of the lung volume corresponded to the volumetric values (Figure 3b; Supplement table 1 and 2 in Figure S4).
Figure 3.
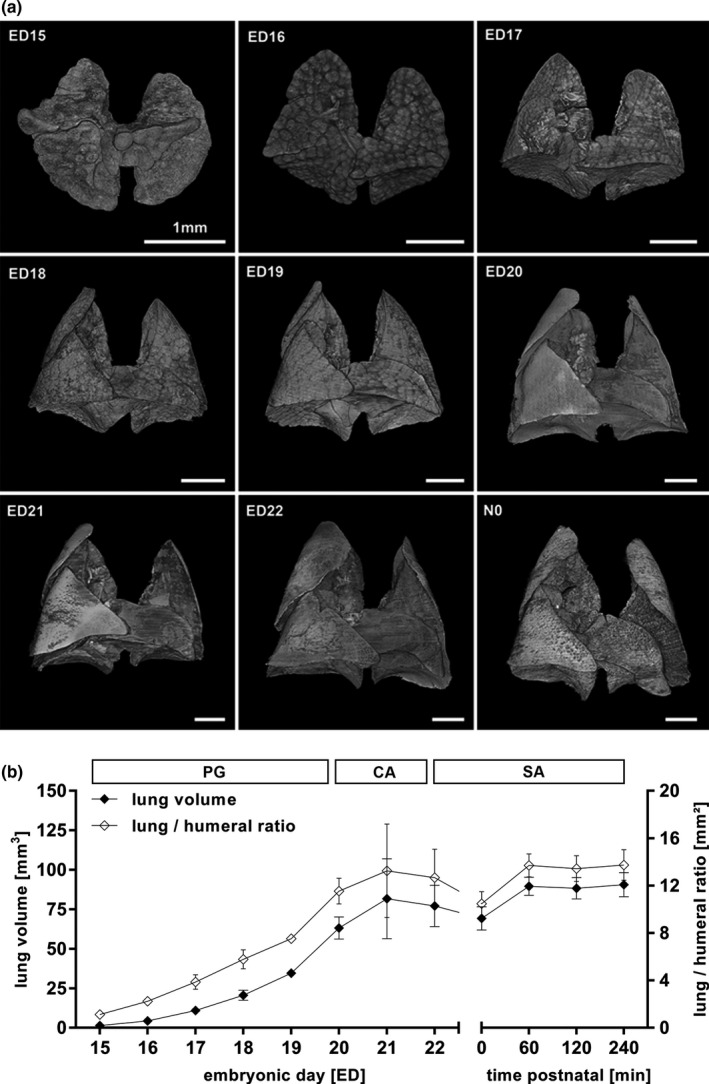
Volumetric changes during lung development (a, b). Changes in volume and surface of the developing lung from ED15 to N0 could be obtained (a). The structural changes of the lung correlated to the histological allocation to the pseudoglandular (PG, ED15‐20), canalicular (CA, ED20‐22) and saccular stage (SA, ED22‐N0) of lung development (a, b). Total lung volume and lung to humeral ratio increased from ED15 to E22, dropped ad birth and returned to prenatal values (b). All values in mean ± SD
The lobar volume constantly developed in close correlation to the lung volume in the same proportion (Figure 4d).The left lobe accounted for 33.9 ± 3.9% of the whole organ volume, followed by the right caudal lobe with 27.1 ± 4.0%. The right accessory lobe measured 13.5 ± 2.2%, the right cranial lobe 10.6 ± 1.6% and the right middle lobe 14.0 ± 1.8% (Figure 4a,b; Supplement table 3 in Figure S5). The values for total volume (TV) and object volume (OV) remained similar until ED22. After birth, we noted lower values for object volume and higher values for total volume (Figure 5).
Figure 4.
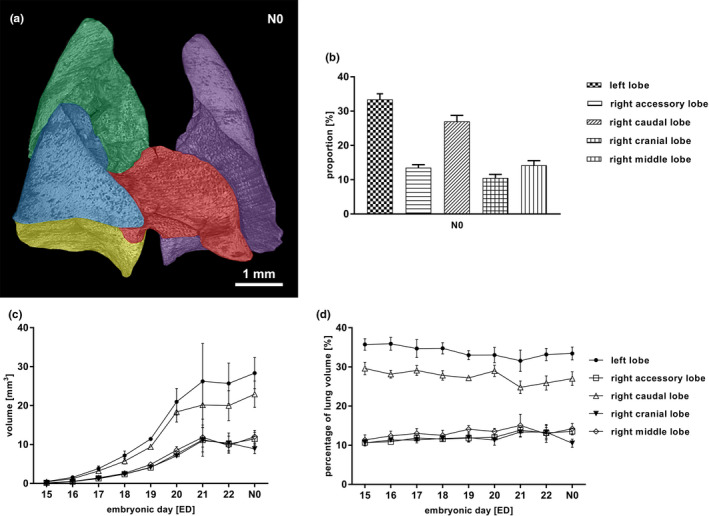
Segmentation of the lung (a‐d). Rat lung lobe segmentation at N0, left lobe (purple), right cranial lobe (green), right middle lobe (blue), right accessory lobe (red), right caudal lobe (yellow) (a). Proportion of single lobes as percentage of the total lung volume at N0 (b). Volumes of single lung lobes accordantly increased from ED15 to N0 (c), whilst their contribution to the total lung volume remained stable over time (d). All values in mean ± SD
Figure 5.
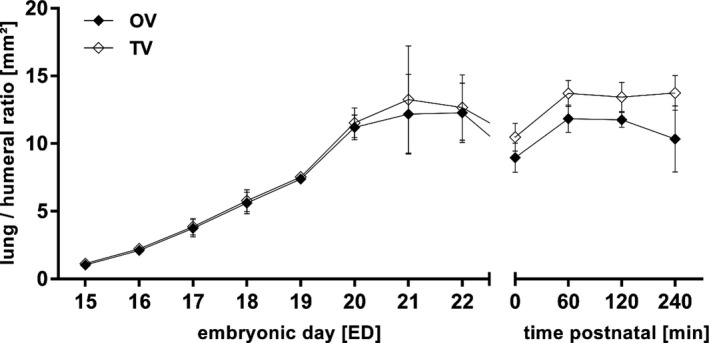
Total (TV) and object lung volume (OV) to humeral ratio. Prenatal TV and OV were similar but OV dropped postnatal, probably due to the air filling of the lungs by breathing. All values in mean ± SD
3.1.2. Morphology
The parenchymal pattern in micro‐CT cross‐sections (Figure 6). and pulmonary surface of 3D models (Figure 3) corresponded to the established pulmonary developmental stages: pseudoglandular (ED15‐20), canalicular (ED20‐22) and saccular stage (ED22‐N0). Micro‐CT findings were correlated with established histological developmental stages (Figure 6: In the pseudoglandular stage, the lung parenchyma had a glandular structure, and cross‐sections showed outgrowth of the terminal bud into the surrounding mesenchyme (Figure 6a,d) In the later stages, branching and penetration of the epithelial tubules into the surrounding tissue were observed. During the canalicular stage the airways expanded (Figure 6b,e). Imaging of the saccular stage showed a transition from branching of the airways to alveolarization (Figure 6c,f).
Figure 6.
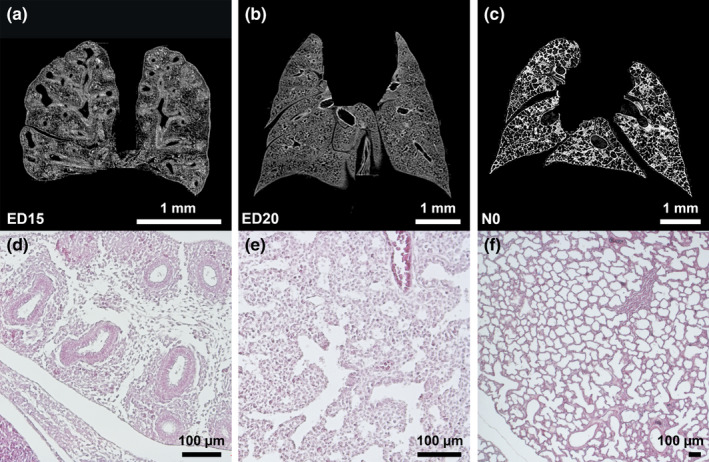
Pseudoglandular, canalicular, and saccular phase of lung development (a‐c). Exemplary micro‐CT images of coronary cross sections at ED15 (a), ED20 (b), and N0 (c). Additional histological sections (H&E) of corresponding pulmonary tissue (×10 magnification; d,e,f)[...] (a,d)[...](b,e)[...](c,f)). Images were adjusted for best visualization. In the pseudoglandular stage, lung parenchyma had a glandular structure and terminal buds grew out into the surrounding mesenchyme (a). In the later stages, branching and penetration of the epithelial tubules into the surrounding tissue were observed. During the canalicular stage the airways expanded (b). In the saccular stage, transition from branching of the airways to alveolarization could be observed (c). Scalebar 1 mm
For the first time, we precisely illustrated the prenatal pulmonary volume development and provided volumetric data for each point of time (Morphing of lung development, video content at ZB MED under https://doi.org/10.4126/FRL01‐006423454). The analysis also included separate investigation of lung lobes. Although micro‐CT images could be correlated to the established histological milestones of structural pulmonary development, imaging contrast and resolution were not high enough for reliable morphometric quantification.
3.2. Cardiac development
Cardiac development was evaluated from ED15 to N0 by providing high resolution imaging.
3.2.1. Volumetry
Fetal hearts (including atria) showed a total mean volume of 2.9 ± 0.3 mm3 on ED15 finally resulting in 33.2 ± 9.7 mm3 on ED22. On N0 measurement showed a cardiac volume of 32.4 ± 5.4 mm3. The humeral ratio corresponded to the volumetric data. Values for TV and OV were similar. (Figures 7b and 8; Supplement table 1 and 2 in Figure S4).
Figure 7.
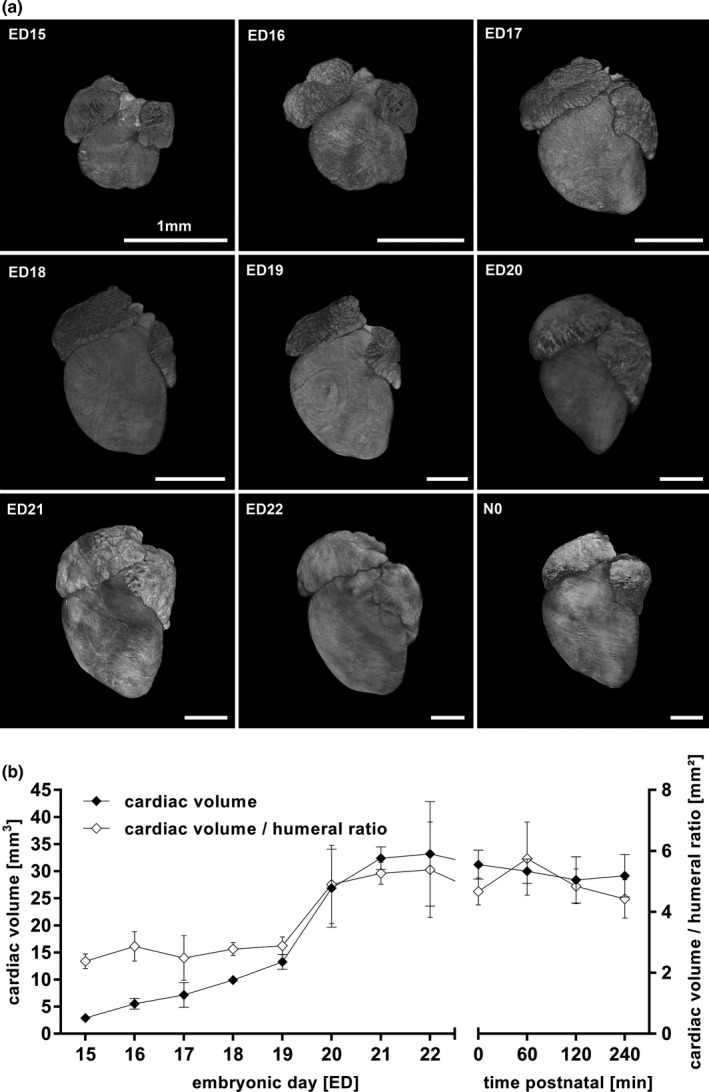
Volumetric changes during cardiac development (a, b). Changes in volume and surface of the developing heart from ED15 to N0 (a). Total cardiac ventricle volume as well as humeral ratio continuously increased prenatally remained unchanged after birth (b). All values in mean ± SD
Figure 8.
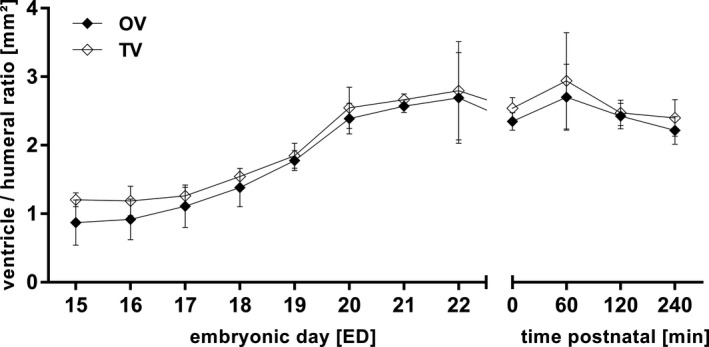
Total (TV) and object cardiac ventricle volume (OV) to humeral ratio. TV and OV remained similar before and after birth. All values in mean ± SD
Measurement of the humeral ratio for right (RV) and left ventricles (LV) was only able from ED16 because resolution of the scans on ED15 was too low to adequately differentiate between RV and LV. At ED16 humeral ratio was 0.8 ± 0.1 mm2 for RV and 0.6 ± 0.1 mm2 for LV. On N0 the right ventricle measured 1.7 ± 0.4 and left ventricle 1.4 ± 0.3 (Figure 9, Figures S4 and S5).
Figure 9.
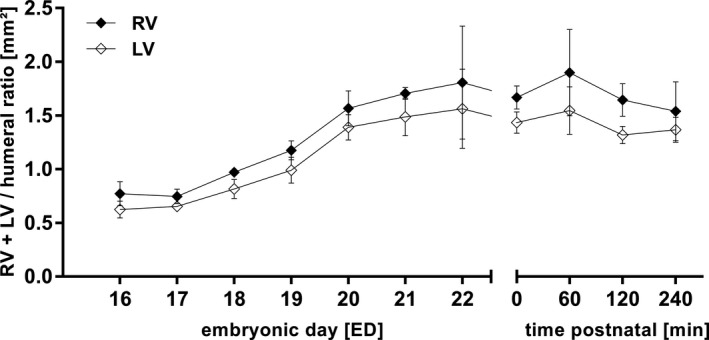
Humeral ratio of left (LV) and right cardiac ventricle (RV) from ED15 to N0. All values in mean ± SD
3.2.2. Morphology
Initially, cardiac ventricles appeared like a spherical structure. The anatomical distinction in cardiac base and apex could be observed for the first time on ED17. The atria showed various shapes and inhomogeneous surface (Figure 7a, morphing of heart development, video content at ZB MED under DOI:https://doi.org/10.4126/FRL01‐006423454).
Micro‐CT imaging resulted in a comprehensive volumetric dataset of whole organ volume development as well as left and right ventricle. Furthermore, structural development of cardiac atria and ventricles could be displayed.
3.3. Liver development
Volumetric and morphologic development of the fetal rat liver has not been visualized to date. Thus, we aimed to provide 3D imaging of the organ development and provide objective volumetric values.
3.3.1. Volumetry
On ED15, the liver had a mean volume of 9.0 ± 0.8 mm3. There was a steady increase in volume with a peak between ED19 and ED20, reaching a maximal mean size of 277.1 ± 34.9 mm3 on ED22. After birth, volume continuously decreased from 226.4 ± 5.8 mm3 (N0) to 168.2 ± 16.8 mm3 240 min post‐partum (Figure 10b). Total and object volume remained almost identical (Figure 11). The humeral ratio of the liver volume showed a similar course to the volumetric data (Figure 11, Figure S4).
Figure 10.
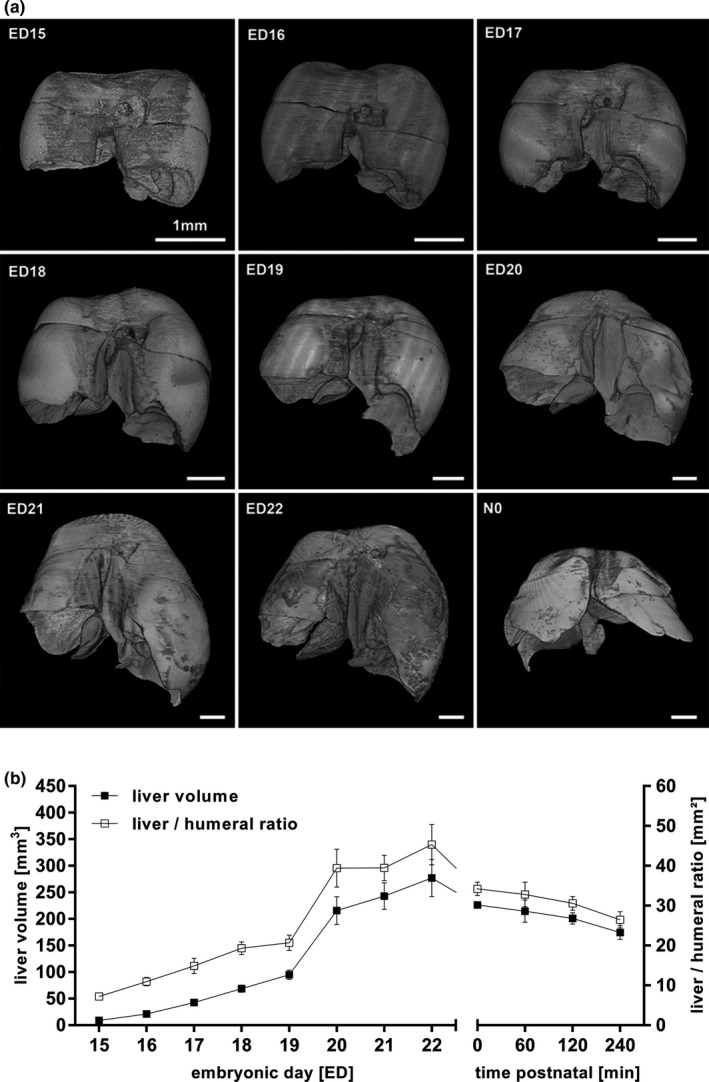
Volumetric changes during liver development (a, b). Changes in volume and surface of the developing liver from ED15 to N0 (a). Total liver volume as well as liver to humeral ratio continuously increased prenatally and sustained in decrease after birth, probably due to the postnatal changes in circulation (b). All values in mean ± SD
Figure 11.
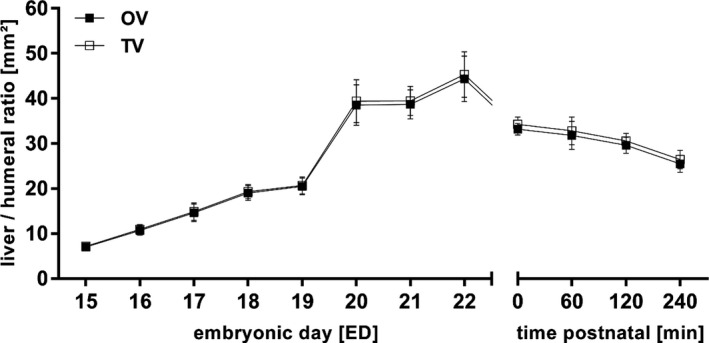
Total (TV) and object liver volume (OV) to humeral ratio. TV and OV remained similar before and after birth, probably due to the density of the liver. All values in mean ± SD.
3.3.2. Morphology
The surface texture showed only small changes and remained smooth over time, while the different lobes were growing into their individual shape (Figure 10a, Movie S3morphing of liver development video content at ZB MED under DOI: https://doi.org/10.4126/FRL01‐006423454).
Liver volume showed continuous increase and subsequent postnatal decrease.
3.4. Diaphragmatic development
Micro‐CT is also applicable to visualize prenatal development of muscular organic structures. We aimed to provide volumetric data and imaging of the morphologic development of the diaphragm.
3.4.1. Volumetry
The object volume of the diaphragm measured 0.5 ± 0.1 mm3 on ED15. The volume increased continuously until ED22 up to 14.9 ± 2.6 mm3 and decreased to 11.5 ± 1.9 mm3 240 min postnatal (Figure 12b). For technical reasons the distinction of object volume and total volume was impossible (Figure 12; Supplement table 1 in Figure S4).
Figure 12.
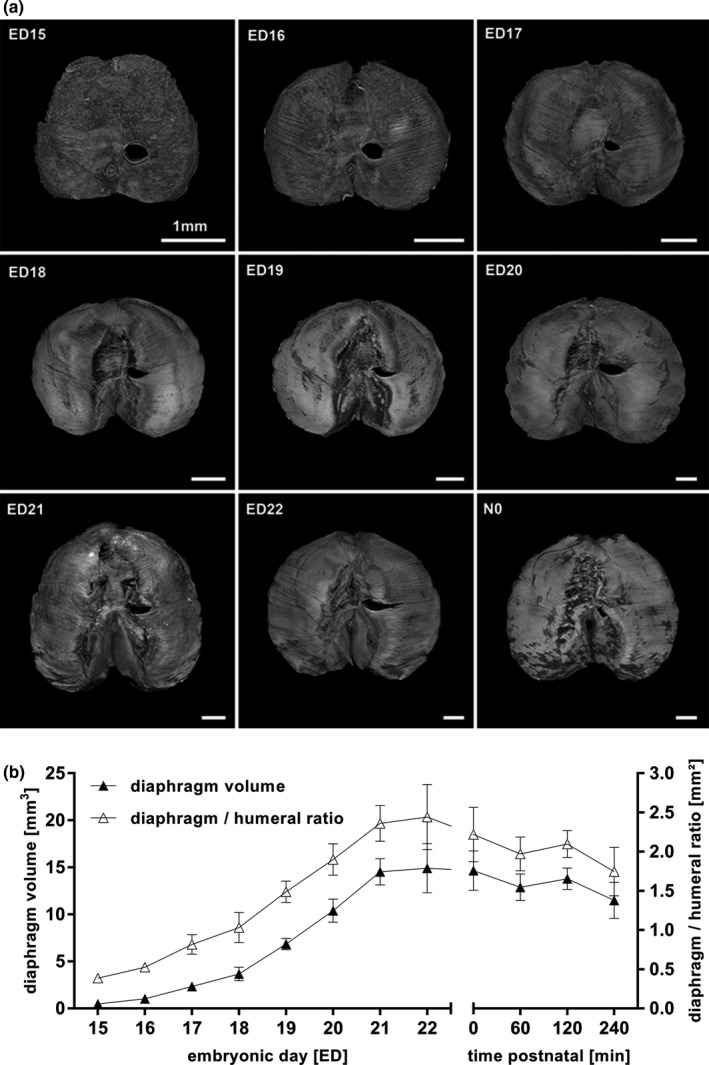
Volumetric changes during diaphragmatic development (a, b). Changes in volume and surface of the developing diaphragm from ED15 to N0. The proportion of fibrotic tissue building the central tendon increased continually (a). Total volume as well as diaphragm to humeral ratio increase from ED15 to N0 and decreased until 240 min after birth, theoretically due to the arising negative pressure in the thoracic cavity with neonatal breathing (b). All values in mean ± SD
3.4.2. Morphology
The diaphragm went through several structural changes (Figure 12a): On ED15, the surface appeared completely closed and had an overall muscular pattern. The esophagus and the foramen of the inferior vena cava were precisely visualized. On ED16, the centrum tendineum began to develop. Due to technical reasons, the tissue of diaphragm and liver could not clearly be distinguished until then. With the beginning of ED16, structural changes of the diaphragm from a homogeneous mass to the finally recognizable organ could be visualized. This included structural characteristics such as peripheral muscle, connective tissue in the area of insertion to the abdominal wall, and the fibrotic central tendon (Figure 12a; Figure S3). At N0, the main part of the central surface appeared like fibrotic non‐muscular tissue (Figure 12a).
Volumetric data on diaphragm development were acquired and morphologic diaphragmatic development was displayed by 3D reconstruction.
4. DISCUSSION
In this study, we compiled a 4D volumetric atlas of normal rat lung, heart, liver, and diaphragmatic development based on micro‐CT data of 61 embryos between ED15 and the newborn age (N0). The purpose of this longitudinal morphologic and volumetric analysis was the acquisition of objective developmental data in rat organs (de Bakker, 2016; Greer, 2013; Moschopulos & Burri, 1992; Moschopulos & Burri, 1993).
4.1. Lung development
Morphologic lung development can be divided into embryonic, fetal, and postnatal stages. The embryonic period includes Anlage of the two lungs and formation of major airways and pleura (Schittny, 2017). The fetal period can be subdivided into a pseudoglandular, canalicular, and saccular stage. The pulmonary development was visualized by micro‐CT imaging in accordance with histological findings: In the pseudoglandular stage (ED13 until ED20), the bronchial tree appears like a tubular gland and the first airways embedded in surrounded tissue emerge (Moschopulos & Burri, 1992; Schittny, 2017). In the following canalicular stage, the outer morphologic appearance of the lung and its surface is smoothened. The mesenchyme is canalized by newly formed airways and the lung can be separated in its single lobes (ED20‐ED22; Boyden, 1971; Moschopulos & Burri, 1992; Schittny, 2017). From ED22 to N0 (saccular stage), branchiogenesis is completed while the alveolarization steadily increases, revealing an enlargement of the existing airways (Moschopulos & Burri, 1992; Woods & Schittny, 2016). After birth, alveolarization further proceeds, which can clearly be identified by increased alveolar space.
Although histological approaches and micro‐CT technique were both able to assess morphological changes in lung development properly, high‐resolution micro‐CT imaging and subsequent digital analysis allowed precise volumetric description of the development of every single lung lobe from ED15 until the neonatal phase for the first time. Previously, histological slides and electron microscopy for “point counting” in a sampling stage microscope have been used. Although the absolute number of total lung volume was different, developmental changes were comparable to ours (Moschopulos & Burri, 1992).
Furthermore, we were able to show that all lobes remain in a stable relation to the whole organ volume during development. Analytic software enabled the differentiation between total volume (TV; organ volume including empty spaces like air) and object volume (OV; organ volume from organic tissue without empty spaces). While TV and OV showed no differences in prenatal lung development, TV tended to be higher after birth compared to OV. This was most likely due to the fact that the lung is progressively filled with air.
4.2. Cardiac development
In previous studies, first morphological signs of cardiac development in the rat were found on ED9. Histological sectioning and scanning electron microscopy revealed that after formation of a cardiac tube the first ventricular structures could be defined on ED11/12. The fetal rat heart was completely mature on ED16 (Marcela, 2012). While detailed theories on early cardiac development were provided by previous studies, data on chronologic volumetric values of the developing heart are lacking. Although micro‐CT imaging was not able to give insights into early cardiac development in the present study, objective volumetric data on ventricular development from ED15 to N0 could be obtained. This volumetric data is based on unaffected specimen whilst so far techniques in fetal animal research demanded a huge amount of manual preparation or additional labeling techniques (Christoffels et al., 2000; Marcela, 2012). So far, micro‐CT studies on prenatal cardiac development have been performed in various animal models like mice or chicks (Happel et al., 2010; Wong et al, 2012). In the rat, micro‐CT was used for investigation of certain congenital malformations at single time‐points. For example, Pelizzo et al. described prenatal changes in cardiac morphology in the nitrofen‐model of congenital diaphragmatic hernia on ED18 and ED21 based on cardiac volume and ventricular wall diameter (Pelizzo et al., 2018; Pelizzo et al., 2017). However, no longitudinal volumetric data has been provided. To the best of our knowledge, the present study represents the first reproducible 4D dataset on fetal cardiac volume development in the rat.
4.3. Liver development
So far, studies on fetal liver development mainly focused on processes of cellular differentiation, cytomorphometry, morphogenesis of the biliary ducts, and genetic regulation in different animal models rather than morphologic organogenesis (Ober & Lemaigre, 2018). The development of the liver begins with differentiation of hepatoblasts into hepatocytes and cholangiocytes before the liver is separated into different lobes (Ober & Lemaigre, 2018; Wilkins & Pack, 2013). Compared to histology, micro‐CT imaging was not able to assess these structural changes on a cellular level. Yet, we were able to precisely monitor the prenatal and postnatal development of liver volume in the rat. Separation of single lobes could not be performed due to insufficient resolution, which is in contrast to the excellent results in lung development (Brosig, 2017; Wilkins & Pack, 2013). This might be due to the morphologic denseness and constancy of the hepatic tissue with missing landmarks that allow automated separation of structures.
Of note, we observed an obvious decrease in liver volume by 25% in the first minutes after birth. One might speculate that the switch from fetal to neonatal circulation may be the major contributor to this phenomenon. The increasing lung circulation at birth might cause a decreased right precardial pressure, consequently leading to a lower blood volume situated in the liver tissue (Lind, 1963).
4.4. Diaphragmatic development
Diaphragmatic development has been extensively studied by several groups. This lead to a detailed description of histological changes (Mayer et al., 2011; Merrell, 2015; Sefton et al., 2018). Comparable to hepatic development, the resolution of micro‐CT imaging did not allow a clear identification of these histological proceedings. Previous studies based on SEM used the higher resolution of SEM in single images compared to micro‐CT. Consequently, micro‐CT imaging seems to be superior to SEM regarding volumetric analysis but inferior in terms of visualization of micromorphology (Iritani, 1984; Mayer et al., 2011). Moreover the diaphragm could hardly be distinguished from its surroundings on ED15 and ED16. The observed decrease in TV after birth might be caused by the changes of pressure in the thoracic cavity with onset of neonatal breathing.
4.5. Role of micro‐CT in embryological research and technical aspects
Wong et al. introduced a 3D atlas merging micro‐CT scans of mouse embryos at the age of ED15.5 to establish reference values for organ volumes of anatomical structures beyond organogenesis when growth and development starts. Advancing this technical approach, Hsu et al. analyzed scans of complete murine bodies to depict morphological changes induced by genetic disorders and aberrations between ED9.5 and P3. The authors concluded that high‐throughput phenotyping analysis could be achieved by micro‐CT imaging of knockout mice embryos (Hsu, 2016; Wong et al., 2012; Wong et al., 2015). However, a longitudinal analysis of the morphology, developmental changes and volumetric prenatal development of organs in the fetal rat is lacking.
Our study focused on normal fetal and neonatal development of lung, heart, liver, and diaphragm in the rat from ED 15 to N0. “Virtual dissection” of earlier developmental stages was markedly restricted due to the limited resolution of micro‐CT imaging impairing the visualization and separation of the organ structure. There is also still controversy on a standardized fixation protocol of embryos for optimal results in micro‐CT scanning. Our group uses Bouin's fixation combined with critical point drying (CPD) in order to create contrast enhancement of soft tissues (Brosig, 2017). This technique has been applied in the assessment of abnormal fetal heart development, allowing excellent imaging and exact volumetric measurements (Happel et al., 2010). Although the process of dehydration leads to an overall shrinkage of soft tissue, normalization to solid structures like the humerus compensate for that minor limitation. Other groups used iodine contrast enhancement. This technique allows scanning of wet embryos, which might reduce shrinkage. Nonetheless, applying CPD “virtual‐separation” of organs appeared to be more accurate and contrast‐enhanced compared to wet embryos (Brosig, 2017; Metscher, 2009; Wong et al., 2012).
5. CONCLUSION
Micro‐CT is an excellent tool to study organ development in rats, allocating objective longitudinal volumetric data on normal fetal and neonatal development of lung, heart, liver, and diaphragm. It further emphasizes the importance of micro‐CT and other high‐resolution imaging techniques in developmental research. Our measurements compile a 4D atlas of pulmonary, cardiac, hepatic, and diaphragmatic development in Sprague‐Dawley rats.
ACKNOWLEDGMENTS
Open access funding enabled and organized by Projekt DEAL
AUTHOR CONTRIBUTIONS
Moritz Markel and Marco Ginzel contributed to concept/design, acquisition of data, data analysis/interpretation, drafting of the manuscript, critical revision of the manuscript, and approval of the article. Nicole Peukert contributed to acquisition of data, data analysis/interpretation, critical revision of the manuscript. Hartmut Schneider, Rainer Haak, Steffi Mayer, and Anne Suttkus contributed to critical revision of the manuscript. Martin Lacher contributed to critical revision of the manuscript and approval of the article. Dietrich Kluth contributed to concept/design, critical revision of the manuscript, and approval of the article. Jan‐Hendrik Gosemann contributed to concept/design, data analysis/interpretation, critical revision of the manuscript, and approval of the article.
Supporting information
Fig S1
Fig S2
Fig S3
Fig S4
Fig S5
Moritz Markel and Marco Ginzel contributed equally.
DATA AVAILABILITY STATEMENT
The data that support the findings of this study are openly available in Publissio ZB MED Information Centre of Life Science at https://doi.org/10.4126/FRL01‐006423454.
REFERENCES
- Boyden, E.A. (1971) Development of the pulmonary airways. Minnesota Medicine, 54(11), 894–897. [PubMed] [Google Scholar]
- Brosig, S. , Peukert, N. , Metzger, R. , Schneider, H. , Haak, R. , Gosemann, J. et al. (2017) X‐ray micro‐computed‐tomography in pediatric surgery: A new tool for studying embryos. Pediatric Surgery International, 34(3), 297–305. [DOI] [PubMed] [Google Scholar]
- Christoffels, V.M. , Habets, P.E. , Franco, D. , Campione, M. , de Jong, F. , Lamers, W.H. et al. (2000) Chamber formation and morphogenesis in the developing mammalian heart. Developmental Biology, 223(2), 266–278. [DOI] [PubMed] [Google Scholar]
- de Bakker, B.S. , de Jong, K.H. , Hagoort, J. , de Bree, K. , Besselink, C.T. , de Kanter, F.E.C. et al. (2016) An interactive three‐dimensional digital atlas and quantitative database of human development. Science, 354(6315), aag0053. [DOI] [PubMed] [Google Scholar]
- Greer, J.J. (2013) Current concepts on the pathogenesis and etiology of congenital diaphragmatic hernia. Respiratory Physiology & Neurobiology., 189(2), 232–240. [DOI] [PubMed] [Google Scholar]
- Happel, C.M. , Klose, C. , Witton, G. , Angrisani, G.L. , Wienecke, S. , Groos, S. et al. (2010) Non‐destructive, high‐resolution 3‐dimensional visualization of a cardiac defect in the chick embryo resembling complex heart defect in humans using micro‐computed tomography: Double outlet right ventricle with left juxtaposition of atrial appendages. Circulation, 122, e561–e564. [DOI] [PubMed] [Google Scholar]
- Hsu, C.W. , Wong, L. , Rasmussen, T.L. , Kalaga, S. , McElwee, M.L. , Keith, L.C. et al. (2016) Three‐dimensional microCT imaging of mouse development from early post‐implantation to early postnatal stages. Developmental Biology, 419(2), 229–236. [DOI] [PMC free article] [PubMed] [Google Scholar]
- Iritani, I. (1984) Experimental study on embryogenesis of congenital diaphragmatic hernia. Anatomy and Embryology (Berlin), 169(2), 133–139. [DOI] [PubMed] [Google Scholar]
- Lind, J. (1963) Changes in the liver circulation at birth. Annals of the New York Academy of Sciences, 111, 110–120. [DOI] [PubMed] [Google Scholar]
- Marcela, S.G. , Cristina, R.M.M. , Angel, P.G.M. , Manuel, A.M. , Sofía, D.‐C. , Patricia, D.‐L.‐R.‐S. et al. (2012) Chronological and morphological study of heart development in the rat. Anatomical Record (Hoboken), 295(8), 1267–1290. [DOI] [PubMed] [Google Scholar]
- Mayer, S. , Metzger, R. & Kluth, D. (2011) The embryology of the diaphragm. Seminars in Pediatric Surgery, 20, 161–169. [DOI] [PubMed] [Google Scholar]
- Merrell, A.J. , Ellis, B.J. , Fox, Z.D. , Lawson, J.A. , Weiss, J.A. , Kardon, G. (2015) Muscle connective tissue controls development of the diaphragm and is a source of congenital diaphragmatic hernias. Nature Genetics, 47(5), 496–504. [DOI] [PMC free article] [PubMed] [Google Scholar]
- Metscher, B.D. (2009) MicroCT for developmental biology: A versatile tool for high‐contrast 3D imaging at histological resolutions. Developmental Dynamics, 238, 632–640. [DOI] [PubMed] [Google Scholar]
- Moschopulos, M. & Burri, P.H. (1992) Structural analysis of fetal rat lung development. Respiratory Biology, 234(3), 399–418. 10.1002/ar.1092340310 [DOI] [PubMed] [Google Scholar]
- Moschopulos, M. & Burri, P.H. (1993) Morphometric analysis of fetal rat lung development. Anatomical Record, 237, 38–48. [DOI] [PubMed] [Google Scholar]
- Ober, E.A. & Lemaigre, F.P. (2018) Development of the liver: Insights into organ and tissue morphogenesis. Journal of Hepatology, 68(5), 1049–1062. [DOI] [PubMed] [Google Scholar]
- Pelizzo, G. , Bussani, R. , Mazzon, E. , Anfuso, G. , Lombardi, C. , Zambelli, V. et al. (2018) Effects of simvastatin on fetal cardiac impairment in the diaphragmatic experimental hernia model. Fetal Diagnosis and Therapy, 46(1), 28‐37. [DOI] [PubMed] [Google Scholar]
- Pelizzo, G. , Calcaterra, V. , Lombardi, C. , Bussani, R. , Zambelli, V. , De Silvestri, A. et al. (2017) Fetal cardiac impairment in nitrofen‐induced congenital diaphragmatic hernia: Postmortem microcomputed tomography imaging study. Fetal and Pediatric Pathology, 36(4), 282–293. 10.1080/15513815.2017.1315198 [DOI] [PubMed] [Google Scholar]
- Schambach, S.J. , Bag, S. , Schilling, L. , Groden, C. , Brockmann, M.A. (2010). Application of micro‐CT in small animal imaging. Methods, 50(1), 2–13. [DOI] [PubMed] [Google Scholar]
- Schittny, J.C. (2017) Development of the lung. Cell and Tissue Research, 367(3), 427–444. [DOI] [PMC free article] [PubMed] [Google Scholar]
- Sefton, E.M. , Gallardo, M. & Kardon, G. (2018) Developmental origin and morphogenesis of the diaphragm, an essential mammalian muscle. Developmental Biology, 440(2), 64–73. [DOI] [PMC free article] [PubMed] [Google Scholar]
- Starborg, T. & Kadler, K.E. (2015) Serial block face‐scanning electron microscopy: A tool for studying embryonic development at the cell–matrix interface. Birth Defects Res C Embryo Today., 105(1), 9–18. [DOI] [PubMed] [Google Scholar]
- Wilkins, B.J. & Pack, M. (2013) Zebrafish models of human liver development and disease. Comprehensive Physiology, 3(3), 1213–1230. [DOI] [PMC free article] [PubMed] [Google Scholar]
- Wong, M.D. , Dorr, A.E. , Walls, J.R. , Lerch, J.P. , Henkelman, R.M. (2012) A novel 3D mouse embryo atlas based on micro‐CT. Development, 139(17), 3248–3256. [DOI] [PMC free article] [PubMed] [Google Scholar]
- Wong, M.D. , van Eede, M.C. , Spring, S. , Jevtic, S. , Boughner, J.C. , Lerch, J.P. et al. (2015) 4D atlas of the mouse embryo for precise morphological staging. Development, 142, 3583–3591. [DOI] [PMC free article] [PubMed] [Google Scholar]
- Woods, J.C. & Schittny, J.C. (2016) Lung structure at preterm and term birth. Fetal lung development – Clinical correlates & future technologies. New York: Cambridge University Press, pp. 126–140. [Google Scholar]
Associated Data
This section collects any data citations, data availability statements, or supplementary materials included in this article.
Supplementary Materials
Fig S1
Fig S2
Fig S3
Fig S4
Fig S5
Data Availability Statement
The data that support the findings of this study are openly available in Publissio ZB MED Information Centre of Life Science at https://doi.org/10.4126/FRL01‐006423454.


