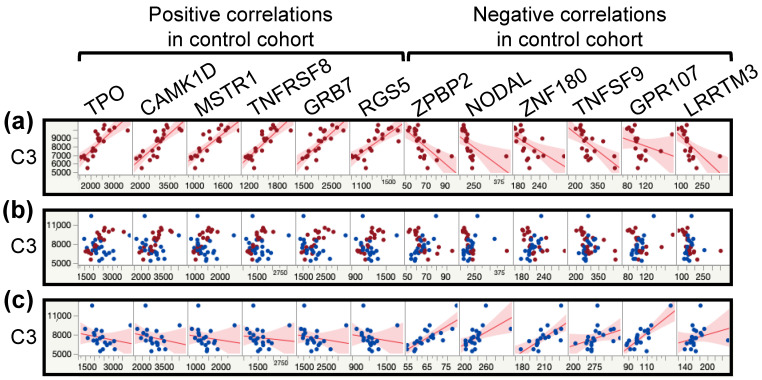
Figure 4.
Scatterplot matrices from multivariate analysis between the protein C3 and 12 other proteins with the most drastic correlation changes between the control and the ME/CFS cohorts. Controls (C) are shown in red and ME/CFS patients (P) in blue. (a) Scatterplot matrices for the control cohort with fitted line. (b) Scatterplot matrices overlay of both cohorts. (c) Scatterplot matrices for the ME/CFS cohort with fitted line.

