Abstract
Renal cell carcinomas (RCCs) account for about 90% of renal tumors, and their major histological subtype is ccRCC (clear cell RCC). Increasing evidence has indicated that the tumor microenvironment plays a significant role in the occurrence and development of ccRCC. In this study, we used ESTIMATE and CIBERSORT computational methods to calculate the proportion of immune and stromal components and the rate of TICs (tumor‐infiltrating immune cells) in 539 ccRCC samples from The Cancer Genome Atlas database. By examining the intersection of the differentially expressed genes obtained by the protein–protein interaction network and Cox regression analysis, we identified only one overlapping gene: IGLL5 (immunoglobulin lambda‐like polypeptide 5). We report that IGLL5 expression is correlated with TICs. Furthermore, our immunoinfiltration analyses revealed that three types of TIC are positively correlated with IGLL5 expression. IGLL5 may have potential as a prognostic biomarker of ccRCC.
Keywords: CIBERSORT, clear cell renal cell carcinoma, ESTIMATE, IGLL5, tumor microenvironment, tumor‐infiltrating immune cells
We used computational methods to calculate the proportion of immune and stromal components and the rate of tumor‐infiltrating immune cells in clear cell renal cell carcinoma samples from The Cancer Genome Atlas database. One gene, IGLL5, was filtered between the PPI network and prognostic genes. Immunoinfiltration analyses revealed that three types of tumor‐infiltrating immune cell were positively correlated with IGLL5 expression. In summary, IGLL5 may have potential as a novel prognostic biomarker of clear cell renal cell carcinoma.
Abbreviations
- ccRCC
clear cell renal cell carcinoma
- DEG
differentially expressed gene
- DR
down‐regulated
- FC
fold change
- FDR
false discovery rate
- GO
Gene Ontology
- GSEA
gene set enrichment analysis
- ICI
immune checkpoint inhibitor
- IGLL5
immunoglobulin lambda‐like polypeptide 5
- KEGG
Kyoto Encyclopedia of Genes and Genomes
- OS
overall survival
- PPI
protein–protein interaction
- RCC
renal cell carcinoma
- TCGA
The Cancer Genome Atlas
- TIC
tumor‐infiltrating immune cell
- TME
tumor microenvironment
- UR
up‐regulated
Renal cell carcinomas (RCCs) are malignant tumors that originated from renal tubular epithelial cells. RCCs account for about 90% of renal tumors, and their major histological subtype is clear cell RCC (ccRCC) [1]. In recent decades, the incidence rate of RCCs has increased in the majority of countries. It is estimated that 400 000 new cases of RCCs are diagnosed annually worldwide, resulting in more than 175 000 deaths. The incidence rate and mortality rate rank third in urological oncology universally [2, 3]. Radical nephrectomy is the first choice for early localized renal cancer, although it is still unable to tackle the problem of tumor recurrence or distant metastasis in more than 20% of patients postoperatively [4]. Meanwhile, RCCs have the characteristics of tolerance to radiotherapy and chemotherapy. As a consequence, it is highly essential to explore factors related to the prognosis and therapy of RCCs.
Tumor microenvironment (TME) has markedly attracted the attention of the tumor research community and has been recognized as a key factor in tumor progression in existing studies [5, 6, 7]. TME is a complex system of many groups of cells, including recruited immune and inflammatory cells and resident stromal cells, such as fibroblasts, neuroendocrine cells, adipose cells, among others [8]. A previous study showed that tumor‐infiltrating immune cells (TICs) in TME are a promising indicator of prognosis and therapeutic effects. Highly immune‐infiltrated TME is associated with adverse outcomes of ccRCC (e.g., higher tumor stage, higher recurrence rate, and mortality) [9]. Scholars have demonstrated that compositions of TICs are correlated with effects on immunotherapeutic interventions [10], confirming the effect of TICs on immunotherapy.
To date, The Cancer Genome Atlas (TCGA) database and bioinformatics have provided novel strategies for performing research on TME. An algorithm called “Estimation of Stromal and Immune cells in Malignant Tumours using Expression data (ESTIMATE)” was proposed to use gene expression data to calculate the proportion of stromal and immune cells in tumor samples [11], and this algorithm has been widely used to predict the proportion of immune and stromal cells in TMEs in different types of cancer [12, 13, 14]. In research conducted by Luo et al. [15], the ESTIMATE algorithm was first applied to ccRCC. Recently, more studies have concentrated on the application of ESTIMATE in ccRCC [16, 17, 18]. However, filtration conditions of hub genes were wide in previous studies, and they scarcely assessed the correlation between genes and TICs. In the present research, we obtained the differentially expressed genes (DEGs) by the ESTIMATE and then achieved hub genes from these DEGs by construction of a protein–protein interaction (PPI) network. Afterward, hub genes were combined with prognosis‐related genes to obtain the prognosis‐related hub genes, and finally, only one gene, immunoglobulin lambda‐like polypeptide 5 (IGLL5), complied with the requirements. In addition, we used CIBERSORT, a computational method that can estimate the relative proportion of each immune composition in a tumor sample, to calculate the ratios of TICs [19] (Fig. 1).
Fig. 1.
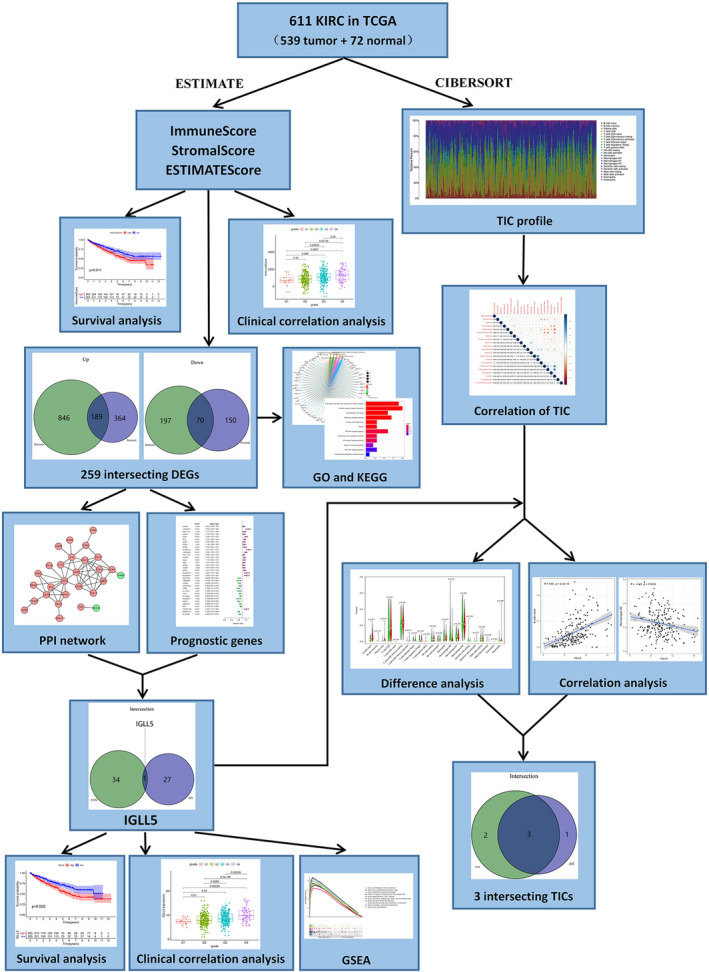
The flowchart of this experiment.
Results
Scores and the survival of patients with ccRCC are correlated
We extracted the transcriptome and clinical data of 611 cases from the TCGA Kidney Renal Clear Cell Carcinoma database, with participation of 539 ccRCC and 72 normal samples. To evaluate the immune scores, stromal scores and ESTIMATE scores for each sample, we used the ESTIMATE. With higher ImmuneScore or StromalScore, TME involved more immune or stromal components, and the summation of ImmuneScore and StromalScore was presented by the ESTIMATEScore, which represented the comprehensive scale of these two components in TME. On the basis of the median score, the tumor samples were divided into high score (HS) and low score (LS) groups. Then we conducted the survival analysis to evaluate the correlation between scores and survival. The Kaplan–Meier plot indicated that ImmuneScore was correlated with overall survival (OS), and poorer prognosis of cases in the HS group was noted (Fig. 2A). StromalScore and ESTIMATEScore indicated that OS was longer in the LS group compared with that in the HS group; however, no significant differences were noted between the two groups (Fig. 2B,C). These results suggested that ImmuneScore could better reflect the prognosis of cases with ccRCC.
Fig. 2.

Correlation between scores and the survival of patients with ccRCC. (A) Kaplan–Meier survival analysis for ImmuneScore (P = 0.011). The red line represents the HS group, and the blue line represents the LS group. (B) Kaplan–Meier survival analysis for StromalScore (P = 0.528). (C) Kaplan–Meier survival analysis for ESTIMATEScore (P = 0.459).
Correlation between scores and the clinicopathological characteristics of patients with ccRCC
To determine dependency of scores on clinicopathological characteristics, we attempted to investigate the clinical data of individuals with kidney renal clear cell carcinoma retrieved from TCGA. The Wilcoxon rank‐sum test was used for testing the correlation. As shown in Fig. 3, male patients with ccRCC had higher ImmuneScore (P = 0.016) and ESTIMATEScore (P = 0.029) than female patients with ccRCC (Fig. 3A,M), whereas the difference in StromalScore between male and female patients with ccRCC was not statistically significant (Fig. 3G). ImmuneScore and ESTIMATEScore increased with a higher rank order of Fuhrman grades (G1–G4, G2–G3, G2–G4, G3–G4; P < 0.05; Fig. 3B,N) and clinical stages (stages I–IV, P < 0.05; Fig. 3C,O). In addition, ImmuneScore and ESTIMATEScore increased with an increase in tumor size, except for T4 (T1–T3, P < 0.05; Fig. 3D,3P), and the probable reason may be that the sample size in T4 is not large enough, which reduces the statistical power to detect a significant difference. Moreover, patients with ccRCC with lymph node metastases and distant metastases had higher ImmuneScore (N and M stages, P < 0.05) and ESTIMATEScore (M stage, P < 0.05; N stage, P = 0.083) than patients without metastases (Fig. 3E,F,Q,R). Increased StromalScore was associated with an elevation in Fuhrman grade (G2–G4, G3–G4; P < 0.05; Fig. 3H). Nevertheless, StromalScore was associated with no significant difference in none of the other clinical parameters (Fig. 3I–L). Hence the proportion of immune and stromal components could be associated with the invasion and metastasis of patients with ccRCC.
Fig. 3.
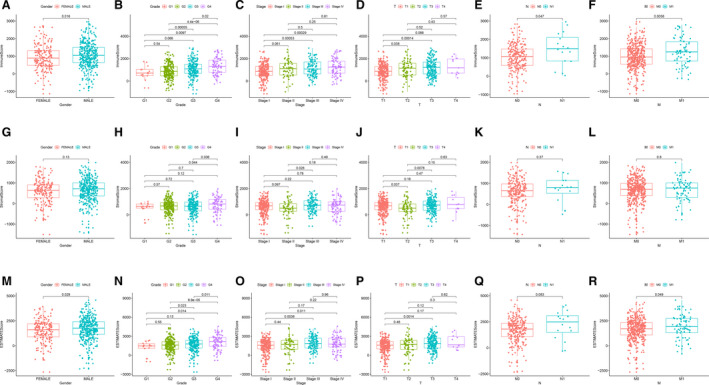
Correlation between scores and clinicopathological characteristics of patients with ccRCC. (A–F) ImmuneScore and sex (P < 0.05), Fuhrman grade (G1–G4, G2–G3, G2–G4, G3–G4; P < 0.05), clinical stage (stages I–IV; P < 0.05), T stage (T1–T3; P < 0.05) and N and M stages (P < 0.05). (G–L) StromalScore and sex, Fuhrman grade (G2–G4, G3–G4; P < 0.05) and TNM stage. (M–R) ESTIMATEScore and sex (P < 0.05), Fuhrman grade (G1–G4, G2–G3, G2–G4, G3–G4; P < 0.05), clinical stage (stages I–IV; P < 0.05), T stage (T1–T3; P < 0.05), N stage (P = 0.083) and M stage (P < 0.05).
Gene Ontology and KEGG pathway enrichment analyses of DEGs
With respect to classification of patients mentioned earlier, we attempted to conduct the differential analysis by Wilcoxon test, and we identified 1491 DEGs for ImmuneScore, involving 1035 up‐regulated (UR) and 267 down‐regulated (DR) genes. Meanwhile, we identified 773 DEGs by the same process for StromalScore, including 553 UR and 220 DR genes (|logFC| > 1, false discovery rate [FDR] < 0.05; Fig. 4A,B). A Venn diagram was used to explore genes associated with TME, and we noted 259 intersecting genes in ccRCC samples, involving 189 UR genes and 70 DR genes in the HS group compared with LS groups (Fig. 4C,D).
Fig. 4.
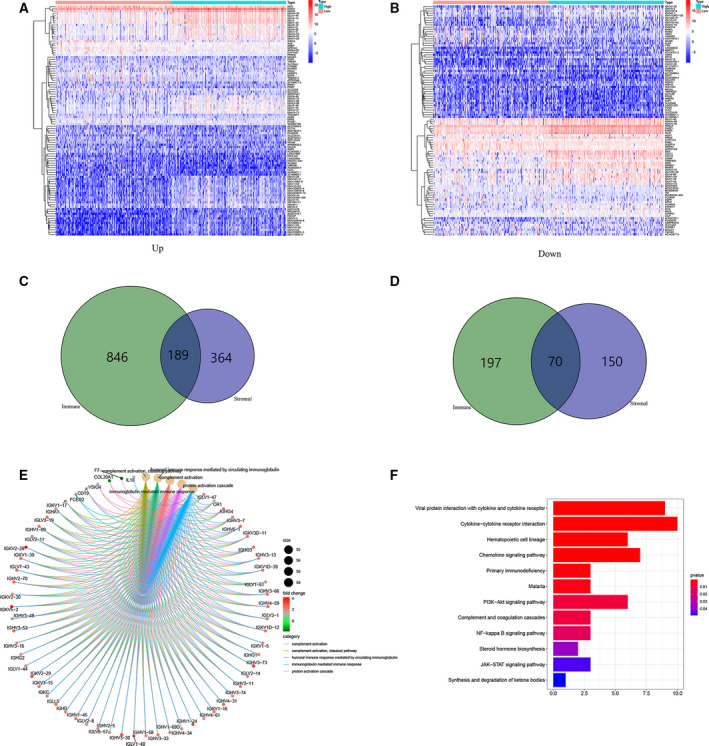
Analysis of DEGs. (A, B) Heatmaps for the most significant 100 DEGs based on logFC (50 UR and DR genes in each sample) in ImmuneScore (A) and StromalScore (B) (|logFC| > 1, FDR < 0.05). (C, D) Venn diagrams showing concurrently UR and DR DEGs in ImmuneScore (C) and StromalScore (D). (E, F) GO and KEGG enrichment analyses of DEGs (P < 0.05).
To determine the roles of the DEGs, we conducted Gene Ontology (GO) and Kyoto Encyclopedia of Genes and Genomes (KEGG) functional enrichment analyses. The results of GO functional analyses demonstrated the enrichment of DEGs mainly in complement activation, immune response mediated by immunoglobulin and protein activation pathways (Fig. 4E). Furthermore, the pathways involved in tumor immune response and ccRCC tumorigenesis were identified in the KEGG pathway enrichment analyses (Fig. 4F).
Establishment of the PPI network of DEGs and detection of the prognostic hub genes
For further exploring the interplay of the DEGs, we constructed a PPI network using the STRING online tool with the interaction confidence value >0.70 as the cutoff criterion. The interactions between the intersecting DEGs are shown in Fig. 5A, and we ranked hub genes on the basis of the number of nodes, as depicted in the bar plots (Fig. 5B). Then we analyzed these 28 hub genes via the Cytoscape software and found 26 UR genes and 2 DR genes (Fig. 5C). Next, we performed the univariate Cox regression analysis of survival to define the prognostic genes among 259 intersecting DEGs and noted that 35 genes were associated with prognosis (Fig. 5D). Finally, an intersection analysis was undertaken between the leading nodes in the PPI network and the prognostic genes, and there was only one overlapping gene, IGLL5 (Fig. 5E).
Fig. 5.
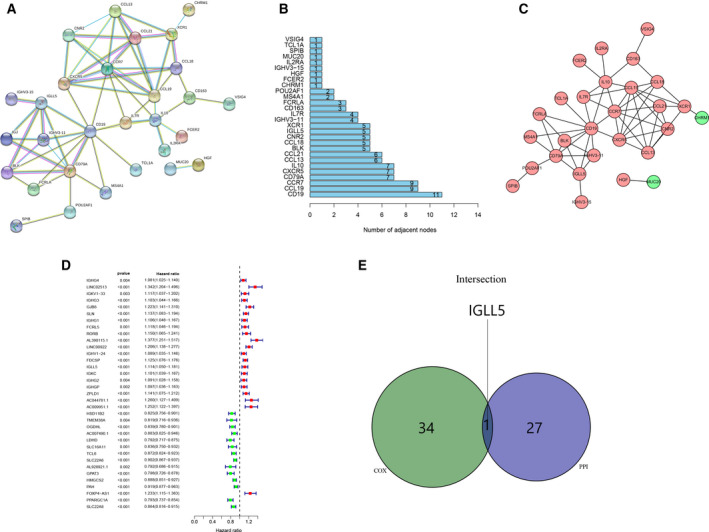
Construction of the PPI network of DEGs and identification of the prognostic hub genes. (A) A PPI network of DEGs with interaction confidence value >0.70. (B) Hub genes ranked by the number of nodes. (C) Network indicated the UR and DR genes using the Cytoscape software. (D) Forest plots listing the prognostic genes with P < 0.005. (E) A Venn diagram showing the prognostic hub gene in the PPI network and univariate Cox analysis.
Correlation of IGLL5 expression with the clinicopathological staging and survival of patients with ccRCC
IGLL5 located within the immunoglobulin lambda locus encoded one of the IGLLs. No correlation was noted between the first exon of this gene and immunoglobulin variable genes; the immunoglobulin lambda joining 1 and the immunoglobulin lambda constant 1 gene segments were taken as the second and third exons, respectively. Diseases associated with IGLL5 included Schuurs–Hoeijmakers syndrome and retina lymphoma. The gene‐associated GO annotations included antigen binding. The IGLL5 gene‐associated information was retrieved from https://www.genecards.org.
Differential expression analysis of IGLL5 between normal samples and ccRCC samples showed that IGLL5 expression was higher in tumor samples (P < 0.001; Fig. 6A,B). Then we grouped all ccRCC samples into high IGLL5 expression (H‐IGLL5‐E) group and low IGLL5 expression (L‐IGLL5‐E) group on the basis of median IGLL5 expression. According to survival analysis, ccRCC samples with L‐IGLL5‐E had longer survival than those with H‐IGLL5‐E (P < 0.005; Fig. 6C). After comparing the clinicopathological parameters with the expression of IGLL5 by the Wilcoxon rank‐sum test, we found that the expression of IGLL5 increased with Fuhrman grade (G1–G4), clinical stage (stage I–IV), tumor size (T1–T3) and the number of lymph node metastases (P < 0.05), whereas the differences in sex and distant metastases were not statistically significant (Fig. 6D–I). The results suggested that IGLL5 had a correlation with the occurrence and development of tumor, and the UR expression of IGLL5 indicated negative prognosis of ccRCC.
Fig. 6.
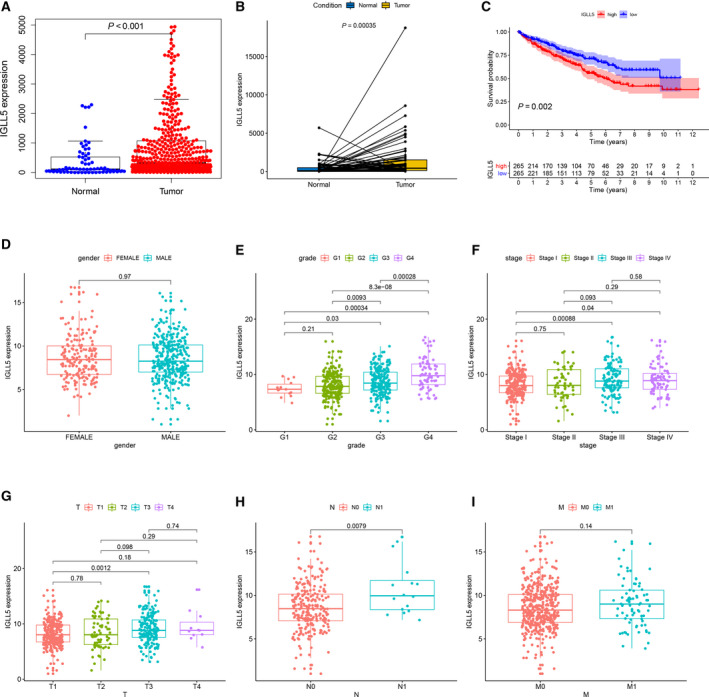
Correlation of IGLL5 expression with the survival and the clinicopathological characteristics of patients with ccRCC. (A) Differential expression analysis of IGLL5 in the normal and ccRCC samples by the Wilcoxon rank‐sum test. (B) Paired differentiation analysis of IGLL5 expression by the Wilcoxon rank‐sum test. (C) Kaplan–Meier survival analysis of H‐IGLL5‐E and L‐IGLL5‐E groups by the log‐rank test. (D–I) The correlation analyses of IGLL5 expression with clinicopathological characteristics. The IGLL5 expression increased with Fuhrman grade (G1–G4), clinical stage (stage I–IV), tumor size (T1–T3) and the number of lymph node metastases (P < 0.05).
GSEA enrichment analyses of IGLL5
To better comprehend the role of IGLL5 in ccRCC, we carried out gene set enrichment analyses (GSEA) on H‐IGLL5‐E and L‐IGLL5‐E groups that were divided by the median level of IGLL5 expression. In C2 collection defined by MSigDB, KEGG gene sets, the genes in the H‐IGLL5‐E group were mostly enriched in autoimmune diseases, cell adhesion molecules, chemokine signaling pathway, cytokine–cytokine receptor interaction, hematopoietic cell lineage, intestinal immune network for immunoglobulin A production, PI3K (Phosphoinositide 3‐kinase) –Akt signaling pathway, natural killing cell‐mediated cytotoxicity, among others (Fig. 7A). In the C7 collection, numerous immune functional gene sets were enriched in the H‐IGLL5‐E group (Fig. 7B). We selected the top 10 gene sets according to FDR (<0.001) and drew the multi‐GSEA enrichment plot. However, few gene sets were enriched in the L‐IGLL5‐E group in both KEGG and C7 collections (there were no gene sets with FDR q < 0.5).
Fig. 7.

GSEA enrichment analyses for IGLL5. (A) The multi‐GSEA enrichment plot of KEGG collection in H‐IGLL5‐E group (FDR < 0.001). Each particular gene set was represented by one line with unique color, and UR genes were placed on the left of the x‐axis, while the DR genes were on the right side. (B) The multi‐GSEA enrichment plot of C7 collection defined in the H‐IGLL5‐E group (FDR < 0.001).
Correlation of IGLL5 expression with TICs
We implemented further analyses to verify the correlation of IGLL5 expression with the TME via the CIBERSORT package in r programming language. Figure 8A shows the establishment of 22 types of immune cell profile in ccRCC samples, and the association between these TICs was displayed by heatmap (Fig. 8B). Each intersection represented the correlation between the two immune cells, which was expressed by P value and the shade of the circle. Then we conducted the difference analysis to compare the proportions of TICs in the H‐IGLL5‐E group with those in the L‐IGLL5‐E group, and we found that differences in naive B cells, plasma cells, resting memory T cells, and activated CD4 memory T cells were statistically significant (P < 0.05; Fig. 8C). Similarly, Spearman's rank correlation test was used, and we found that differences in naive B cells, plasma cells, activated CD4 memory T cells, activated NK cells and M2 macrophages were statistically significant (P < 0.05; Fig. 8D–H). The results showed that three types of TIC were positively correlated with IGLL5 expression (Fig. 8I), and IGLL5 expression affected the immunological parameters associated with TME.
Fig. 8.
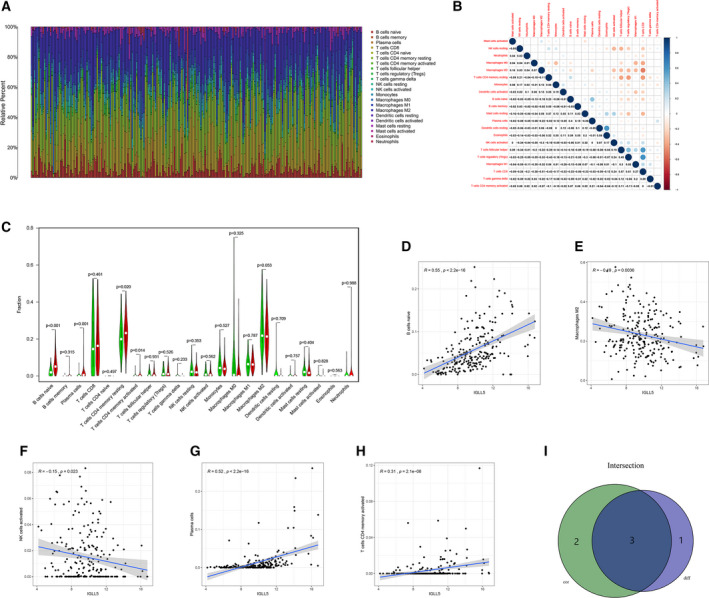
Correlation of IGLL5 expression with TICs. (A) The bar plot shows the proportion of 22 types of TIC in ccRCC samples. (B) The heatmap displays the correlation among 22 types of TIC. (C) The violin plot depicts the fractions of 22 types of immune cell in ccRCC samples between H‐IGLL5‐E and L‐IGLL5‐E groups according to the median expression level of IGLL5, and differences in four types of TIC were statistically significant (P < 0.05) by the Wilcoxon rank‐sum test. (D–H) The scatterplots show the correlation among five types of TIC and the IGLL5 expression level with P < 0.05 by Spearman's rank correlation test. (I) A Venn diagram illustrates that three types of TIC were correlated with IGLL5 expression.
Discussion
A number of scholars have universally introduced RCC as the third most frequent kind of urological neoplasm, which causes thousands of deaths every year. However, prognostic and therapeutic biomarkers of RCC have not yet been identified.
In recent years, TME has rapidly attracted the attention of the tumor research community and has been recognized as a key factor in tumorigenesis and development, therapeutic resistance and prognosis [5, 6, 7]. It is widely regarded that RCC has a unique immune microenvironment. Perhaps more than any other solid tumor type, RCC is infifiltrated with immune cells of various phenotype and function [20, 21, 22]. Some studies have shown that TICs in TME are such a promising indicator of prognosis [9, 23]. Since the appearance of tyrosine kinase inhibitors that could antagonize vascular endothelial growth factor receptor to treat metastatic RCC in 2005, the treatment of RCC has entered the era of targeted therapy [24, 25, 26, 27]. However, tyrosine kinase inhibitors have poorer clinical effects on the treatment of RCC with higher level of TICs, and the objective response rate, clinical benefit rate, and OS were worse in patients with RCC with higher TICs [9]. With the advent of immunotherapy, the efficacy of targeted therapy has markedly improved. The combination of vascular endothelial growth factor receptor inhibitors and immune checkpoint inhibitors (ICIs) can help patients to tolerate the treatment well and prolong the survival of patients with RCC [28, 29]. Immunotherapy, especially ICI, has shown promising clinical outcomes in patients with several solid tumors [30]. Several types of immunotherapy are currently thought to work by evoking immune responses in TME [31, 32]. It was reported that compositions of TICs are correlated with effects on the immunotherapeutic interventions [10]. The earlier‐mentioned studies confirmed the effects of TICs on the treatment of RCC.
In this study, we attempted to explore the prognosis of TME‐related genes, and we demonstrated the correlation between the genes and TICs retrieved from TCGA database. We used ESTIMATE to score each ccRCC sample and divided samples into HS and LS groups according to the median score. The results suggested that the score of immune components in TME could better reflect the prognosis of patients with ccRCC. The patients with ccRCC with high immune component had poorer survival and higher histological and clinical stages. Other evidence also suggested that high immune cell infiltration predicted poor prognosis [23]. Next, we identified TME‐related DEGs between the HS and LS groups and screened a total of 259 intersecting genes, consisting of 189 UR and 70 DR genes. The results of GO and KEGG functional enrichment analyses demonstrated that the DEGs were mainly enriched in tumor immune response and ccRCC tumorigenesis. To further explore the interplay of the DEGs, we constructed a PPI network with the interaction confidence value of >0.70 as the cutoff criterion, and we consequently detected 28 hub genes. Afterward, we identified 35 prognosis‐related genes using univariate Cox regression analysis. Finally, IGLL5 could be detected, which is a gene that overlapped in the hub genes in the PPI network and the prognosis‐related genes.
IGLL5 located within the immunoglobulin lambda locus encoded one of the IGLLs, which were the immunoglobulin lambda joining 1 and the immunoglobulin lambda constant 1 gene segments. Only a limited number of research has shown that IGLL5 has a frequent mutation in chronic lymphocytic leukemia [33, 34], lymphoma [35, 36, 37], and multiple myeloma [38, 39]; besides, IGLL5 has a prognostic value in several diseases, such as multiple myeloma and glioblastoma [39, 40, 41]. Moreover, previous studies have shown that IGLL5 has a prognostic value in ccRCC, while no in‐depth study has concentrated on TICs.
We used CIBERSORT to calculate the relative proportion of each TIC in a tumor sample. We further conducted differential analysis and correlation analysis to explore the correlation between IGLL5 and TICs. The results revealed that the expression of IGLL5 was correlated with three types of TIC ratio: naive B cells, plasma cells and activated CD4 memory T cells. The main role of tumor‐infiltrating B cells has been found to be controversial, and studies suggested that they play a tumor‐promoting role by suppression of the antitumor response [42, 43]. Inhibition of IGLL5 aiming to reduce the infiltration of B cells in tumors may provide a new target for combined immunotherapy.
In summary, IGLL5, a TME‐related hub gene, was extracted from functional enrichment analysis of TCGA database based on ESTIMATE algorithm. After survival analysis and evaluation of prognostic values, IGLL5 may become potential a prognostic biomarker of ccRCC. Combined immunotherapy based on IGLL5 inhibitor and ICIs provides a new idea and needs further study.
Materials and methods
TCGA data
Transcriptome RNA sequencing data and the corresponding clinical data of 611 ccRCC cases (normal samples, 72 cases; tumor samples, 539 cases) were downloaded from TCGA database (https://portal.gdc.cancer.gov/), and the samples with unknown information were removed.
ESTIMATE algorithm
r programming language version 3.6.2 (https://www.r‐project.org/) was used for estimating ratio of immune‐stromal component in TME for each sample by ESTIMATE algorithm. ESTIMATE algorithm involved three types of score: ESTIMATEScore, StromalScore and ImmuneScore.
Survival analysis and difference analysis of scores with clinicopathological staging
r language loaded with package survival and survminer was used for the survival analysis, and the survival curve was plotted by Kaplan–Meier method. We considered P < 0.05 statistically significant.
The Wilcoxon rank‐sum test was used to compare differences between scores and clinicopathological characteristics.
Identification of DEGs
In addition, division of 539 tumor samples into HS and LS groups was undertaken on the basis of the median score. DEGs with FDR <0.05 and fold change (FC) >1 after transformation into log2 (HS group/LS group) were considered significant.
Heatmaps
We utilized r programming language, especially pheatmap package, to plot heatmaps of DEGs.
GO and KEGG enrichment analysis
We used r programming language to conduct GO and KEGG enrichment analyses of 259 DEGs with the aid of the packages clusterProfifiler, ggplot2 and enrichplot. Terms with P < 0.05 were considered significantly enriched.
PPI network construction
To further explore the interplay of the DEGs, we attempted to construct a PPI network with the aid of the STRING online tool, and a cutoff criterion was taken into account (minimum required interaction score > 0.70). Then we reconstructed the network to label UR and DR genes with cytoscape of version 3.6.1 (https://cytoscape.org).
Cox regression analysis
The univariate Cox regression analysis was performed on survival to define the prognostic genes among 259 intersecting DEGs, and we found that 35 genes were associated with prognosis, listing in the forest plots with P < 0.005.
GSEA
We attempted to carry out GSEA enrichment analyses of C2‐KEGG and C7 gene sets with the aid of gsea 4.0.3 software (http://software.broadinstitute.org/gsea/index.jsp).
TICs profile
In tumor samples, for estimation of the TIC abundance profile, the CIBERSORT method was used.
Conflict of interest
The authors declare no conflict of interest.
Author contributions
CZ and Z‐NX conceived and supervised the study; Z‐NX and X‐YW designed and performed experiments; Z‐NX and L‐CC analyzed data; and Z‐NX and W‐GJ wrote the manuscript.
Acknowledgements
This study was supported in part by the National Natural Science Foundation of China (grant No. 81872084).
Data accessibility
Data will be available from the corresponding author upon reasonable request.
References
- 1. Clark DJ, Dhanasekaran SM, Petralia F, Pan J, Song X, Hu Y, da Veiga Leprevost F, Reva B, Lih T‐SM, Chang H‐Y et al. (2019) Integrated proteogenomic characterization of clear cell renal cell carcinoma. Cell 179, 964–983.e931. [DOI] [PMC free article] [PubMed] [Google Scholar]
- 2. Bray F, Ferlay J, Soerjomataram I, Siegel RL, Torre LA and Jemal A (2018) Global cancer statistics 2018: GLOBOCAN estimates of incidence and mortality worldwide for 36 cancers in 185 countries. CA Cancer J Clin 68, 394–424. [DOI] [PubMed] [Google Scholar]
- 3. Ferlay J, Colombet M, Soerjomataram I, Mathers C, Parkin DM, Pineros M, Znaor A and Bray F (2019) Estimating the global cancer incidence and mortality in 2018: GLOBOCAN sources and methods. Int J Cancer 144, 1941–1953. [DOI] [PubMed] [Google Scholar]
- 4. Ljungberg B, Albiges L, Abu‐Ghanem Y, Bensalah K, Dabestani S, Fernández‐Pello S, Giles RH, Hofmann F, Hora M, Kuczyk MA et al. (2019) European Association of Urology Guidelines on Renal Cell Carcinoma: the 2019 Update. Eur Urol 75, 799–810. [DOI] [PubMed] [Google Scholar]
- 5. Chen F, Zhuang X, Lin L, Yu P, Wang Y, Shi Y, Hu G and Sun Y (2015) New horizons in tumor microenvironment biology: challenges and opportunities. BMC Med 13, 45. [DOI] [PMC free article] [PubMed] [Google Scholar]
- 6. Wu T and Dai Y (2017) Tumor microenvironment and therapeutic response. Cancer Lett 387, 61–68. [DOI] [PubMed] [Google Scholar]
- 7. Liu Y, Guo J and Huang L (2020) Modulation of tumor microenvironment for immunotherapy: focus on nanomaterial‐based strategies. Theranostics 10, 3099–3117. [DOI] [PMC free article] [PubMed] [Google Scholar]
- 8. Arneth B (2019) Tumor microenvironment. Medicina (Kaunas) 56, 15. [DOI] [PMC free article] [PubMed] [Google Scholar]
- 9. Xiong Y, Wang Z, Zhou Q, Zeng H, Zhang H, Liu Z, Huang Q, Wang J, Chang Y, Xia Y et al. (2020) Identification and validation of dichotomous immune subtypes based on intratumoral immune cells infiltration in clear cell renal cell carcinoma patients. J Immunother Cancer 8, e000447. [DOI] [PMC free article] [PubMed] [Google Scholar]
- 10. Gajewski TF, Schreiber H and Fu YX (2013) Innate and adaptive immune cells in the tumor microenvironment. Nat Immunol 14, 1014–1022. [DOI] [PMC free article] [PubMed] [Google Scholar]
- 11. Yoshihara K, Shahmoradgoli M, Martinez E, Vegesna R, Kim H, Torres‐Garcia W, Treviño V, Shen H, Laird PW, Levine DA et al. (2013) Inferring tumour purity and stromal and immune cell admixture from expression data. Nat Commun 4, 2612. [DOI] [PMC free article] [PubMed] [Google Scholar]
- 12. Shah N, Wang P, Wongvipat J, Karthaus WR, Abida W, Armenia J, Rockowitz S, Drier Y, Bernstein BE, Long HW et al. (2017) Regulation of the glucocorticoid receptor via a BET‐dependent enhancer drives antiandrogen resistance in prostate cancer. Elife 6, e27861. [DOI] [PMC free article] [PubMed] [Google Scholar]
- 13. Priedigkeit N, Watters RJ, Lucas PC, Basudan A, Bhargava R, Horne W, Kolls JK, Fang Z, Rosenzweig MQ, Brufsky AM et al. (2017) Exome‐capture RNA sequencing of decade‐old breast cancers and matched decalcified bone metastases. JCI. Insight 2, e95703. [DOI] [PMC free article] [PubMed] [Google Scholar]
- 14. Alonso MH, Ausso S, Lopez‐Doriga A, Cordero D, Guinó E, Solé X, Barenys M, de Oca J Capella G, Salazar R et al. (2017) Comprehensive analysis of copy number aberrations in microsatellite stable colon cancer in view of stromal component. Br J Cancer 117, 421–431. [DOI] [PMC free article] [PubMed] [Google Scholar]
- 15. Luo J, Xie Y, Zheng Y, Wang C, Qi F, Hu J and Xu Y (2020) Comprehensive insights on pivotal prognostic signature involved in clear cell renal cell carcinoma microenvironment using the ESTIMATE algorithm. Cancer Med 9, 4310–4323. [DOI] [PMC free article] [PubMed] [Google Scholar]
- 16. Chen B, Chen W, Jin J, Wang X, Cao Y and He Y (2019) Data mining of prognostic microenvironment‐related genes in clear cell renal cell carcinoma: a study with TCGA database. Dis Markers 2019, 8901649. [DOI] [PMC free article] [PubMed] [Google Scholar]
- 17. Wan B, Liu B, Huang Y and Lv C (2020) Identification of genes of prognostic value in the ccRCC microenvironment from TCGA database. Mol Genet Genomic Med 8, e1159. [DOI] [PMC free article] [PubMed] [Google Scholar]
- 18. Zeng Q, Zhang W, Li X, Lai J and Li Z (2020) Bioinformatic identification of renal cell carcinoma microenvironment‐associated biomarkers with therapeutic and prognostic value. Life Sci 243, 117273. [DOI] [PubMed] [Google Scholar]
- 19. Chen B, Khodadoust MS, Liu CL, Newman AM and Alizadeh AA (2018) Profiling tumor infiltrating immune cells with CIBERSORT. Methods Mol Biol 1711, 243–259. [DOI] [PMC free article] [PubMed] [Google Scholar]
- 20. Zhang S, Zhang E, Long J, Hu Z, Peng J, Liu L, Tang F, Li L, Ouyang Y and Zeng Z (2019) Immune infiltration in renal cell carcinoma. Cancer Sci 110, 1564–1572. [DOI] [PMC free article] [PubMed] [Google Scholar]
- 21. Geissler K, Fornara P, Lautenschlager C, Holzhausen HJ, Seliger B and Riemann D (2015) Immune signature of tumor infiltrating immune cells in renal cancer. Oncoimmunology 4, e985082. [DOI] [PMC free article] [PubMed] [Google Scholar]
- 22. Chevrier S, Levine JH, Zanotelli VRT, Silina K, Schulz D, Bacac M, Ries CH, Ailles L, Jewett MAS, Moch H et al. (2017) An immune atlas of clear cell renal cell carcinoma. Cell 169, 736–749.e718. [DOI] [PMC free article] [PubMed] [Google Scholar]
- 23. Webster WS, Lohse CM, Thompson RH, Dong H, Frigola X, Dicks DL, Sengupta S, Frank I, Leibovich BC, Blute ML et al. (2006) Mononuclear cell infiltration in clear‐cell renal cell carcinoma independently predicts patient survival. Cancer 107, 46–53. [DOI] [PubMed] [Google Scholar]
- 24. Choueiri TK and Motzer RJ (2017) Systemic therapy for metastatic renal‐cell carcinoma. N Engl J Med 376, 354–366. [DOI] [PubMed] [Google Scholar]
- 25. Motzer RJ, Hutson TE, Tomczak P, Michaelson MD, Bukowski RM, Rixe O, Oudard S, Negrier S, Szczylik C, Kim ST et al. (2007) Sunitinib versus interferon alfa in metastatic renal‐cell carcinoma. N Engl J Med 356, 115–124. [DOI] [PubMed] [Google Scholar]
- 26. Hudes G, Carducci M, Tomczak P, Dutcher J, Figlin R, Kapoor A, Staroslawska E, Sosman J, McDermott D, Bodrogi I et al. (2007) Temsirolimus, interferon alfa, or both for advanced renal‐cell carcinoma. N Engl J Med 356, 2271–2281. [DOI] [PubMed] [Google Scholar]
- 27. Escudier B, Eisen T, Stadler WM, Szczylik C, Oudard S, Siebels M, Negrier S, Chevreau C, Solska E, Desai AA et al. (2007) Sorafenib in advanced clear‐cell renal‐cell carcinoma. N Engl J Med 356, 125–134. [DOI] [PubMed] [Google Scholar]
- 28. Motzer RJ, Penkov K, Haanen J, Rini B, Albiges L, Campbell MT, Venugopal B, Kollmannsberger C, Negrier S, Uemura M et al. (2019) Avelumab plus axitinib versus sunitinib for advanced renal‐cell carcinoma. N Engl J Med 380, 1103–1115. [DOI] [PMC free article] [PubMed] [Google Scholar]
- 29. Rini BI, Plimack ER, Stus V, Gafanov R, Hawkins R, Nosov D, Pouliot F, Alekseev B, Soulières D, Melichar B et al. (2019) Pembrolizumab plus axitinib versus sunitinib for advanced renal‐cell carcinoma. N Engl J Med 380, 1116–1127. [DOI] [PubMed] [Google Scholar]
- 30. Rofi E, Del Re M, Arrigoni E, Rizzo M, Fontanelli L, Crucitta S, Gianfilippo G, Restante G, Fogli S, Porta C et al. (2019) Clinical pharmacology of monoclonal antibodies targeting anti‐PD‐1 axis in urothelial cancers. Crit Rev Oncol Hematol 144, 102812. [DOI] [PubMed] [Google Scholar]
- 31. Afonso J, Santos LL, Longatto‐Filho A and Baltazar F (2020) Competitive glucose metabolism as a target to boost bladder cancer immunotherapy. Nat Rev Urol 17, 77–106. [DOI] [PubMed] [Google Scholar]
- 32. Paucek RD, Baltimore D and Li G (2019) The cellular immunotherapy revolution: arming the immune system for precision therapy. Trends Immunol 40, 292–309. [DOI] [PubMed] [Google Scholar]
- 33. Kasar S, Kim J, Improgo R, Tiao G, Polak P, Haradhvala N, Lawrence MS, Kiezun A, Fernandes SM, Bahl S et al. (2015) Whole‐genome sequencing reveals activation‐induced cytidine deaminase signatures during indolent chronic lymphocytic leukaemia evolution. Nat Commun 6, 8866. [DOI] [PMC free article] [PubMed] [Google Scholar]
- 34. Perez‐Carretero C, Hernandez‐Sanchez M, Gonzalez T, Quijada‐Álamo M, Martín‐Izquierdo M, Hernández‐Sánchez J‐M, Vidal M‐J, García de Coca A, Aguilar C, Vargas‐Pabónet M et al. (2020) Chronic lymphocytic leukemia patients with IGH translocations are characterized by a distinct genetic landscape with prognostic implications. Int J Cancer 147, 2780–2792. [DOI] [PubMed] [Google Scholar]
- 35. Fan Z, Pei R, Sha K, Chen L, Wang T and Lu Y (2020) Comprehensive characterization of driver genes in diffuse large B cell lymphoma. Oncol Lett 20, 382–390. [DOI] [PMC free article] [PubMed] [Google Scholar]
- 36. Li M, Su X, Wang Y, Fan L, Chai J, Li P, Zhao D, Liu Y, Ma J, Wang K et al. (2020) Lineage‐negative lymphoma with a helper innate lymphoid cell phenotype. Virchows Arch 476, 285–293. [DOI] [PubMed] [Google Scholar]
- 37. Panea RI, Love CL, Shingleton JR, Reddy A, Bailey JA, Moormann AM, Otieno JA, Ong’echa JM, Oduor CI, Schroeder KMS et al. (2019) The whole‐genome landscape of Burkitt lymphoma subtypes. Blood 134, 1598–1607. [DOI] [PMC free article] [PubMed] [Google Scholar]
- 38. White BS, Lanc I, O'Neal J, Gupta H, Fulton RS, Schmidt H, Fronick C, Belter EA, Fiala M, King J et al. (2018) A multiple myeloma‐specific capture sequencing platform discovers novel translocations and frequent, risk‐associated point mutations in IGLL5. Blood Cancer J 8, 35. [DOI] [PMC free article] [PubMed] [Google Scholar]
- 39. D'Agostino M, Zaccaria GM, Ziccheddu B, Rustad EH, Genuardi E, Capra A, Oliva S, Auclair D, Yesil J, Colucci P et al. (2020) Early relapse risk in patients with newly diagnosed multiple myeloma characterized by next‐generation sequencing. Clin Cancer Res 26, 4832–4841. [DOI] [PubMed] [Google Scholar]
- 40. Qin Z, Zhang X, Chen Z and Liu N (2020) Establishment and validation of an immune‐based prognostic score model in glioblastoma. Int Immunopharmacol 85, 106636. [DOI] [PubMed] [Google Scholar]
- 41. Liang F, Qu H, Lin Q, Yang Y, Ruan X, Zhang B, Liu Y, Yu C, Zhang H, Fang X et al. (2015) Molecular biomarkers screened by next‐generation RNA sequencing for non‐sentinel lymph node status prediction in breast cancer patients with metastatic sentinel lymph nodes. World J Surg Oncol 13, 258. [DOI] [PMC free article] [PubMed] [Google Scholar]
- 42. Tsou P, Katayama H, Ostrin EJ and Hanash SM (2016) The emerging role of B cells in tumor immunity. Cancer Res 76, 5597–5601. [DOI] [PubMed] [Google Scholar]
- 43. Yuen GJ, Demissie E and Pillai S (2016) B lymphocytes and cancer: a love‐hate relationship. Trends Cancer 2, 747–757. [DOI] [PMC free article] [PubMed] [Google Scholar]
Associated Data
This section collects any data citations, data availability statements, or supplementary materials included in this article.
Data Availability Statement
Data will be available from the corresponding author upon reasonable request.


