Abstract
Soil microorganisms can be altered by plant invasion into wetland ecosystems and comprise an important linkage between phosphorus (P) availability and soil carbon (C) chemistry; however, the intrinsic mechanisms of P and C transformation associated with microbial community and function are poorly understood in coastal wetland. In this study, we used a sequential fractionation method and 13C nuclear magnetic resonance (NMR) spectroscopy to capture the changes in soil P pools and C chemical composition with bare flats (BF), native Phragmites australis(PA), and invasive Spartina alterniflora(SA), respectively. The responses of the soil microbial community using phospholipid fatty acid (PLFA) profiling and function indicated by nine enzyme activities associated with C, nitrogen (N), and P cycles were also investigated. Compared to PA and BF, SA invasion significantly (P < 0.05) changed P pools and mainly increased the available P by 17.5 and 37.0%, respectively. The presence of the plants (SA and PA) significantly (P < 0.05) altered the soil C chemical composition mainly by affecting the aliphatic functional groups, resulting in a lower alkyl C/O-alkyl C ratio value. Compared to BF and SA, PA significantly (P < 0.05) increased arbuscular mycorrhizal fungi (AMF) abundance. Soil enzyme activity, especially for the P and C cycle enzymes, was also affected by plant species with the highest geometric mean enzyme and hydrolase activity for the PA zone. We also found that soil C compositions and P pools were associated with microbial community structure and enzyme activity, respectively. However, little interaction between C and P was found on either soil microbial composition or soil enzyme activity variation. Further, microbial community composition was tightly correlated with the soil P compared to soil C chemistry, while enzyme activity showed more response with soil C chemistry compared to soil P pool changes.
1. Introduction
Wetlands form a critical interface between uplands and adjacent water bodies, and act as transition and buffer zones between terrestrial and marine ecosystems, due to their special position in the landscape. These ecosystems are complex but fragile as they are easily invaded by exotic plant species, which threaten native plants and change ecosystem functions.1,2Spartina alterniflora (SA), which is native to North America, was introduced to eastern China for coastal protection and sediment stabilization in 1979.3 Since then, the SA population has expanded rapidly, invading bare flat (BF) land and displacing native plants. Thus, SA has become one of the dominant invasive species found in the coastal wetlands of eastern China and is most widely distributed on the Jiangsu coast.2
The spatial and temporal distribution characteristics of phosphorus are important indicators of the eutrophication risks, productivity, and functions of wetland ecosystems.4 Thus, soil P transformation and transportation in wetland soils have received considerable attention.5,6S. alterniflora invasion would definitely affect P cycles in the wetland ecosystem. The dynamics of phosphorus concentrations and fractions is thought to be extremely complex, due to the intermittent flooding7 and the diversity of plant species,8 and also involves plant–microbe interactions.9 However, soil P transformation was observed to be tightly linked with C cycles. Firstly, the anaerobic condition in the tide period could release more available P since iron and manganese minerals are sensitive to redox changes,10 while this redox condition also usually impedes the decomposition of soil organic carbon (SOC).11 Secondly, SA has greater biomass and a more developed root system than native plants such as Suaeda salsa and Phragmites australis(PA). Thus, SA invasion could result in a different P utilization efficiency, but also might provide a higher input of plant resides with a slower decomposition rate of SOC. Further, microbial communities and functions have been shown to provide a different feedback on nutrient availability,12 although SOC is an important regulator of the soil microbial community.13 Fungi are able to utilize recalcitrant organic matter when the soil organic matter decomposition rates and nutrient (i.e., P) availability are low.14,15 For example, Huang et al.7 reported that the increased C input induced by vegetation in coastal wetland soils significantly affects phosphatase activity, which is a key factor for soil P mineralization. Gao et al.16 illustrated that plant type and distribution can also alter tidal hydrodynamics and the lateral transportation of sediments, which further affects the soil C and P cycle.
There is a large body of reports on soil organic C sequestration, and their relationships with microbial community composition under SA invasion, since wetland ecosystems accumulate 20–30% of global soil carbon storage in 5–8% of the land area and have the highest productivity per unit area.17 Importantly, changes in soil conditions induced by SA invasion could simultaneously trigger fluctuations in the transformation of P and C, and subsequently impact microbial community structure; then, their feedback on the P and C dynamics would largely change the P and C cycles in wetland systems. However, the linkage between P and C transformations and microbial community composition and function, and their interacting mechanisms remain poorly understood.
In the present study, we investigated the forms and availability of P and C composition in the soil from three wetland communities in northern China. The samples were taken from the wetland invaded by SA, occupied by the dominant emergent species Phragmites australis (PA), and the bare flat (BF) land nearby. We hypothesized that (i) SA invasion would increase soil P availability; (ii) SA invasion would repress SOC decomposition, resulting in lower C recalcitrance under anaerobic conditions; and (iii) C chemistry interaction with changes in P pools would alter microbial community and function.
2. Results and Discussion
2.1. Changes in Soil P Fractionation
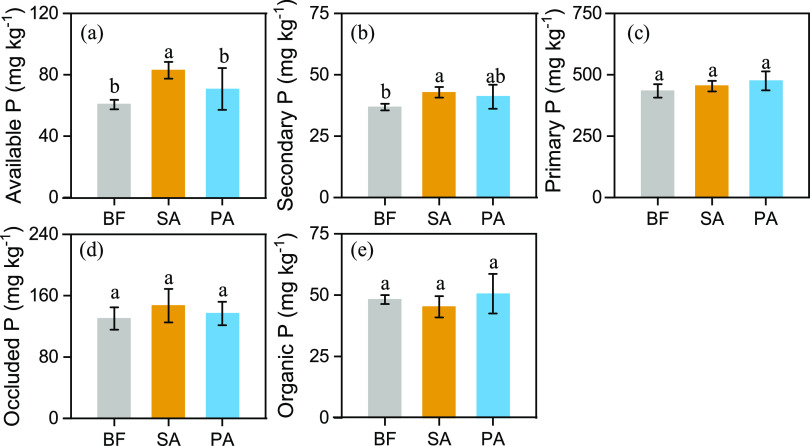
The differences in soil P fractionation in the three wetland communities are shown in Figure 1. The concentrations of the different soil P fractions were ordered as follows: primary P > occluded P > available P > Po > secondary P. The SA samples had the highest level of soil-available P of all three wetland communities, with a concentration of 76.58–89.40 mg kg–1. Moreover, compared with the BF samples, the concentrations of secondary mineral P pools in the topsoil were significantly greater in the SA samples, at concentrations of 40.56–46.14 mg kg–1. Conversely, Phragmites australis (PA) did not have a significant effect on P fractionation.
Figure 1.
P fractions obtained by sequential extraction from coastal wetland soils, including bare flat (BF) land, land invaded by Spartina alterniflora (SA), and land occupied by Phragmites australis (PA). (a) Available P = Resin-P + NaHCO3-Pi; (b) secondary P; (c) primary P; (d) occluded P; (e) organic P = NaOH-Po + NaHCO3-Po. Vertical bars indicate standard deviations of the mean (n = 5). For each parameter, different letters indicate significant differences between means at P < 0.05.
2.2. Relative Abundances of C Components
The 13C NMR spectral results showed that there were different relative abundances of aliphatic functional groups among the soil samples from the three wetland communities, while the aromatic functional groups were similar (Figure 2). The relative intensities of the four C components were ordered as follows: O-alkyl C > alkyl C > aromatic C > carbonyl C. The BF soil had the highest relative abundance of alkyl C and the lowest relative abundance of O-alkyl C, which resulted in the highest A/O-A ratio. Compared with BF, SA had a weaker promotion effect on O-alkyl C functional groups than native PA samples. This, in combination with the higher alkyl C component in SA samples, led to a higher value of A/O-A in SA samples than in PA samples. Additionally, the aromaticity did not significantly differ among the samples from the three wetland communities.
Figure 2.
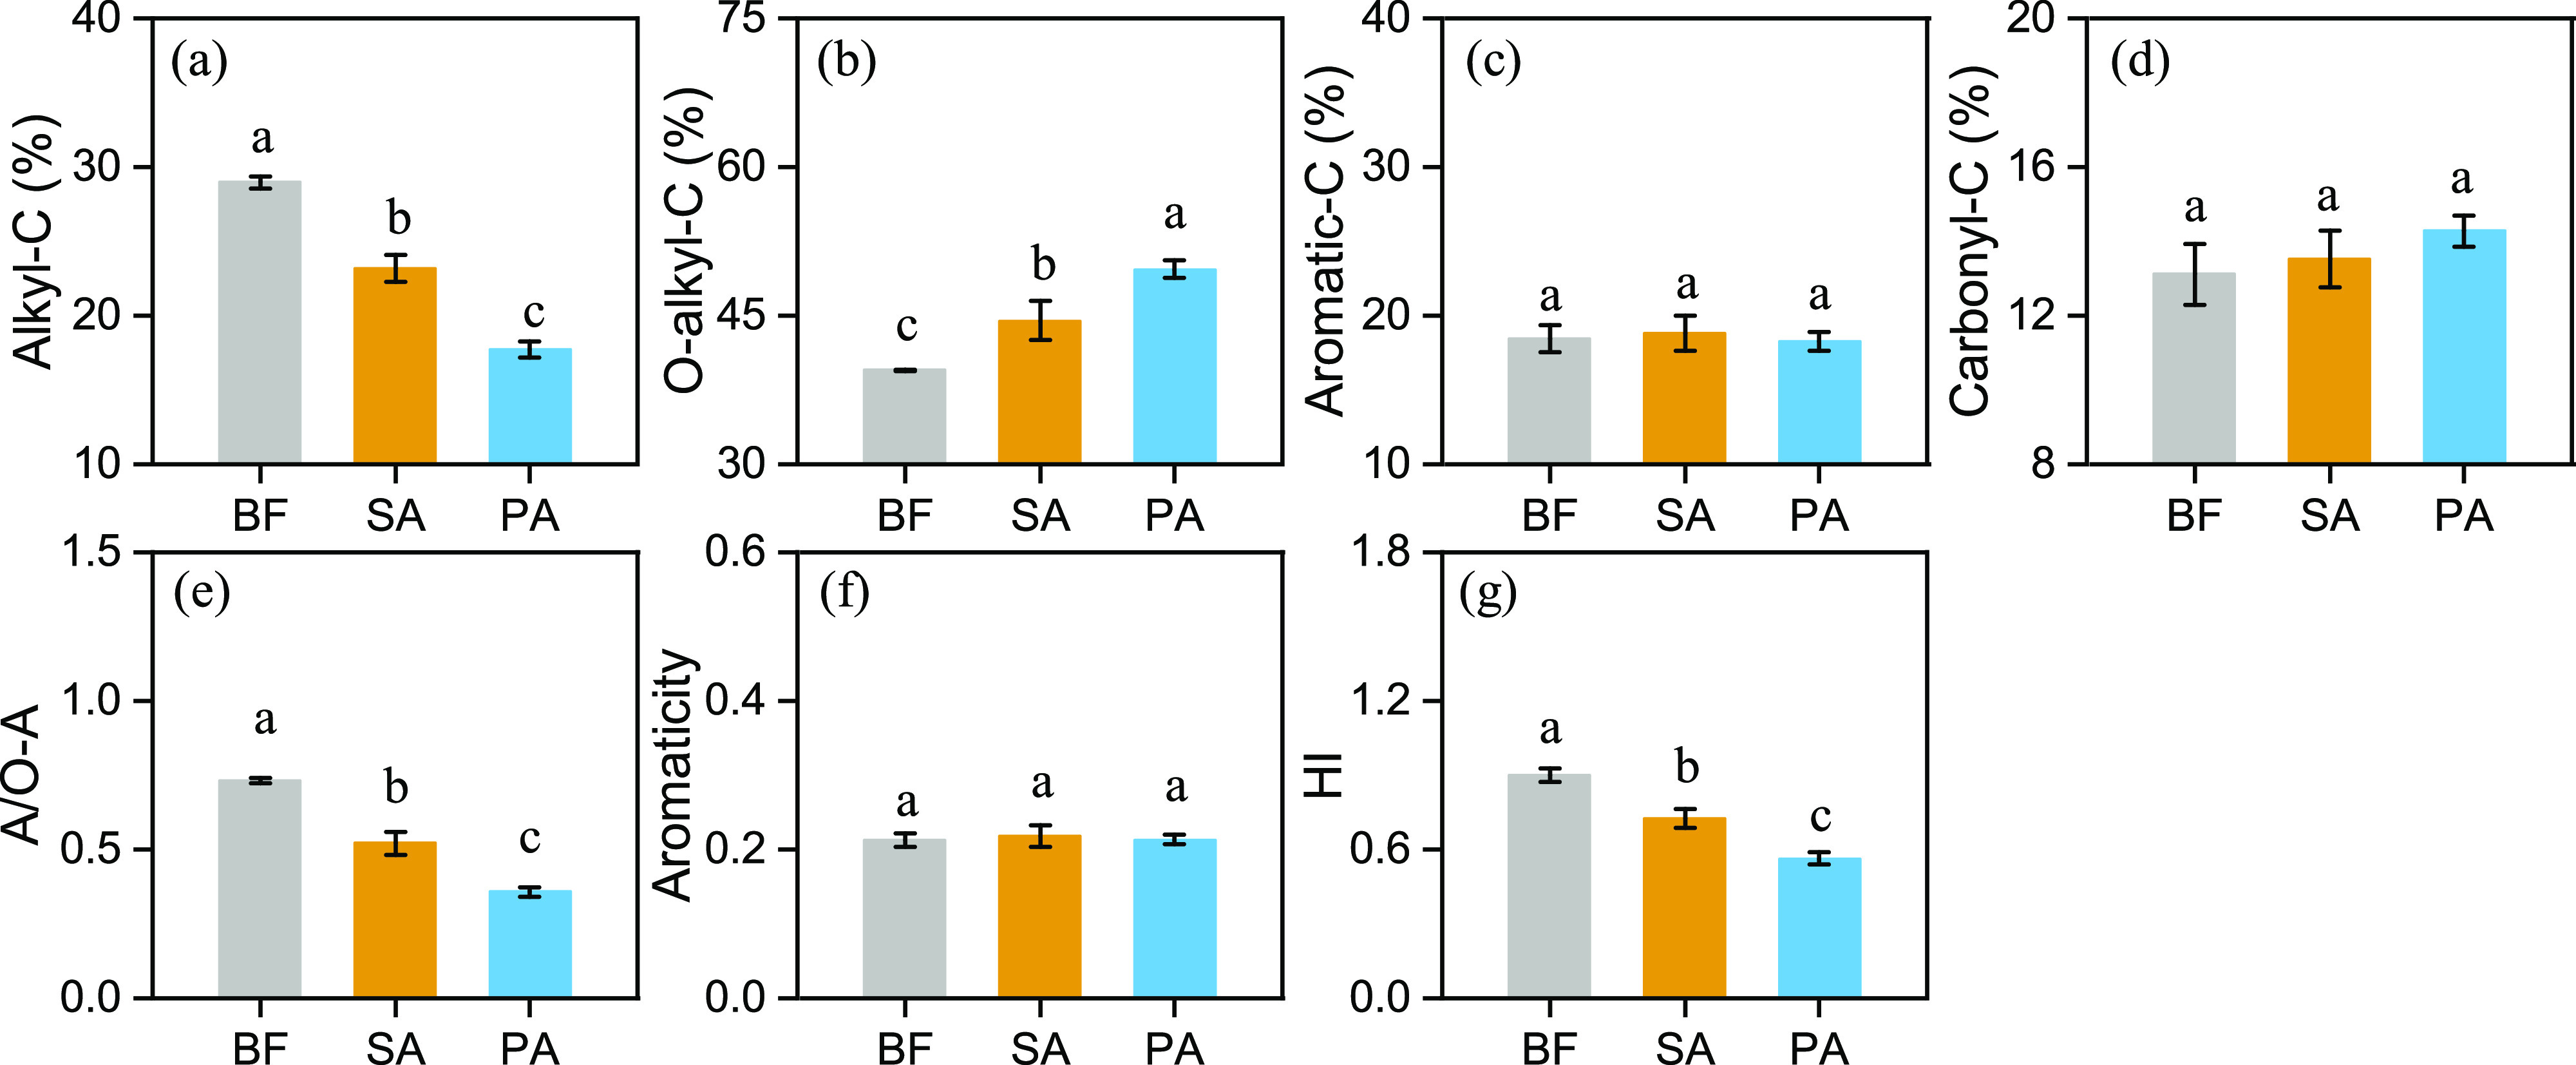
Relative intensities (%) of eight shift regions of carbon-13 cross-polarization magic angle spinning nuclear magnetic resonance (13C CPMAS NMR) spectra obtained from the wetland soil samples. (a) Alkyl-C; (b) O-alkyl-C; (c) aromatic-C; (d) carbonyl-C; (e) A/O-A; (f) aromaticity; and (g) HI. Soil samples were collected from three areas of wetland: bare flat (BF) land, land invaded by Spartina alterniflora (SA), and land occupied by Phragmites australis (PA). Vertical bars indicate standard deviations of the mean (n = 3). For each parameter, different letters indicate significant differences between means at P < 0.05.
2.3. Soil Phospholipid Fatty Acid (PLFAs) and Enzyme Activity
The microbial species and their functions in the three wetland communities were examined using 19 PLFA biomarkers (Figure 3). Soil bacteria were the dominant soil microorganisms in the BF samples and the native (PA) and invasion (SA) soils. As illustrated in Figure 3, the invasion of SA led to increased abundance of bacterial PLFAs (P > 0.05), with an average enhancement of 28.05% compared to BF. S. alterniflora invasion particularly promoted G– activity, which resulted in a lower G+/G– value than in the mudflat samples. However, fungal PLFA content did not vary significantly among the samples, and a similar result was obtained for the soil F/B ratio values.
Figure 3.
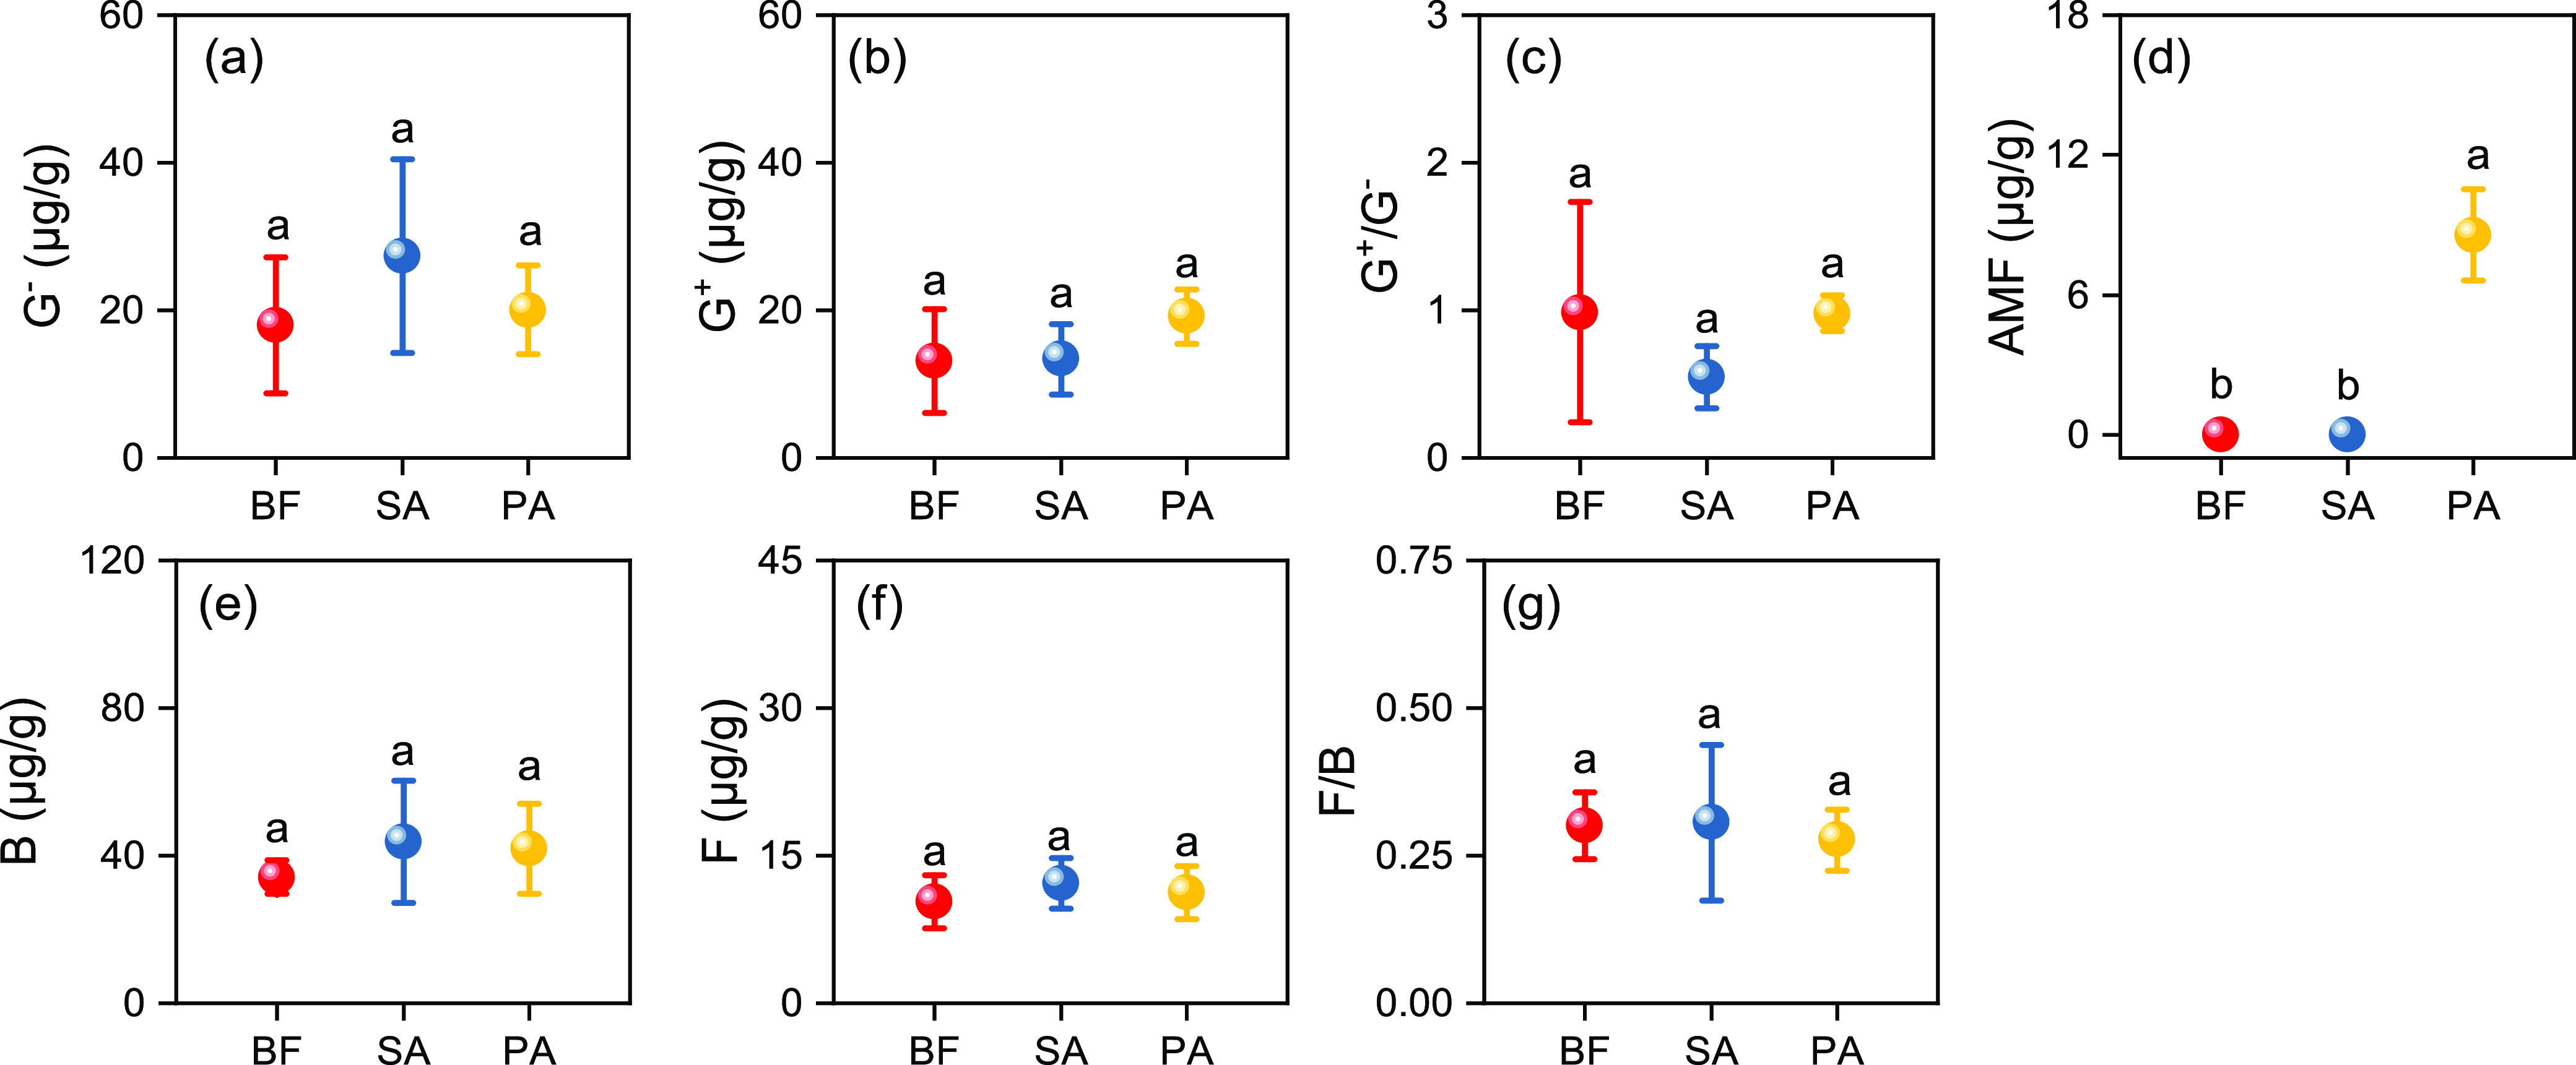
Phospholipid fatty acid (PLFA) biomarker concentrations obtained from the wetland soil samples. (a) G–; (b) G+; (c) G+/G–; (d) arbuscular mycorrhizal fungi (AMF); (e) B; (f) F; and (g) F/B. Soil samples were collected from three areas of wetland: bare flat (BF) land, land invaded by Spartina alterniflora (SA), and land occupied by Phragmites australis (PA). Soil fungi (F), Gram-positive (G+) bacteria, Gram-negative (G–) bacteria, and arbuscular mycorrhizal fungi (AMF) were identified based on their specific PLFA biomarkers. B represents the total bacteria as the sum of G+, G–, 15:0, and 17:0; G+/G– represents the ratio of Gram-positive to Gram-negative bacteria; and F/B represents the ratio of fungi to bacteria. Vertical bars indicate the standard deviation of the mean (n = 3). For each parameter, different letters indicate significant differences between means at P < 0.05.
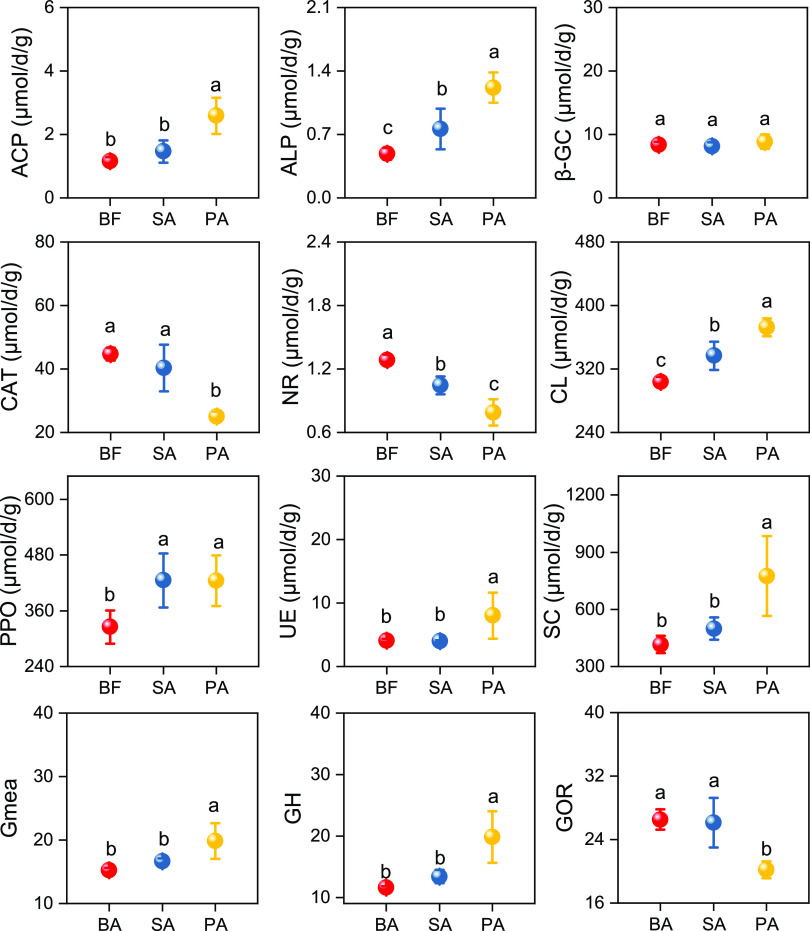
The changes in soil enzyme activity are illustrated in Figure 4. In general, compared to the BF samples, native Phragmites australis significantly facilitated soil hydrolase enzyme activity, but mitigated oxidoreductase enzyme activity (P < 0.05). The samples from areas populated with plants (SA and PA) possessed higher alkaline phosphatase (ALP), cellulase (CL), and polyphenol oxidase (PPO) activity than BF samples. However, the SA and PA samples displayed reduced nitrate reductase (NR) activity compared to BF samples, with a greater reduction in PA soil. Furthermore, sucrase (SC) was the most active enzyme among all the tested enzymes and exhibited the highest activity in the PA samples, at 774.25 ± 209.52 μmol g–1 day–1. The second and third most active enzymes were PPO and CL, and their activities were lowest in the BF samples, at 325.30 ± 35.86 and 303.66 ± 6.49 μmol g–1 day–1, respectively.
Figure 4.
Enzyme activities, the geometric means (Gmea) of the assayed enzyme activities, and the hydrolase (GH) and oxidoreductase (GOR) activities observed in the wetland soil samples. Soil samples were collected from three areas of wetland: bare flat (BF) land, land invaded by Spartina alterniflora (SA), and land occupied by Phragmites australis (PA). The activities of acid phosphatase (ACP), alkaline phosphatase (ALP), β-glucosidase (β-GC), catalase (CAT), nitrate reductase (NR), cellulase (CL), polyphenol oxidase (PPO), urease (UE), and sucrase (SC) are shown. Vertical bars indicate standard deviation of the mean (n = 3). For each parameter, different letters indicate significant differences between means at P < 0.05.
2.4. Linking Soil Microorganisms to C Composition and P Fractionation
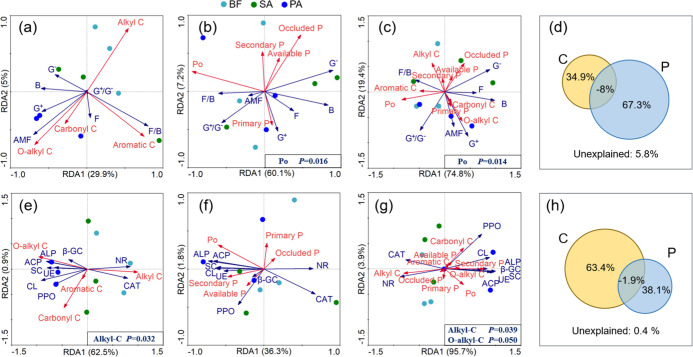
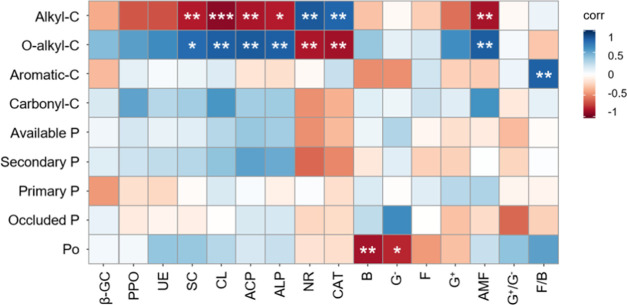
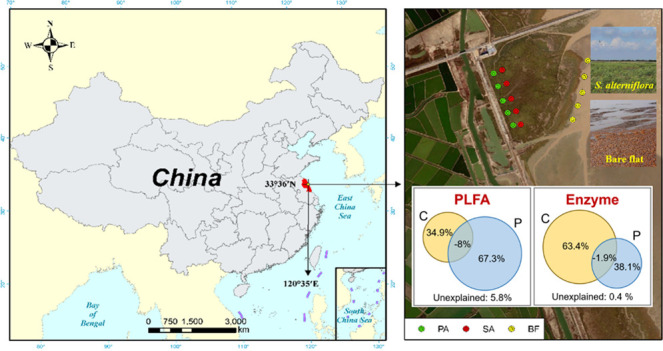
The redundancy analysis (RDA) allowed for visualization of the relationships between C composition, P fractionation, and microorganisms (Figure 5). The soil C composition explained 34.9% (Figure 5a) and 63.4% (Figure 5e) of the total variation in microbial community composition and enzyme activity, respectively. Coupled with Monte Carlo permutation tests and Pearson correlation analysis (Figure 6), the results indicated that alkyl-C was the most relevant factor (P = 0.032) for enzyme activity and had a significant positive correlation with NR and CAT (P < 0.01), and a significant negative correlation with CL, SC, ACP, and ALP (P < 0.05). Moreover, soil alkyl C and O-alkyl C pools are also important regulators of AMF. However, based on RDA analysis, none of the factors had a significant effect on microbial community composition.
Figure 5.
Redundancy analysis (RDA) for (a) soil microbial community components and carbon (C) composition; (b) microbial community components and P fractionation; (c, d) linkage of soil microbial community components and C and P; (e) enzyme activity and C composition; (f) enzyme activity and P fractionation; and (g, h) the linkage of soil enzyme activity and C and P in different wetland soil samples. Soil samples were collected from three areas of wetland: bare flat (BF) land, land invaded by Spartina alterniflora (SA), and land occupied by Phragmites australis (PA). Fitted site scores from BF, SA, and PA samples are displayed by circles, triangles, and squares, respectively. Affected factors are denoted as red arrows, and influencing factors are denoted by blue arrows.
Figure 6.
Pearson correlation diagram for the relationships between soil C and P pools and microbial community components and enzyme activity. Blue represents positive correlations and red indicates negative. Statistical significance is indicated by asterisks: *P < 0.05, **P < 0.01, and ***P < 0.001 (n = 9).
For the soil P fractions, the variation explained 67.3% (Figure 5b) and 38.1% (Figure 5f) of the changes in PLFAs and enzyme activity, respectively, and soil Po pool was the most relevant factor (P = 0.016) for microbial community composition. It is worth noting that bacterial and G– PLFAs were negatively correlated to Po (P < 0.05; Figure 6).
Furthermore, we analyzed the complex effects of the soil C compositions and P pools together on PLFAs and enzyme activity in Figure 5c,d,g,h. We found that soil C and P together could explain 94.2% of the variation in microbial community composition and 99.6% for enzyme activity. The explained percentages are almost equal to the sum of the effects of C and P individually.
3. Discussion
Sequential fractionation of soil P and 13C NMR spectroscopy were employed to illustrate the alteration in soil P pools and C chemical forms after the invasion of SA. Primary P (HCl-P) was the dominant form of P in all three vegetation cover soils (Figure 1), which may be related to the high pH and salinity of coastal wetlands.18 The little variation of primary P among the samples demonstrated that HCl-P originated from soil minerals rather than plant residues. Soil P fractions that display obvious fluctuations can be characterized as mobilizable P pools.7 In the present study, SA invasion significantly increased the amounts of soil-available P compared to PA and BF samples (Figure 1). The increase in soil-available P may be attributed to the well-developed root tissue of SA and its exudates.19 Microbial decomposers can mobilize P as a nutrient for their growth. The increase in soil-available P may be caused by the microbial decomposers associated with plant roots, as a result of the observation that PLFAs and P concentrations were tightly linked (Figure 5). S. alterniflora is mainly located in the intertidal zone, where the periodic floods and low tides result in alternating periods of wetting and drying. The distribution of secondary mineral P (Fe/Al-P) is sensitive to oscillations in redox potential caused by the alternation of dry and wet conditions.20 Compared to BF, SA increased secondary mineral P concentrations, which indicated that the growth environment of SA favors the formation of Fe/Al-P.7
The results from the 13C NMR spectroscopy indicated that O-alkyl C was the dominant form of C in the coastal wetlands, accounting for more than 40% of the soil C relative intensity (Figure 2). Among the soil samples, the PA samples had the highest proportion of O-alkyl C and the lowest A/O-A ratio values, indicating that PA may have the highest decomposition potential.21 Further, SA had a higher HI ratio compared to PA, which is an indicator of the stability of the combination of soil C and aggregation; the larger the ratio value, the higher the soil C stability resulting from aggregation.11 Taken together, the results seemly showed that SA invasion elevates the degree of SOM recalcitrance in the soil compared to that in soils occupied by native plants (P. australis). However, we observed no significant differences between SA and PA in SOC contents (Figure S1). This demonstrated two different SOC stabilization mechanisms between SA and PA. Compared to the elevated SOC recalcitrance for SOM originated from SA, C protection mechanisms for PA may be related to the chemical protection of mineral-related C.22 Here, BF with the highest A/O-A ratio and HI value indicated that the labile C had been largely consumed, thus resulting in high stability.23
The microbial community structure based on PLFAs and a series of hydrolase and oxidoreductase activities related to soil nutrient cycling were also observed. In detail, soil PPO, CL, SC, and β-GC were carbon-related enzymes, NE and NR were nitrogen-related enzymes, and ACP and ALP were phosphorus-related enzymes. The soil enzyme activity differed among the soils occupied by different plants, while the microbial community composition did not appear to vary using the PLFA approach (Figures3 and 4). Compared with the BF samples, the presence of plants promoted the activities of ALP, CL, and PPO, but reduced the activity of NR. Further, compared to SA and BF, PA induced a higher GH activity but a lower GOR activity (Figure 4). This might be due to a higher demand of P for SA; thus, more GOR enzymes were released to decompose SOC to acquire more P, since P is the limiting factor for microbial growth.11,23
The linkages between soil C forms, P fractions and soil PLFAs, and enzyme activity were further explored through RDA and Pearson correlation analyses. We found that soil C composition and P together could explain 94.2 and 99.6% of the shift in microbial community composition and functions (Figure 5d,h). Unexpectedly, little interaction existed between these two factors and microbial community composition or function. Further, more than soil C, soil P composition explained the soil microbial community structure change; however, this was the opposite for soil enzyme activity. This phenomenon might be ascribed to the fact that P was the relatively limited factor for microbial growth compared to C, and thus a greater SOC decomposition is needed to fulfill the P demand in addition to energy, as mentioned above.23 According to the Pearson correlation analysis, the bacterial and G– biomass had negative effects on soil Po. Parallel results have previously been found in the Yeyahu Wetland, where bacteria have a crucial function in soil P transformation and are involved in feedback on various P fractions.8 In accordance with the observation reported by Teng et al.,8 we also observed that bacterial PLFAs dominated the soil microbial community in the bare mudflats as well as in the soils inhabited by native and invasive plants. Gram-negative bacteria may promote the production of phosphatase and further increase the availability of soil P.24 In the present study, compared to BF, SA invasion facilitated the growth of bacteria (Figure 3) and then resulted in higher Po concentrations (Figure 1), although the increase in magnitude is not significant.
The relative intensities of aliphatic functional groups were the most significant impact factors and mainly regulated the activities of CL, SC, ACP, NR, CAT, and ALP. CL had a positive effect on O-alkyl C, and an inverse relationship with alkyl C (Figures5 and 6). CL catalyzes the degradation of cellulose, which can be characterized by O-alkyl C. In other words, a greater abundance of O-alkyl C, as indicated by higher relative intensity, can promote the activity of CL. It is worth noting that aromatic C had a progressively increasing effect on F/B. It has been reported that fungi prefer to decompose recalcitrant organic matter under conditions of low nutrient availability.14,15 Unexpectedly, in the present research, no significant differences were found among the three treatments in either the F/B ratio or the soil aromatic C intensity. Microbial community might prefer aliphatic functional groups to aromatic C based on reduced energy cost associated with their decomposition.
4. Conclusions
S. alterniflora invasion significantly enhanced available P concentrations in the soil (P < 0.05), while native plants (P. australis) had no significant effect on soil P fractionation. The presence of the plants mainly affected the C chemical composition mainly observed with aliphatic functional groups. Compared to the native plants, S. alterniflora invasion led to higher A/O-A ratio values and elevated the recalcitrance of the SOC. Furthermore, changes in soil C and P pools affected soil microbial community structure and enzyme activity. Soil P pools accounted for a greater proportion of the changes in soil microbial community structure than did soil C forms, however, which was the opposite for soil enzyme activity. The present results unveil a new viewpoint for understanding different soil P and C pools in combination with variations in enzyme activities and microbial communities in wetland ecosystems.
5. Materials and Methods
5.1. Site Description and Sample Collection
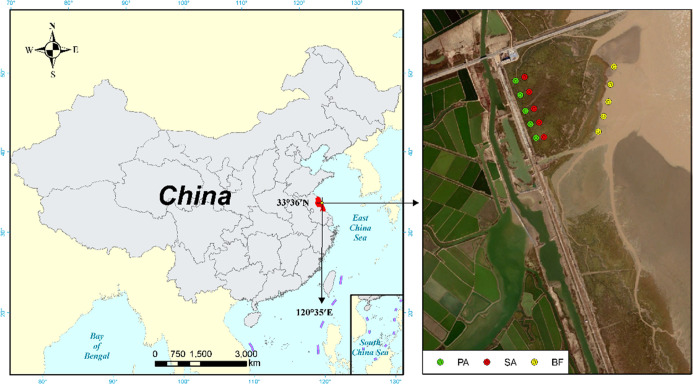
The study was carried out in Yancheng National Wetland Reserve (33°26′N, 120°77′E) in Jiangsu Province, China. The area is located in a warm temperate zone and is mainly affected by maritime and continental climates. The study site has a mild mean yearly temperature of 12.6 °C and a mean annual rainfall of 1040 mm. S. alterniflora was introduced into the region by the United States in 1982 and subsequently invaded the habitat of native plants extensively. The samples (0–20 cm) were collected from the wetland invaded by SA, occupied by the dominant emergent species (PA), and the bare flat (BF) land nearby, respectively (Figure 7). The study area is about 1 km × 1 km, and the distance between two sample points is about 150 m. Soil samples were collected in April 2019. The samples were partially kept at 4 °C and freeze-dried before using for microbial analyses and the remaining samples were air-dried and then sieved (2 mm) for further analysis.
Figure 7.
Location map of the study sites in Yancheng National Wetland Reserve, China. BF, SA, and PA represent samples taken from bare flat land, land invaded by S. alterniflora growing, and land occupied by P. australis growing, respectively.
5.2. Sequential Extraction of Soil P
The Tiessen sequential P extraction method was used to characterize the amounts and forms of P in the soil samples.25 Air-dried soil samples (0.5 g) were processed sequentially as follows: addition of deionized water with one resin strip (Sinopharm Chemical Reagent Co., Ltd.); 0.5 M NaHCO3 (pH 8.5); 0.1 M NaOH; 1 M HCl; and H2SO4 and H2O2 digested at 360 °C. The soil samples were subjected to a reciprocating shaker at 180 rpm for 16 h after the addition of each solution, followed by centrifugation for 10 min at 8000 rpm at 0 °C and filtering through Whatman No. 42 filter paper. The NaHCO3 and NaOH extractions were divided into two portions to quantify the contents of total P and inorganic P (Pi). Pi concentrations were measured directly from one aliquot of the extracts, while total P was measured after the digestion of another aliquot with 10 mL 0.9 M H2SO4 and 0.5 g of ammonium persulphate at 330 °C. The soil organic P (Po) was calculated based on the difference between total P and Pi.
An ultraviolet spectrometer (UV 2500, Japan) was used to measure the P concentration of the supernatants and the digestion sample based on the ascorbic acid molybdenum blue method.26 Each of the seven fractions represents a specific P pool.27 In detail, resin-P and NaHCO3-Pi are considered as available P pools, which can be easily taken up by crops. NaHCO3-Po and NaOH-Po were assigned as the Po pools. NaOH-Pi is considered to be a secondary mineral P with low utilization by plants. HCl-P indicates the primary mineral P pool that binds calcium and is released by the weathering process. Moreover, residual-P represents the occluded P pool, which is least likely to be taken up by crops due to its particularly low solubility.
5.3. Carbon-13 Nuclear Magnetic Resonance (NMR) Spectroscopy
13C NMR spectroscopy was employed to analyze soil C composition. Soils were processed eight times with 50 mL of HF (10%), and then four times with hydrogen peroxide. Subsamples were packed in a 4 mm zirconia rotor and spun at 6 kHz in a Bruker Avance III 400 spectrometer (Bruker BioSpin, Rheinstetten, Germany) with the resonance frequency set at 100.625 MHz for 13C. To decouple the pulse program, 1000 μs of contact time was coupled with 0.5 s of relaxation delay, a ramp contact, and a small phase incremental alternation with 64 steps (SPINAL64).28 Eight soil C components were quantified by calculating the corresponding chemical shift values of the spectra obtained as described by Shrestha et al.29 The primary chemical compositions of C were expressed as follows: alkyl C (0–45 ppm), O-alkyl C (45–110 ppm), aromatic C (110–160 ppm), and carbonyl C (160–220 ppm) All manual integration procedures were completed using MestReNova software. Three ratios were calculated: (1) soil alkyl C/O-alkyl C (A/O-A); (2) aromatic C/(alkyl C + O-alkyl C + aromatic C), which represented the aromaticity; and (3) (alkyl C + aromatic C)/(O-alkyl C + carbonyl C), which represented the hydrophobicity (HI) ratio. These ratios were considered to be indicators of the degree of decomposition, the complexity of the molecular structure, and the hydrophobicity of the SOC.22
5.4. Phospholipid Fatty Acid (PLFA) Analysis
The soil microbial community composition was analyzed under different P treatments by measuring soil PLFA concentrations. A chloroform–methanol–citrate buffer mixture (1:2:0.8, v/v/v; 0.15 M, pH 4.0) was used to extract the PLFAs from the lyophilized soil samples.30 The obtained fatty acid methyl esters were isolated and distinguished on a gas chromatograph (Agilent 7890 N, Wilmington, DE) equipped with a MIDI Sherlock Microbial Identification System (version 4.5; MIDI, Newark, NJ). Chloroform, acetone, and methanol were added to the middle of the Supelclean Solid Phase Extraction Tubes that had been washed with acetone and chloroform to dissolve the glycolipid. This step was followed by saponification, methylation, and extraction steps, and finally 100 μL of chromatographically pure n-hexane was added to dissolve the sample to be tested. Based on 19:0 fatty acid methyl ester ratios, the abundance of each PLFA was calculated and presented as μg g–1 soil.
Soil fungi, Gram-positive bacteria (G+), Gram-negative bacteria (G–), and AMF were identified based on their specific PLFA biomarkers. In detail, the biomarkers included i14:0, i15:0, a15:0, i16:0, i17:0, and a17:0 for G+ bacteria; 16:1w7c, 18:1w7c, cy17:0, and cy19:0 for G– bacteria; 10Me16:0, 18:2w6c, and 18:1w9c for fungi; and 16:1w5c for AMF.30,31 To assess the changes in microbial community composition caused by different plant covers in the wetland soils, the ratios of fungi to bacteria (F/B, where bacteria is the sum of G+, G–, 15:0, and 17:0) and of G+ to G– (G+/G–) were further calculated.
5.5. Microbial Activity
A series of hydrolases and oxidoreductases associated with soil P and C cycles were assessed to quantify the functional capacities of the microbes. Soil acid phosphatase (ACP) and alkaline phosphatase (ALP) activities were determined as described by Tabatabai.32 The activity of β-glucosidase (β-GC) was calculated from the quantity of p-nitrophenol released from the samples using a colorimetric method.33 Soil sucrase (SC) and urease (UE) activities were analyzed using sodium thiosulfate titration and the hypochlorite-alkaline phenol method as described by Guan.34 A colorimetric method was used to determine nitrate reductase (NR) activity,34 and cellulase (CL) activity was determined according to Deng and Tabatabai.35 Catalase (CAT) activity was analyzed by measuring the amount of O2 evolved following H2O2 decomposition, while polyphenol oxidase (PPO) activity was analyzed according to the method described by Montgomery and Sgarbieri.36 The enzyme activities were presented in μmol g–1 day–1. In addition, the geometric mean (Gmea) of the measured enzyme activities and the hydrolase (GH) and oxidoreductase (GOR) activities were calculated as follows
5.6. Calculations and Statistical Analysis
The statistical analysis of the influence of the three wetland community soil parameters was performed using the Duncan method (P = 0.05) and one-way analysis of variance (ANOVA) using SPSS 17.0. Redundancy analysis (RDA) was conducted to further explore the relationships between C composition and PLFAs coupled with soil microbial enzyme activity, and P pools and PLFAs combined with soil microbial enzyme activity. RDA was performed using Canoco 4.5. The Pearson correlation analysis was performed using R 3.6.2 (R Core Team, 2016) to simultaneously explore the linear correlations within the measured parameters.
Acknowledgments
This work was funded by the National Key Research and Development Program of China (No. 2017YFC0506006) and the National Natural Science Foundation of China (No. 41671304).
Supporting Information Available
The Supporting Information is available free of charge at https://pubs.acs.org/doi/10.1021/acsomega.0c06161.
Soil total carbon observed in the wetland soil samples (PDF)
The authors declare no competing financial interest.
Supplementary Material
References
- Feng J.; Zhou J.; Wang L.; Cui X.; Ning C.; Wu H.; Zhu X.; Lin G. Effects of short-term invasion of Spartina alterniflora and the subsequent restoration of native mangroves on the soil organic carbon, nitrogen and phosphorus stock. Chemosphere 2017, 184, 774–783. 10.1016/j.chemosphere.2017.06.060. [DOI] [PubMed] [Google Scholar]
- Xie R.; Zhu Y.; Li J.; Liang Q. Changes in sediment nutrients following Spartina alterniflora invasion in a subtropical estuarine wetland, China. Catena 2019, 180, 16–23. 10.1016/j.catena.2019.04.016. [DOI] [Google Scholar]
- Yang W.; An S.; Zhao H.; Xu L.; Qiao Y.; Cheng X. Impacts of Spartina alterniflora invasion on soil organic carbon and nitrogen pools sizes, stability, and turnover in a coastal salt marsh of eastern China. Ecol. Eng. 2016, 86, 174–182. 10.1016/j.ecoleng.2015.11.010. [DOI] [Google Scholar]
- Cui H.; Ou Y.; Wang L. X.; Wu H. T.; Yan B. X.; Li Y. X. Distribution and release of phosphorus fractions associated with soil aggregate structure in restored wetlands. Chemosphere 2019, 223, 319–329. 10.1016/j.chemosphere.2019.02.046. [DOI] [PubMed] [Google Scholar]
- Bai J.; Yu L.; Ye X.; Yu Z.; Wang D.; Guan Y.; Cui B.; Liu X. Dynamics of phosphorus fractions in surface soils of different flooding wetlands before and after flow-sediment regulation in the Yellow River Estuary, China. J. Hydrol. 2020, 580, 124256 10.1016/j.jhydrol.2019.124256. [DOI] [Google Scholar]
- Zhang G.; Bai J.; Jia J.; Wang W.; Wang X.; Zhao Q.; Lu Q. Shifts of soil microbial community composition along a short-term invasion chronosequence of Spartina alterniflora in a Chinese estuary. Sci. Total Environ. 2019, 657, 222–233. 10.1016/j.scitotenv.2018.12.061. [DOI] [PubMed] [Google Scholar]
- Huang L.; Zhang Y.; Shi Y.; Liu Y.; Wang L.; Yan N. Comparison of phosphorus fractions and phosphatase activities in coastal wetland soils along vegetation zones of Yancheng National Nature Reserve, China. Estuarine, Coastal Shelf Sci. 2015, 157, 93–98. 10.1016/j.ecss.2014.09.027. [DOI] [Google Scholar]
- Teng Z.; Zhu Y.; Li M.; Whelan M. J. Microbial community composition and activity controls phosphorus transformation in rhizosphere soils of the Yeyahu Wetland in Beijing, China. Sci. Total Environ. 2018, 628–629, 1266–1277. 10.1016/j.scitotenv.2018.02.115. [DOI] [PubMed] [Google Scholar]
- Ahn C.; Gillevet P. M.; Sikaroodi M. Molecular characterization of microbial communities in treatment microcosm wetlands as influenced by macrophytes and phosphorus loading. Ecol. Indic. 2007, 7, 852–863. 10.1016/j.ecolind.2006.10.004. [DOI] [Google Scholar]
- Wang Y.; Zhao X.; Wang L.; Zhao P.-H.; Zhu W.-B.; Wang S.-Q. Phosphorus fertilization to the wheat-growing season only in a rice-wheat rotation in the Taihu Lake region of China. Field Crops Res. 2016, 198, 32–39. 10.1016/j.fcr.2016.08.025. [DOI] [Google Scholar]
- Sun H.; Jiang J.; Cui L.; Feng W.; Wang Y.; Zhang J. Soil organic carbon stabilization mechanisms in a subtropical mangrove and salt marsh ecosystems. Sci. Total Environ. 2019, 673, 502–510. 10.1016/j.scitotenv.2019.04.122. [DOI] [PubMed] [Google Scholar]
- Souza-Alonso P.; Guisande-Collazo A.; González L. Gradualism in Acacia dealbata Link invasion: Impact on soil chemistry and microbial community over a chronological sequence. Soil Biol. Biochem. 2015, 80, 315–323. 10.1016/j.soilbio.2014.10.022. [DOI] [Google Scholar]
- Liu Y.; Ge T.; Zhu Z.; Liu S.; Luo Y.; Li Y.; Wang P.; Gavrichkova O.; Xu X.; Wang J.; Wu J.; Guggenberger G.; Kuzyakov Y. Carbon input and allocation by rice into paddy soils: A review. Soil Biol. Biochem. 2019, 133, 97–107. 10.1016/j.soilbio.2019.02.019. [DOI] [Google Scholar]
- Orwin K. H.; Dickie I. A.; Holdaway R.; Wood J. R. A comparison of the ability of PLFA and 16S rRNA gene metabarcoding to resolve soil community change and predict ecosystem functions. Soil Biol. Biochem. 2018, 117, 27–35. 10.1016/j.soilbio.2017.10.036. [DOI] [Google Scholar]
- Struecker J.; Joergensen R. G. Microorganisms and their substrate utilization patterns in topsoil and subsoil layers of two silt barns, differing in soil organic C accumulation due to colluvial processes. Soil Biol. Biochem. 2015, 91, 310–317. 10.1016/j.soilbio.2015.09.011. [DOI] [Google Scholar]
- Gao Y.; Peng R.-H.; Ouyang Z.-T.; Shao C.-L.; Chen J.-Q.; Zhang T.-T.; Guo H.-Q.; Tang J.-W.; Zhao F.; Zhuang P.; Zhao B. Enhanced Lateral Exchange of Carbon and Nitrogen in a Coastal Wetland With Invasive Spartina alterniflora. J. Geophys. Res.: Biogeosci. 2020, 125, ee2019JG005459 10.1029/2019JG005459. [DOI] [Google Scholar]
- Xu S.; Liu X.; Li X.; Tian C. Soil organic carbon changes following wetland cultivation: A global meta-analysis. Geoderma 2019, 347, 49–58. 10.1016/j.geoderma.2019.03.036. [DOI] [Google Scholar]
- Lu D.; Guo P.; Ji J.; Liu L.; Yang P. Evaluation of phosphorus distribution and bioavailability in sediments of a subtropical wetland reserve in southeast China. Ecol. Indic. 2016, 66, 556–563. 10.1016/j.ecolind.2016.02.015. [DOI] [Google Scholar]
- Spohn M.; Ermak A.; Kuzyakov Y. Microbial gross organic phosphorus mineralization can be stimulated by root exudates – A 33P isotopic dilution study. Soil Biol. Biochem. 2013, 65, 254–263. 10.1016/j.soilbio.2013.05.028. [DOI] [Google Scholar]
- Sun D.; Bi Q.; Xu H.; Li K.; Liu X.; Zhu J.; Zhang Q.; Jin C.; Lu L.; Lin X. Degree of short-term drying before rewetting regulates the bicarbonate-extractable and enzymatically hydrolyzable soil phosphorus fractions. Geoderma 2017, 305, 136–143. 10.1016/j.geoderma.2017.05.040. [DOI] [Google Scholar]
- Kavdır Y.; Ekinci H.; Yüksel O.; Mermut A. R. Soil aggregate stability and C-13 CP/MAS-NMR assessment of organic matter in soils influenced by forest wildfires in Çanakkale, Turkey. Geoderma 2005, 129, 219–229. 10.1016/j.geoderma.2005.01.013. [DOI] [Google Scholar]
- Shen D.; Ye C.; Hu Z.; Chen X.; Guo H.; Li J.; Du G.; Adl S.; Liu M. Increased chemical stability but decreased physical protection of soil organic carbon in response to nutrient amendment in a Tibetan alpine meadow. Soil Biol. Biochem. 2018, 126, 11–21. 10.1016/j.soilbio.2018.08.008. [DOI] [Google Scholar]
- Wang H.; Nie Y.; Butterly C. R.; Wang L.; Chen Q.; Tian W.; Song B.; Xi Y.; Wang Y. Fertilization alters microbial community composition and functional patterns by changing the chemical nature of soil organic carbon: A field study in a Halosol. Geoderma 2017, 292, 17–24. 10.1016/j.geoderma.2017.01.006. [DOI] [Google Scholar]
- Servais S.; Kominoski J. S.; Charles S. P.; Gaiser E. E.; Mazzei V.; Troxler T. G.; Wilson B. J. Saltwater intrusion and soil carbon loss: Testing effects of salinity and phosphorus loading on microbial functions in experimental freshwater wetlands. Geoderma 2019, 337, 1291–1300. 10.1016/j.geoderma.2018.11.013. [DOI] [Google Scholar]
- Tiessen H.; Moir J. O.. Characterization of Available P by Sequential Extraction. In Soil Sampling and Methods of Analysis; Lewis Publishers, Boca Raton, 1993; pp 75–86. [Google Scholar]
- Murphy J.; Riley J. P. A Modified Single Solution Method for the Determination of Phosphate in Natural-Waters. Anal. Chim. Acta 1962, 27, 31–36. 10.1016/S0003-2670(00)88444-5. [DOI] [Google Scholar]
- Hou E.; Chen C.; Kuang Y.; Zhang Y.; Heenan M.; Wen D. A structural equation model analysis of phosphorus transformations in global unfertilized and uncultivated soils. Global Biogeochem. Cycles 2016, 30, 1300–1309. 10.1002/2016GB005371. [DOI] [Google Scholar]
- Wang H.; Xiao K.; Yang J.; Yu Z.; Yu W.; Xu Q.; Wu Q.; Liang S.; Hu J.; Hou H.; Liu B. Phosphorus recovery from the liquid phase of anaerobic digestate using biochar derived from iron-rich sludge: A potential phosphorus fertilizer. Water Res. 2020, 174, 115629 10.1016/j.watres.2020.115629. [DOI] [PubMed] [Google Scholar]
- Shrestha B. M.; Singh B. R.; Forte C.; Certini G. Long-term effects of tillage, nutrient application and crop rotation on soil organic matter quality assessed by NMR spectroscopy. Soil Use Manage. 2015, 31, 358–366. 10.1111/sum.12198. [DOI] [Google Scholar]
- Frostegård Å.; Tunlid A.; Bååth E. Phospholipid Fatty-Acid Composition, Biomass, and Activity of Microbial Communities from 2 Soil Types Experimentally Exposed to Different Heavy-Metals. Appl. Environ. Microbiol. 1993, 59, 3605–3617. 10.1128/AEM.59.11.3605-3617.1993. [DOI] [PMC free article] [PubMed] [Google Scholar]
- Zelles L. Fatty acid patterns of phospholipids and lipopolysaccharides in the characterisation of microbial communities in soil: a review. Biol. Fertil. Soils 1999, 29, 111–129. 10.1007/s003740050533. [DOI] [Google Scholar]
- Tabatabai M. A.Soil Enzymes. In Methods of Soil Analysis: Part 2—Microbiological and Biochemical Properties; Soil Science Society of America, Madison, 1994; pp 775–833. [Google Scholar]
- Eivazi F.; Tabatabai M. A. Glucosidases and Galactosidases in Soils. Soil Biol. Biochem. 1988, 20, 601–606. 10.1016/0038-0717(88)90141-1. [DOI] [Google Scholar]
- Guan Y. S.The Determination of Soil Enzymatic Activities: The Study Method of Soil Enzyme; China Agriculture Press, Beijing, 1986; pp 309–313. [Google Scholar]
- Deng S. P.; Tabatabai M. A. Cellulase Activity of Soils. Soil Biol. Biochem. 1994, 26, 1347–1354. 10.1016/0038-0717(94)90216-X. [DOI] [Google Scholar]
- Montgomery M. W.; Sgarbieri V. C. Isoenzymes of Banana Polyphenol Oxidase. Phytochemistry 1975, 14, 1245–1249. 10.1016/S0031-9422(00)98602-3. [DOI] [Google Scholar]
Associated Data
This section collects any data citations, data availability statements, or supplementary materials included in this article.


