

Abstract

In this study, the effect of 18-crown-6 on the stability of oxytocin in aqueous solution was explored. The study found that while 12-crown-4 and 15-crown-5 do not stabilize oxytocin, 18-crown-6 does have a stabilizing effect in citrate/phosphate buffer at pH 4.5. However, in acetate buffer at the same pH, the presence of 18-crown-6 had a destabilizing effect, possibly leading to a different degradation pathway. Both the stabilizing and destabilizing effects, depending on the buffer used, are concentration dependent where a higher concentration of 18-crown-6 is linked to a stronger effect. It is hypothesized that this effect may be linked to 18-crown-6 binding to the protonated ammonium group of oxytocin. Upon changing the mobile phase used in high-performance liquid chromatography experiments, we observed evidence supporting this binding hypothesis. When an acidic mobile phase was used (0.01% trifluoroacetic acid (TFA)), a partial shift in oxytocin retention time was observed for samples in acetate buffers in the presence of 18-crown-6 when using a 150 mm column (C18). The amount of the peak that shifted depended on the 18-crown-6 concentration used. A similar shift in oxytocin peak retention time was observed for samples in both acetate and citrate/phosphate buffers when using a 250 mm column (C18), but the peak completely shifted in those samples. When using an even more acidic mobile phase (0.1% TFA), the oxytocin peaks all had the same retention time again. Ultraviolet and nuclear magnetic resonance spectroscopy experiments also showed that the presence of 18-crown-6 has an observable effect on the resulting oxytocin spectra.
Introduction
Oxytocin is a nonapeptidic hormone, often used as a drug to combat postpartum hemorrhage, the primary cause of maternal deaths around the globe.1−4 Oxytocin also has other numerous biological and psychological functions including a role in lactation and relationships.5 Additionally, efforts have been made toward using oxytocin as a drug to treat conditions such as alcoholism,6 autism,7 and schizophrenia.8,9
Unfortunately, oxytocin, in aqueous solutions, degrades rapidly when kept at temperatures above 30 °C.10 Although it is not entirely clear why oxytocin samples in low and middle income countries are often of poor quality, oxytocin’s thermostability has been suggested to be a contributing factor to the poor quality.11 Methods for enhancing oxytocin’s shelf life would therefore be beneficial. For this reason, an understanding of the degradation process can help in the development of successful stability-enhancing methods.
The oxytocin structure was elucidated by du Vigneaud et al. and reported in 1953.12−14 It includes a six amino acid cyclic unit, with a disulfide bridge closing the ring. Wiśniewski et al. have proposed that the first step in the degradation mechanism of oxytocin is beta elimination, expelling R–S–S– as the leaving group. The experimental support for this hypothesis included experiments where they altered the oxytocin structure in small ways and measured how much remained after 28 days of storage at 40 °C in phosphate buffer solution at pH 7.4. For unaltered oxytocin, only 12.6% remained after 28 days, but when the sulfur atoms in the disulfide bridge were substituted with CH2 units, 97.5% of this new analog remained. Those results support the idea that an important early degradation step is the expulsion of R–S–S– as a leaving group.15
Another interesting result was obtained when the only free amino group was substituted for a hydrogen, resulting in 90.1% of that analog remaining after 28 days under the above-mentioned conditions.15 A potential explanation for this observation is that the free amine could act as the base, thus promoting the beta elimination. This hypothesis is further supported by oxytocin showing the greatest stability around pH 4.515,16 at which pH more of the amino group is significantly protonated and thus unable to act as a base. Furthermore, oxytocin has shown faster degradation kinetics when stored at higher concentrations at pH 4.5, suggesting a potential intermolecular degradation pathway with another oxytocin molecule.16 If the process was primarily intramolecular or between oxytocin and the solvent, the oxytocin concentration should have a more limited effect on the kinetics of degradation. This concentration dependence was not observed at pH 2.0, which can be explained by another degradation mechanism taking over.
We hypothesized that if the amino group could be further inhibited from acting as a base, it would retard the oxytocin degradation process (Figure 1). To test this hypothesis, we decided to use 18-crown-6 ether, which is known to have a binding affinity for protonated ammonium groups.17 In contrast, smaller crown ethers, such as 15-crown-5 and 12-crown-4, do not show a strong binding affinity to ammonium groups because of the smaller ring sizes. It should be noted however, that 18-crown-6 may not be a suitable excipient in pharmaceutical formulations, as it also has a strong binding affinity for potassium ions, and studies have shown oral toxicity in dogs and mice.18,19 However, the goal of this study was to explore a mechanistically guided approach to the oxytocin thermostability challenge and for that it can provide valuable insights.
Figure 1.

Hypothesized stabilizing interaction between 18-crown-6 (blue) and the protonated ammonium group (red) on the oxytocin molecule.
Results and Discussion
Effect of Different Crown Ethers on Oxytocin Stability in Citrate/Phosphate Buffer
Oxytocin solutions (0.25 mg/mL) were prepared in citrate/phosphate buffer (0.1 M/0.2 M) at pH 4.5. Four samples were made, one with only oxytocin as a control, and the others with different crown ethers for each one. The crown ethers used were 12-crown-4, 15-crown-5, and 18-crown-6 and the crown ether concentration was kept constant across the samples at 1.0% w/v. The samples were then each divided into two portions with one half being stored at 40 °C and the other at 50 °C for a period of up to 47 days. During this time period the remaining amount of oxytocin was regularly measured by high-performance liquid chromatography (HPLC) analysis. The results are shown in Table 1. While the remaining amount of oxytocin was similar for the control sample and the samples with 15-crown-5 or 12-crown-4 (statistically insignificant for the majority of those samples), a greater amount of oxytocin remained in the solutions with 18-crown-6, both at 40 °C and at 50 °C. At 40 °C the increased remaining amount of oxytocin was statistically significant, with p < 0.005 for all samples with 18-crown-6 present. At 50 °C, three out of four measurements showed that there was statistically significantly greater remaining amount of oxytocin when 18-crown-6 was present in the samples (p < 0.05 for 2 samples and p < 0.005 for 1 sample).
Table 1. Remaining Amount of Oxytocin (%) in a Citrate/Phosphate Buffer (0.1 M/0.2 M) in the Presence of Different Crown Ethers (1.0% w/v) As Well As by Itselfa.
| remaining oxytocin (%) | ||||||
|---|---|---|---|---|---|---|
| sample | temperature | day 0 | day 14 | day 25 | day 40 | day 47 |
| OT | 40 °C | 100.0 (0.1) | 74.1 (0.4) | 62.4 (1.5) | 57.4 (0.7) | 56.3 (0.3) |
| OT-12C4 | 100.0 (6.3) | 76.3d (0.1) | 68.4 (4.5) | 59.3 (1.0) | 57.3d (0.2) | |
| OT-15C5 | 100.0 (0.3) | 72.4c (0.3) | 66.8 (4.4) | 58.1 (2.1) | 54.6b (0.6) | |
| OT-18C6 | 100.0 (0.6) | 78.3d (0.6) | 71.4d (2.1) | 68.4d (0.2) | 65.4d (0.3) | |
| day 0 | day 14 | day 18 | day 29 | day 40 | ||
|---|---|---|---|---|---|---|
| OT | 50 °C | 100.0 (0.1) | 47.2 (1.0) | 40.0 (2.4) | 26.7 (4.3) | 21.1 (0.0) |
| OT-12C4 | 100.0 (6.3) | 47.2 (0.2) | 40.2b (0.2) | 26.0 (3.2) | 18.7b (8.1) | |
| OT-15C5 | 100.0 (0.3) | 47.7 (3.7) | 37.9 (1.1) | 24.0 (5.2) | 18.7d (0.4) | |
| OT-18C6 | 100.0 (0.6) | 53.5 (9.1) | 44.8b (1.1) | 33.3b (2.1) | 25.4d (0.7) |
Standard deviation is shown in brackets behind each value (OT = oxytocin, 12C4 = 12-crown-4, 15C5 = 15-crown-5, 18C6 = 18-crown-6).
=p ≤ 0.05.
=p ≤ 0.01.
= p ≤ 0.005.
These results fit with the hypothesis that 18-crown-6 would be the only one of these crown ethers to have a positive effect on the oxytocin stability because of its binding affinity with ammonium groups. Since 15-crown-5 and 12-crown-4 do not have as significant binding affinity to ammonium groups because of a smaller ring size, they were not expected to impact the oxytocin stability and indeed, their effect was negligible at the crown ether concentration tested. Therefore, these results provide further support that the free amine group plays a role in oxytocin’s degradation pathway and reinforced the importance of understanding the degradation mechanism in order to stabilize better the sites of importance.
Concentration Effect of 18-Crown-6 on Oxytocin Stability
Oxytocin solutions (0.25 mg/mL) were also prepared in citrate/phosphate buffer (0.1 M/0.2 M) at pH 4.5 with different concentrations of 18-crown-6 as an additive (0.1, 0.3, and 2.0% w/v). The results showed that the oxytocin stability was enhanced with higher concentrations of the crown ether (Table 2). All of these results showed statistical significance. Analogous samples were prepared in acetate buffer (0.1 M). Surprisingly, in this sample series, the oxytocin stability diminished as the crown ether concentration increased (Table 2). Regarding the acetate results, all of them showed statistical significance except one. The only one that did not show statistical significance on the day 3 measurement was the sample with the lowest concentration of 18-crown-6 (18C6-A1).
Table 2. Remaining Amount of Oxytocin in the Presence of Different Concentrations of 18-Crown-6 (18C6) in either Citrate/Phosphate Buffer (C) or Acetate Buffer (A) at 50 °C.
| remaining oxytocin (%) | |||||||
|---|---|---|---|---|---|---|---|
| sample | buffer | crown ether conc. (% w/v) | day 0 | day 3 | day 7 | day 10 | day 14 |
| OT-C | citrate/phosphate(0.1 M/0.2 M) | 0 | 100.0 (0.4) | 84.8 (0.7) | 71.9 (0.1) | 61.6 (0.2) | 51.9 (0.2) |
| 18C6-C1 | 0.1 | 100.0 (1.4) | 85.8a (0.1) | 68.7c (0.3) | 58.9c (0.1) | 49.5c (0.5) | |
| 18C6-C2 | 0.3 | 100.0 (0.2) | 86.6c (0.2) | 70.8a (0.7) | 60.9c (0.1) | 51.3c (0.0) | |
| 18C6-C3 | 2.0 | 100.0 (1.2) | 88.5c (0.2) | 75.6c (0.3) | 67.8c (0.0) | 59.6c (0.3) | |
| OT-Ad | acetate (0.1 M) | 0 | 100.0 (1.1) | 92.6 (1.3) | 87.2 (0.7) | 82.7 (0.9) | 74.2 (1.8) |
| 18C6-A1 | 0.1 | 100.0 (0.6) | 90.5 (0.0) | 83.2b (1.1) | 76.2c (0.0) | 67.5b (0.0) | |
| 18C6-A2 | 0.3 | 100.0 (0.5) | 87.3a (1.0) | 82.5b (1.1) | 73.4c (0.0) | 62.1c (0.7) | |
| 18C6-A3 | 2.0 | 100.0 (0.1) | 84.2a (1.3) | 72.1c (1.4) | 62.5c (2.4) | 51.2c (0.2) | |
p ≤ 0.05.
p ≤ 0.01.
p ≤ 0.005
OT-A gave significantly better results at all time points (p = 0.02, 0.0004, 0.0003, and 0.0007, respectively, for days 3, 7, 10, and 14), compared with OT-C.
The results in citrate/phosphate buffer fit with what was expected. As the concentration of 18-crown-6 increases the probability of it binding to a protonated ammonium group, thus preventing it from being involved in undesired reactions. It is not clear, however, why 18-crown-6 has an opposite effect on oxytocin stability in acetate buffer, seemingly destabilizing it. It is known that citrate buffer may produce amide- and imide-linked citrate derived degradation products of oxytocin.20 That degradation also involves the amine group, in that case reacting with citric anhydride. The question then becomes whether the stabilizing effect of 18-crown-6 in citrate/phosphate is because it slows down the amide- and imide-linked degradation pathway, or if it retards the beta elimination pathway that includes the disulfide bridge, or a bit of both.
In an attempt to understand better what was happening, the HPLC traces were analyzed further in order to see if a variation in degradation products could be observed, depending on the presence or absence of 18-crown-6. After 14 days at 50 °C, oxytocin showed a similar degradation pattern, based on the HPLC trace, for oxytocin in both acetate and citrate/phosphate buffer, as well as for the sample that included 18-crown-6 (2% w/v) in citrate/phosphate buffer. This suggests that 18-crown-6 may be slowing down the main degradation pathway in citrate/phosphate buffer (Figure 2).
Figure 2.
HPLC traces of oxytocin after 14 days of storage at 50 °C in the presence and absence of 2% w/v of 18-crown-6 in both acetate and citrate/phosphate buffer.
When oxytocin was stored in acetate buffer in the presence of 2% w/v of 18-crown-6, the HPLC trace showed more significant differences, most notably a new peak around minute 10.5 that was not observed in any of the other HPLC traces (Figure 2). This suggests that the presence of 18-crown-6 in acetate buffer may lead to a different degradation pathway for oxytocin. Further studies will be required to better understand why 18-crown-6 has such a different effect on oxytocin stability in acetate buffer compared to in citrate/phosphate buffer.
18-Crown-6 Effect on the Retention Time—Acidic Mobile Phase and Short Column
In a different HPLC run, the mobile phase was changed to a more acidic one (A: 0.01% trifluoroacetic acid (TFA) in H2O and B: 0.01% TFA in 70% MeCN: 30% H2O), allowing most of the amino group of oxytocin to remain protonated throughout the run. Several samples were prepared with the oxytocin concentration kept constant at 0.25 mg/mL, while the 18-crown-6 concentration ranged from 0% up to 1% w/v, with the 0% sample serving as a control. In these HPLC runs, a partial shift was observed when 18-crown-6 was included in the samples (Figure 3). The oxytocin amount in all of these samples was kept constant and the overall area under both peaks was close to constant. The amount of relative peak area that was shifted was dependent on the 18-crown-6 concentration, suggesting that its presence in the solution caused the peak shift. These results further support the hypothesis that a guest/host complex is being formed between oxytocin and 18-crown-6 and we hypothesize that the new peak may be due to this guest/host complex (Table 3).
Figure 3.

Ultraviolet (UV) trace from HPLC runs of an oxytocin standard (black), an oxytocin sample with 0.1% w/v of 18-crown-6 added (blue), and an oxytocin sample with 1.0% w/v of 18-crown-6 added (red). These samples were prepared in acetate buffer.
Table 3. Relative Peak Area of the Peaks Showing up at 4.1 and 4.6 min for Freshly Prepared Oxytocin Samples with Different Concentrations of 18-Crown-6.
| sample | 18-crown-6 conc. (% w/v) | % of area under peak at 4.1 min | % of area under peak at 4.6 min |
|---|---|---|---|
| OT | 0 | 100 | 0 |
| OT-A-18C6–1 | 0.01 | 95 | 5 |
| OT-A-18C6–2 | 0.05 | 92 | 8 |
| OT-A-18C6–3 | 0.1 | 89 | 11 |
| OT-A-18C6–4 | 1.0 | 12 | 88 |
18-Crown-6 Effect on the Retention Time—Acidic Mobile Phase and a Longer Column
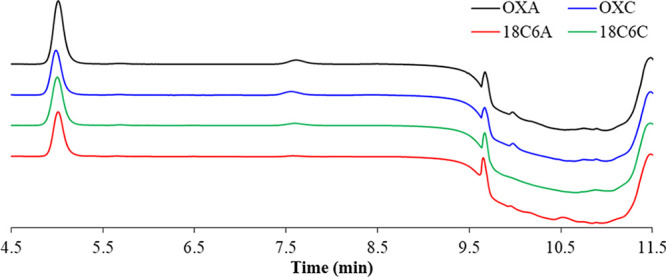
Several more samples were prepared with the oxytocin concentration remaining constant at 0.25 mg/mL, while the 18-crown-6 concentration ranged again from 0% up to 1% w/v. In this set of samples, an additional one with oxytocin (0.25 mg/mL), 18-crown-6 (1.0% w/v), and potassium chloride (2.0% w/v) was included as well as a sample with only 18-crown-6. These samples were prepared in both acetate and citrate/phosphate buffers at pH 4.5. When a longer column was used (250 mm instead of 150 mm), a complete shift was observed in the retention time of all of the oxytocin samples containing 18-crown-6, regardless of buffer used (Figure 4). It is unclear why the length of the columns, which should be otherwise identical, would have such a drastic effect (partial vs complete peak shift). Nevertheless, these results were reproducible in our lab with these columns. A future study could be needed to provide an adequate explanation for this observation. We hypothesize that the new peak observed here is also for the oxytocin/18-crown-6 complex shown in Figure 1. No peak was observed for 18-crown-6, as it does not absorb light at the detection wavelength (220 nm), and KCl did not prevent a peak shift from being observed in the samples. In the samples that included KCl, the buffer region of the HPLC trace (2.5–5.5 min) was significantly altered (Figure 4), suggesting that the potassium and/or chloride ions were interacting with the buffer components (acetate or citrate/phosphate) and came out of the column alongside them. If the potassium ion is binding more strongly to the buffer components than to 18-crown-6 in these HPLC runs, that would explain why its presence did not prevent the peak shift from being observed.
Figure 4.

HPLC traces of samples showing an oxytocin peak shift when in the presence of 18-crown-6. The samples were prepared in citrate/phosphate buffer (left) and in acetate buffer (right). The mobile phase used was A: 0.01% TFA in H2O and B: 0.01% TFA in 70% MeCN: 30% H2O.
When analyzing these results there are two important things to keep in mind. First, these samples were fresh so no degradation product is to be expected to be observed at this point in time. Second, this peak shift had not been observed in previous HPLC runs, so this peak shift/complexation was directly dependent on the mobile phase being used. Still, the possibility remained that a fast reaction was taking place between the mobile phase and oxytocin yielding a new product with a new retention time. To test this possibility, we changed the TFA concentration in the mobile phase and re-analyzed the samples. The new mobile phase composition had increased TFA concentration and was A: 0.1% TFA in H2O and B: 0.1% TFA in 70% MeCN: 30% H2O. When this mobile phase was used, all of the oxytocin samples showed up at the same retention time, regardless of whether 18-crown-6 was present or not (Figure 5). It remains unclear why a more acidic mobile phase leads to 18-crown-6 no longer having any observable effect on the retention time. It could have been expected that the more acidic medium would lead to greater complexation yielding a potential peak shift, which is not what we observed. For the 0.1% TFA mobile phase, the pH was close to 2, and for the 0.01% TFA mobile phase it was closer to 3. 18-crown-6 can also bind hydronium ions, and at the lower pH, we have an order of magnitude more hydronium ions that might also bind to the 18-crown-6. It is difficult to tell whether this would be enough to affect the complexation or not, and the difference seems low to completely negate the observed peak shift. These results do suggest however, that a reaction is unlikely to be causing the previously observed peak shift, but rather a pH or mobile phase dependent guest–host complex interaction.
Figure 5.

HPLC traces of samples showing no oxytocin peak shift regardless of the presence of 18-crown-6. The samples were prepared in citrate/phosphate buffer (left) and acetate buffer (right). The mobile phase used was A: 0.1% TFA in H2O and B: 0.1% TFA in 70% MeCN: 30% H2O.
18-Crown-6 Effect on the UV Absorption Spectrum
Samples were prepared to see if changes would be observed in the UV absorption spectrum (200–300 nm) of oxytocin depending on the additives present (Figure 6). 18-crown-6 (4% w/v) on its own did not absorb much. When oxytocin (0.25 mg/mL), 18-crown-6 (4% w/v), and KCl (4% w/v) were all together, the UV trace was very similar to the UV trace of oxytocin by itself. When oxytocin and 18-crown-6 were in the solution by themselves, there was a noticeably bigger right shoulder observed around 230 nm. The solvent used here was a 70/30 mixture of mobile phases A and B that were used in the third part of this study. These results suggest that in this solution mixture, potassium may have bound more strongly to the 18-crown-6 preventing the crown ether to interact as strongly with the oxytocin and affecting its UV trace.
Figure 6.

UV absorption spectra for oxytocin, 18-crown-6, a solution with both oxytocin and 18-crown-6, and a solution with oxytocin, 18-crown-6, and potassium chloride.
18-Crown-6 Effect on the Nuclear Magnetic Resonance Spectroscopy Spectrum
Two nuclear magnetic resonance spectroscopy (NMR) samples were prepared in D2O to see if any interaction could be observed using that approach. One of the NMR samples only contained oxytocin whereas the other contained oxytocin and 18-crown-6. The spectra were both calibrated to the NMR solvent, D2O, at 4.79 ppm, to enable a better comparison of the peak locations. The NMR shows that there is a clear peak shift for many of the oxytocin peaks when 18-crown-6 is present (Figure 7). This is especially noticeable for the aromatic protons on tyrosine, where the distance between the chemical shifts of the aromatic peaks has increased in the presence of 18-crown-6. There are, however, many other peaks that have shifted slightly as can be seen in Figure 7. While it is difficult to identify exactly what type of interaction is between the two compounds based on the NMR spectrum, the observed peak shifts do support the possibility of a guest/host interaction between the 18-crown-6 and the oxytocin, even in pure D2O.
Figure 7.

Stacked NMR spectra of pure oxytocin (blue) and a mixture of oxytocin and 18-crown-6 (black) in D2O.
Conclusions
In conclusion, this study explored how 18-crown-6 affects oxytocin stability in both acetate and citrate/phosphate buffer solutions, yielding positive effect in citrate/phosphate buffer but negative effect in acetate buffer. Evidence of potential 18-crown-6 binding interactions was observed in HPLC experiments where a potential guest–host complex could be observed at a new retention time only when 18-crown-6 was present and only in certain mobile phases. Additional evidence of potential binding interactions was observed in the UV trace of oxytocin compared to oxytocin with 18-crown-6 in it. In the UV experiment, KCl seemed to negate the 18-crown-6 effect on the UV trace, likely because of K+ being able to bind to 18-crown-6. The presence of potassium chloride did not, however, seem to negate the HPLC peak shifting effect of 18-crown-6 in citrate/phosphate buffer samples, likely because of it binding more strongly to the buffer and exiting the column along with the buffer. Lastly, NMR experiments showed that an NMR peak shift can be observed when oxytocin is in the presence of 18-crown-6 in D2O, further supporting the possibility of binding interactions between the crown ether and oxytocin. These results will hopefully aid in developing more efficient mechanistically guided stabilization approaches for oxytocin as well as for other thermolabile molecules.
Materials and Methods
Materials
Oxytocin was purchased from Grindeks (Latvia). The following chemicals were bought from Sigma-Aldrich, with the country of origin indicated in brackets: 18-crown-6 (India), 15-crown-5 (Switzerland), 12-crown-4 (Germany), potassium chloride (Germany), sodium hydrogen phosphate (Germany), sodium dihydrogen phosphate (Germany), and TFA (France). Citric acid anhydrous was obtained from Pernhofen (Austria). Ammonium acetate was purchased from Riedel-de Haën (Serbia/Montenegro). Sodium acetate was bought from Merck (Germany). Acetic acid, acetonitrile, and methanol were purchased from Honeywell (Germany). All water used in this study was obtained from a Milli-Q water purification system.
Formulation
Oxytocin standards for HPLC runs were generally prepared in the same buffer as samples being run in each part of the study.
Section 1: Four oxytocin samples with a constant concentration of 0.25 mg/mL were prepared in a citrate/phosphate buffer (0.1 M/0.2 M) at pH 4.5. One of these samples had no other additives, while the other three samples contained 12-crown-4, 15-crown-5, or 18-crown-6. The crown ether concentration was kept constant at 1% w/v. These samples were then stored at 40 or 50 °C and analyzed regularly via HPLC over a period of 47 days.
Section 2: Eight oxytocin samples were prepared with the oxytocin concentration kept constant at 0.25 mg/mL. Four of these samples were prepared in a citrate/phosphate buffer (0.1 M/0.2 M) and the other four were prepared in acetate buffer (0.1 M), all at pH 4.5. For the four samples in each buffer, one sample had no additives, while the others had 18-crown-6 at a range of concentrations (0.1%, 0.3% or 2% w/v). These samples were stored at 50 °C and analyzed regularly over a period of two weeks.
Section 3: Oxytocin samples (0.25 mg/mL) were prepared in acetate buffer (0.1 M) with 18-crown-6 added in a range of concentrations (0, 0.01, 0.05, 0.1, and 1.0%).
Section 4: Oxytocin samples (0.25 mg/mL) were prepared in acetate buffer (0.1 M) on the one hand, and citrate/phosphate buffer (0.1 M/0.2 M) on the other hand, with 18-crown-6 added in a range of concentrations (0, 0.1, 0.5, and 1.0% w/v). Furthermore, an oxytocin sample with 18-crown-6 (1.0% w/v) and KCl (2.0% w/v) was prepared in each of the buffers, as well as a sample with pure 18-crown-6 (1.0% w/v).
Section 5: For the UV–vis part of the study, the additives were at the same concentration whenever present in a sample. The samples in this series included: pure oxytocin (0.25 mg/mL), pure 18-crown-6 (4.0% w/v), a mixture of oxytocin with 18-crown-6, a mixture of oxytocin with 18-crown-6 and potassium chloride (4.0% w/v). The solvent for this series was the same as the mobile phase used in the third part of this study, that is 70% of mobile phase A (0.01% TFA in water) and 30% of mobile phase B (0.01% TFA in a 70% MeCN: 30% H2O solution). These samples were analyzed directly by UV–visible spectrophotometry.
Analysis
Analytical HPLC used in this study included a Dionex Ultimate 3.0 HPLC system controlled by Dionex Chromeleon software v7.2. The HPLC system consisted of a column oven compartment, an autosampler with temperature control, an UltiMate 3000 pump, and an UltiMate 3000 photo-diode array detector. The UV detection was set at 220 nm. All HPLC samples were run in triplicate and the averages and standard deviation of the calculated remaining amount of oxytocin are reported.
Section 1: A Phenomenex Luna 5 μm C18(2), 150 × 4.6 mm, 100 Å, LC column was used with a SecurityGuard Cartridge (C18 4 × 3.0 mm). The chromatographic procedure of the European pharmacopoeia was followed. Mobile phase A was a 15.6 g/L solution of sodium dihydrogen phosphate. Mobile phase B was a 1:1 acetonitrile:water solution. The flow rate was 1 mL/min. At minutes 0–17, mobile phase A went from 70 to 40% (v/v) in a linear gradient elution. From minute 17–19, mobile phase A went back to 70%. The equilibration time was 11 min. As the high salt concentration could more easily lead to clogging in the instrument, new mobile phase constitutions were sought.
Section 2: A Phenomenex Luna 5 μm C18(2), 250 × 4.6 mm, 100 Å, LC column was used with a SecurityGuard Cartridge (C18 4 × 3.0 mm). Mobile phase A was an aqueous 20 mM ammonium acetate solution and mobile phase B was pure acetonitrile. The flow rate was 1 mL/min. At minutes 0–11, mobile phase A was constant at 75%. From minute 8–10.5 mobile phase A went down to 10% in a linear gradient elution followed by an isocratic step at this concentration until minute 11. From minute 11–12.5, mobile phase A percentage was increased again to 75%. The equilibration time was 3.5 min.
Section 3: A Phenomenex Luna 5 μm C18(2), 150 × 4.6 mm, 100 Å, LC column was used with a SecurityGuard Cartridge (C18 4 × 3.0 mm). The mobile phase combination was A: 0.01% TFA in H2O and B: 0.01% TFA in 70% MeCN: 30% H2O. The flow rate was 1 mL/min. At minutes 0–17, mobile phase A went from 70 to 40% in a linear gradient elution. From minute 17–19 the mobile phase went back to 70%. The equilibration time was 11 min.
Section 4: A Phenomenex Luna 5 μm C18(2), 250 × 4.6 mm, 100 Å, LC column was used with a SecurityGuard Cartridge (C18 4 × 3.0 mm). The first mobile phase combination was A: 0.01% TFA in H2O and B: 0.01% TFA in 70% MeCN: 30% H2O. The flow rate was 1 mL/min. At minutes 0–17, mobile phase A went from 70 to 40% in a linear gradient elution. From minute 17–19 the mobile phase went back to 70%. The equilibration time was 11 min. The second mobile phase combination was A: 0.1% TFA in H2O and B: 0.1% TFA in 70% MeCN: 30% H2O.
Section 5: UV–vis spectrophotometric analyses were performed on a Genesys 150 UV–visible spectrophotometer using 1 cm quartz cells. The range of wavelengths measured was 200–300 nm. 1H spectra were recorded on a Bruker Avance 400 MHz spectrometer in deuterated water as the solvent.
Statistical Analysis
Evaluation of the statistical significance of improvement or declination in stability was carried out using Student’s t-test. The p-values equal or below 0.05 were regarded as significant.
Acknowledgments
We would like to thank Árni Thorgrímur Kristjánsson and Bergthóra Sigrídur Snorradóttir for help with troubleshooting with the HPLC instrument and the Icelandic Technology Development Fund for funding.
Supporting Information Available
The Supporting Information is available free of charge at https://pubs.acs.org/doi/10.1021/acsomega.0c06248.
HPLC traces and NMR spectra (PDF)
Author Contributions
Conceptualization, S.G.; methodology, M.G., S.G., and B.R.S.; data curation, M.G..; writing – original draft preparation, M.G. and B.R.S.; writing – review and editing, M.G., S.G., and B.R.S.; supervision, B.R.S and S.G.; project administration, B.R.S.; funding acquisition, S.G. The manuscript was written through contributions of all authors. All authors have given approval to the final version of the manuscript.
This research was funded by the Icelandic Technology Development Fund (grant number 164072-0613).
The authors declare no competing financial interest.
Supplementary Material
References
- Vogel J. P.; Williams M.; Gallos I.; Althabe F.; Oladapo O. T.; WHO Recommendations Uterotonics for the Prevention of Postpartum Haemorrhage; Geneva, 2018. [DOI] [PMC free article] [PubMed] [Google Scholar]
- Say L.; Chou D.; Gemmill A.; Tunçalp Ö.; Moller A.; Daniels J.; Gülmezoglu A. M.; Temmerman M.; Alkema L. Global Causes of Maternal Death: A WHO Systematic Analysis. Lancet Glob. Health 2014, 2, e323–e333. 10.1016/S2214-109X(14)70227-X. [DOI] [PubMed] [Google Scholar]
- Winkler M.; Rath W. A Risk-Benefit Assessment of Oxytocics in Obstetric Practice. Drug Saf. 1999, 20, 323–345. 10.2165/00002018-199920040-00003. [DOI] [PubMed] [Google Scholar]
- Van Dongen P. W. J.; Van Roosmalen J.; De Boer C. N.; Van Rooij J. Oxytocics for the Prevention of Post-Partum Haemorrhages. Pharm. Weekbl. Sci. Ed 1991, 13, 238–243. [DOI] [PubMed] [Google Scholar]
- Olff M.; Frijling J. L.; Kubzansky L. D.; Bradley B.; Ellenbogen M. A.; Cardoso C.; Bartz J. A.; Yee J. R.; van Zuiden M. The Role of Oxytocin in Social Bonding, Stress Regulation and Mental Health: An Update on the Moderating Effects of Context and Interindividual Differences. Psychoneuroendocrinol. 2013, 38, 1883–1894. 10.1016/j.psyneuen.2013.06.019. [DOI] [PubMed] [Google Scholar]
- Lee M. R.; Weerts E. M. Oxytocin for the Treatment of Drug and Alcohol Use Disorders. Behav. Pharmacol. 2016, 27, 640–648. 10.1097/FBP.0000000000000258. [DOI] [PMC free article] [PubMed] [Google Scholar]
- Young L. J.; Barrett C. E. Can Oxytocin Treat Autism?. Science 2015, 347, 825–826. 10.1126/science.aaa8120. [DOI] [PMC free article] [PubMed] [Google Scholar]
- Averbeck B. B.; Bobin T.; Evans S.; Shergill S. S. Emotion Recognition and Oxytocin in Patients with Schizophrenia. Psychol. Med. 2012, 42, 259–266. 10.1017/S0033291711001413. [DOI] [PMC free article] [PubMed] [Google Scholar]
- Rubin L. H.; Carter C. S.; Drogos L.; Pournajafi-Nazarloo H.; Sweeney J. A.; Maki P. M.; Peripheral Oxytocin I. Associated with Reduced Symptom Severity in Schizophrenia. Schizophr. Res. 2010, 124, 13–21. 10.1016/j.schres.2010.09.014.. [DOI] [PMC free article] [PubMed] [Google Scholar]
- de Groot A. N. J. A.; Vree T. B.; Hogerzeil H. V.; Walker G. J. A.. Stability of Oral Oxytocics in Tropical Climates; WHO/DAP/94 13, World Health Organization: Geneva, 1994. [Google Scholar]
- Torloni M.; Gomes Freitas C.; Kartoglu U.; Metin Gülmezoglu A.; Widmer M. Quality of Oxytocin Available in Low- and Middle-Income Countries: A Systematic Review of the Literature. BJOG 2016, 123, 2076–2086. 10.1111/1471-0528.13998.. [DOI] [PubMed] [Google Scholar]
- du Vigneaud V.; Ressler C.; Trippett S. The Sequence of Amino Acids in Oxytocin, with a Proposal for the Structure of Oxytocin. J. Biol. Chem. 1953, 205, 949–957. [PubMed] [Google Scholar]
- du Vigneaud V.; Ressler C.; Swan J. M.; Roberts C. W.; Katsoyannis P. G. The Synthesis of Oxytocin. J. Am. Chem. Soc. 1954, 76, 3115–3121. 10.1021/ja01641a004.. [DOI] [Google Scholar]
- Davoli H.; Turner R. A.; Pierce J. G.; du Vigneaud V. An Investigation of the Free Amino Groups in Oxytocin and Desulfurized Oxytocin Preparations. J. Biol. Chem. 1951, 193, 363–370. [PubMed] [Google Scholar]
- Wisniewski K.; Finnman J.; Flipo M.; Galyean R.; Schteingart C. D. On the Mechanism of Degradation of Oxytocin and Its Analogues in Aqueous Solution. Biopolymers 2013, 100, 408–421. 10.1002/bip.22260. [DOI] [PubMed] [Google Scholar]
- Hawe A.; Poole R.; Romeijn S.; Kasper P.; van der Heijden R.; Jiskoot W. Towards Heat-Stable Oxytocin Formulations: Analysis of Degradation Kinetics and Identification of Degradation Products. Pharm. Res. 2009, 26, 1679–1688. 10.1007/s11095-009-9878-2.. [DOI] [PMC free article] [PubMed] [Google Scholar]
- Anslyn E. V; Dougherty D. A. Modern Physical Organic Chemistry; University Science Books, 2006. [Google Scholar]
- Takayama K.; Hasegawa S.; Sasagawa S. Apparent Oral Toxicity of 18-Crown-6 in Dogs. Chem. Pharm. Bull. 1977, 25, 3125. 10.1248/cpb.25.3125.. [DOI] [PubMed] [Google Scholar]
- Hendrixson R. R.; Mack M. P.; Palmer R. A.; Ottolenghi A.; Ghirardelli R. G. Oral Toxicity of the Cyclic Polyethers-12-Crown-4, 15-Crown-5, and 18-Crown-6-in Mice. Toxicol. Appl. Pharmacol. 1978, 44, 263–268. 10.1016/0041-008X(78)90188-6. [DOI] [PubMed] [Google Scholar]
- Poole R. A.; Kasper P. T.; Jiskoot W. Formation of Amide- and Imide-Linked Degradation Products Between the Peptide Drug Oxytocin and Citrate in Citrate-Buffered Formulations. J. Pharm. Sci. 2011, 100, 3018–3022. 10.1002/jps.. [DOI] [PubMed] [Google Scholar]
Associated Data
This section collects any data citations, data availability statements, or supplementary materials included in this article.