Abstract
Determination of emulsion stability has important applications in crude oil production, separation, and transportation. The turbidimetry method offers advantage of rapid determination of stability at a relatively low cost with good accuracy. In this study, the stability of an oil-in-water (O/W) emulsion prepared by dispersing heavy oil particles in the aqueous solution containing poly(vinyl alcohol) (PVA) has been determined using turbidity measurements. The turbidimetry theory of emulsion stability has been validated using experimental data of turbidity at different wavelengths (350–800 nm) and storage times (0–300 min). The artificial neural network (ANN) has been found to give good predictive performance of the turbidity data. The characteristic change in turbidity has been supported using particle size and distribution analyses performed using optical/video microscopy. The results obtained from the turbidimetry correlation show that the emulsion destabilization rate constant (κ′, min–1) is in the range of 0.01–0.04 min–1 (at wavelengths between 350 and 800 nm, respectively). The rate constant remains unchanged (κ′ = 0.02 min–1) between the wavelength of 375 and 650 nm. In addition, the demulsification rate constant (κ′ = 0.015 min–1) obtained from kinetic modeling using the bottle test is in close agreement with this value. The overall findings ultimately revealed that the turbidimetry method could be used to determine stability of typical O/W emulsions with an acceptable level of accuracy.
1. Introduction
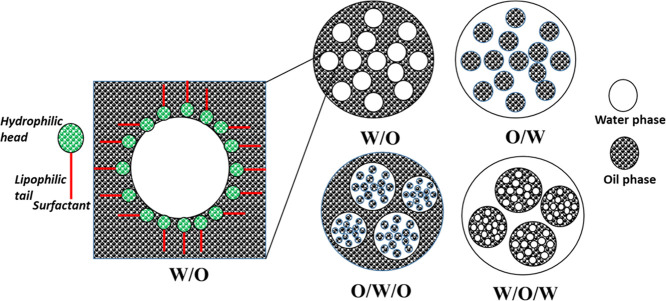
An emulsion is a liquid–liquid colloidal system in which the particles of one liquid are dispersed in the other.1,2 It consists of two or more completely or partially immiscible liquids, in which one liquid exists as the dispersed phase, in the form of droplets, suspended in the other continuous (liquid) phase.3 Emulsification is a collective process, which involves formation, characterization, and application of emulsion. There is originally the presence of an interfacial barrier (known as the interfacial tension, IFT), which prevents mixing of two immiscible liquids. Essentially, the formation of emulsions needs an energy input, which is traditionally achieved through shaking, stirring, or some other kind of intensive dynamic and/or static mixing processes4,5 and is aided by surface-active substances (i.e., surfactants), which assist in lowering the IFT and stabilize particles of the dispersed medium.6,7 As illustrated in Figure 1, the commonly reported types of emulsions encountered in the petroleum industries include the oil-in-water (O/W), water-in-oil (W/O), and complex ones (oil-in-water-in-oil, O/W/O or water-in-oil-in-water, W/O/W).8 An oil-in-water (O/W) emulsion is a liquid–liquid colloidal system in which the particles of oil are dispersed in a continuous water phase. On the other hand, a water-in-oil (W/O) emulsion contains water molecules dispersed in a continuous oil phase. While the W/O emulsion (and complex forms of emulsions) is usually associated with crude oil production where mixing occurs during the EOR method of heavy oil or bitumen using thermal fluid (steam), which subsequently leads to increased viscosity,9 the O/W emulsion leads to reduction in apparent viscosity of the original oil (due to the presence of a continuous water phase) and is desirable in both heavy oil production and long-distance pipeline transportation of heavy oil including bitumen.8,10
Figure 1.
Different types of emulsions.
Emulsions, in the petroleum industries, could have significant economic importance in various areas of oil recovery, production, and postproduction processing.11 Emulsification may be induced during recovery and production flow, in which shearing and contact of oil and water phases occur. Such processes include flow through the reservoir rock; bottom-hole perforations/pump; flow through tubing; flow lines; production headers, valves, fittings, and chokes; and surface equipment.12 Thus, the interest about separation of emulsion and/or emulsion destabilization has become a matter of concern in the oil industries. In addition, determination of emulsion stability or demulsification rate has important applications in areas such as design of unit processes and control, as well as in taking some relevant economic decision.13,14
Emulsions are inherently thermodynamically unstable because the surface of each droplet is an interface between hydrophobic and hydrophilic molecules.3 The forces that contribute to destabilization of emulsions include gravitational force, sedimentation or creaming, coalescence, flocculation, Ostwald ripening, and phase inversion.15,16 The destabilization forces however depend on other factors such as the type and concentration of surfactants, chemistry of the crude oil and its physical properties, interfacial activities, temperature, phase ratio, and emulsion morphology including droplet size distribution.17−19 Typically, flocculation of water droplets in W/O emulsions involves aggregation of droplets to form clusters, followed by sedimentation enhanced by gravity due to density difference, and subsequently phase separation.15 Moreover, the particle or droplet size distribution of an emulsion is affected by several variables including the energy input during mixing (mixing speed and time of mixing), type of mixer, oil composition, oil–water ratio, type and concentration of the surfactant or surface-active agent present, and formation temperature.20−22 Furthermore, the behavior of a multiphase system such as emulsion is significantly influenced by the particle size and distribution. It essentially plays a key role in the stability of emulsions.
There are several analytical techniques for determination of particle size and/or stability of emulsions. The detailed information about these methods is available elsewhere in the literature.3,15,23,25 The bottle test and visual observation during storage is the easiest and simplest method to directly obtain the stability of emulsions. However, it suffers from inaccuracy of the naked eye to clearly determine the phase separation. On the other hand, the commonly used advanced techniques include near-infrared spectroscopy (NIR) and microscopy including optical microscopy, transmission electron microscopy (TEM), and scanning electron microscopy (SEM). Others are charge analysis (using micro-electrophoretic techniques and electroacoustic spectroscopy), acoustics and electroacoustics, and nuclear magnetic resonance.3,15,24−26 However, these methods have various challenges such as complexity of operation, sensitivity of the equipment, accuracy of the measurement, lengthy time of operation, and high cost of the equipment.15,24−26
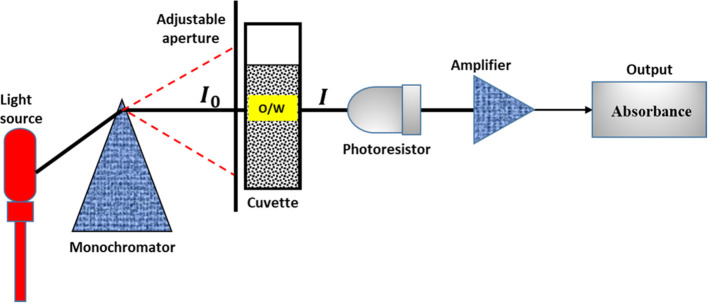
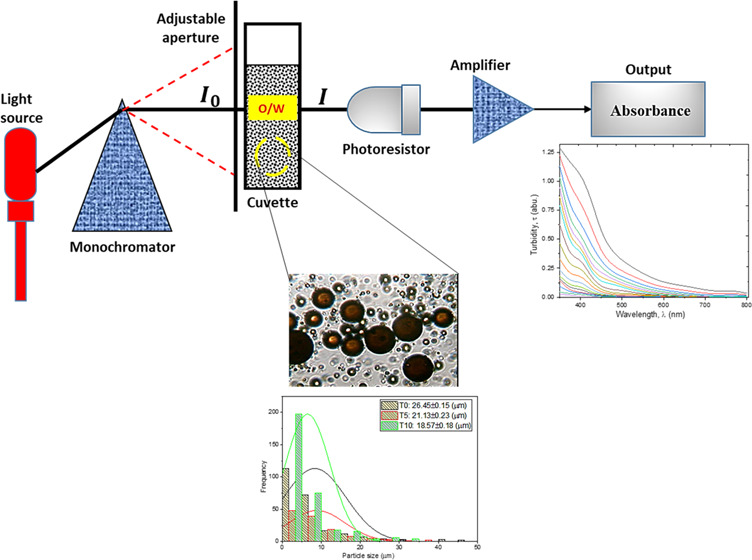
Turbidimetry is the quantitative measurement of the reflection or transmission properties of a substance as a function of wavelength. It measures the intensity of a light beam at different wavelengths (see Figure 2). The turbidity measurement is a simple and inexpensive method of determining the stability of an emulsion. It represents an indirect method for evaluation of emulsion stability by correlating the particle size distribution and the turbidity of colloidal systems.26 Previous researchers23−30 have reported the accuracy of this method compared with other techniques. The studies have found the turbidimetric method an efficient technique to characterize emulsion stability. Reddy and Fogler23 presented the theoretical and experimental turbidimetric evaluation of stability of an acoustically prepared paraffin oil-in-water emulsion. Similarly, Gunji et al.45 presented turbidimetric evaluation of stability of an oil-in-water emulsion stabilized with gum arabic. More recently, Song et al.24 employed the turbidimetric technique to determine the stabilities of water-in-oil emulsions at different hydrophile–lipophile balance (HLB) values, concentrations of emulsifiers, and water contents. In addition, the stability and flocculation rate of a dodecane-in-water nanoemulsion stabilized with sodium dodecyl sulfate was analyzed using the theory of turbidimetry.46 Compared to other methods, including the bottle test, the turbidity measurement offers advantage of rapid and accurate determination of emulsion stability.
Figure 2.
Schematic illustration of the spectrophotometric principle (I0 and I represent the intensity of the incident and transmitted light, respectively).
The purpose of this study is to validate the theory of turbidimetry in determining the kinetic stability of an O/W emulsion. It is intended to corroborate the accuracy of the method through particle size and distribution analyses using the optical and video microscopy. In addition, the destabilization rate constant (stability factor) obtained through the turbidity analysis is also compared with the one obtained from the kinetic analysis using the bottle test.
2. Theory: Determination of Emulsion Stability from Turbidity
Reddy and Fogler23 proposed a semiempirical equation to estimate the turbidity of an emulsion using turbidity data and wavelength. The turbidity (τ) of a polydisperse emulsion system is related to the intensity of the incident and transmitted light as follows (eq 1)
| 1 |
where l is the path length of the light, Ki is the total scattering coefficient, ai is the radius (cm) of particle i, and Ni is the concentration of the particles. Ki is related to the average particle radius (a̅) and the wavelength (λ) as given in eq 2
| 2 |
where K0 is the size-independent component of the scattering coefficient and m is the exponent of the wavelength. The value of m can be determined from the turbidity at different wavelengths (with a constant, C), as given in eq 3
| 3 |
By combining eqs 1 and 2, the turbidity is expressed as follows (eq 4)
| 4 |
Then, the volume (ϕ) of the dispersed phase is expressed in terms of particle radius and concentration as follows (eq 5)
| 5 |
Thus, turbidity can be expressed as a function of particle size as expressed in eq 6
| 6 |
where a32 is the average radius obtained from the Sauter mean
diameter  . Vp and Ap are the volume and surface area of the particle, respectively.
The ratio of the initial turbidity (τ0) to the turbidity at any time τ during the storage is expressed as follows (eq 7)
| 7 |
Then, the ratio of the auter mean radius (obtained as average particle radius) at any time to the mean radius of the particle at time zero could be approximated as given in eq 8
| 8 |
Also, the stability index
of an emulsion,  (i.e., the ration of the initial particle concentration (N0) to the concentration at any time N), can be expressed as given in eq 9
| 9 |
By combining eqs 8 and 9 with eq 7 and solving it gives the final expression for the stability index as a function of turbidity ratio, wavelength, and the initial average particle radius (eq 10)
| 10 |
3. Results and Discussion
3.1. Morphology of Emulsion (Particle Size and Distribution)
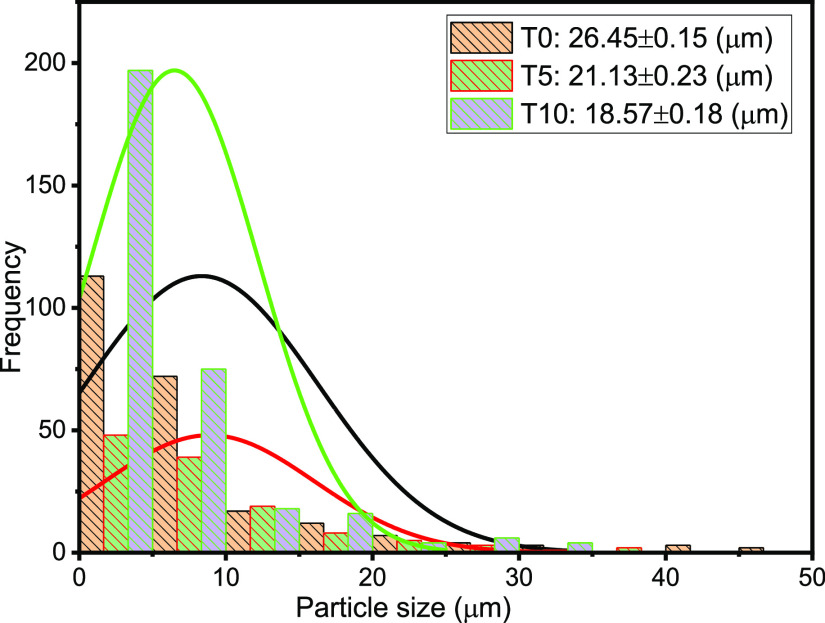
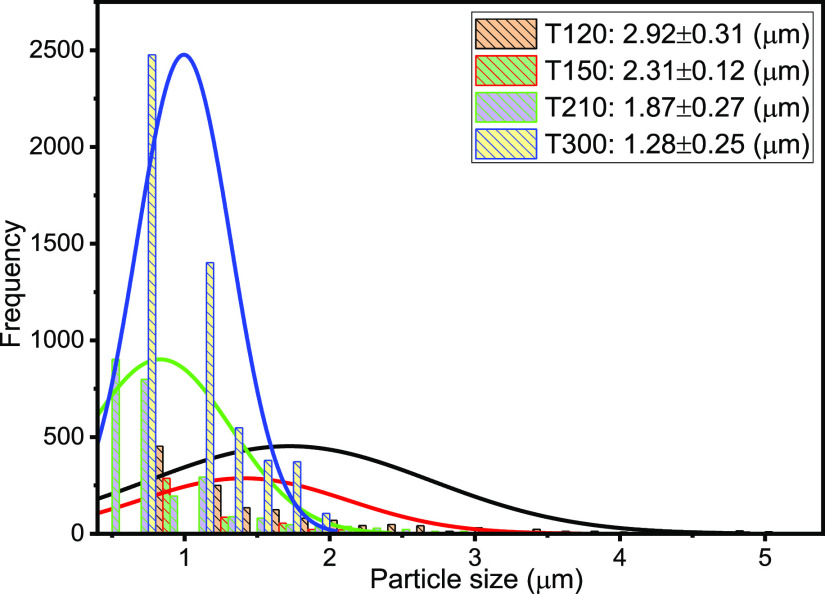
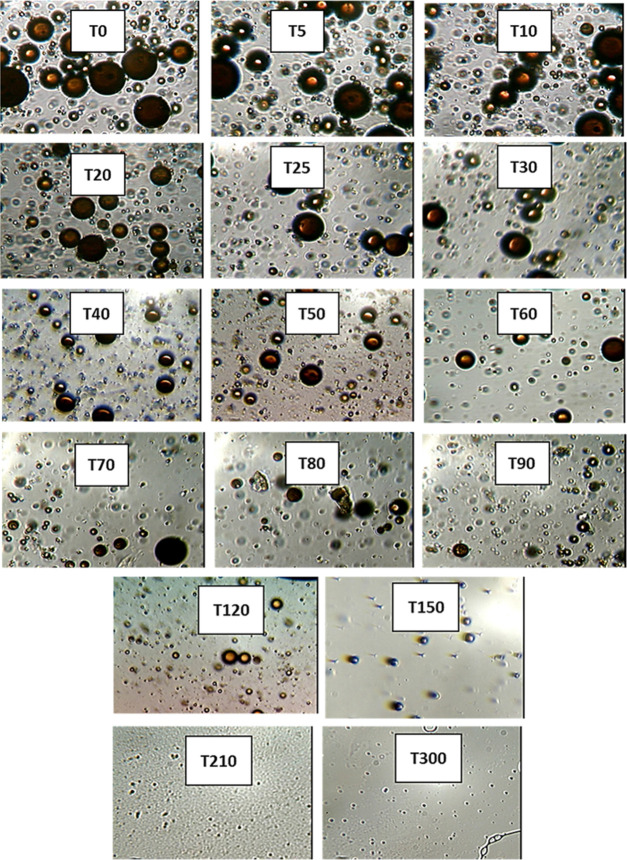
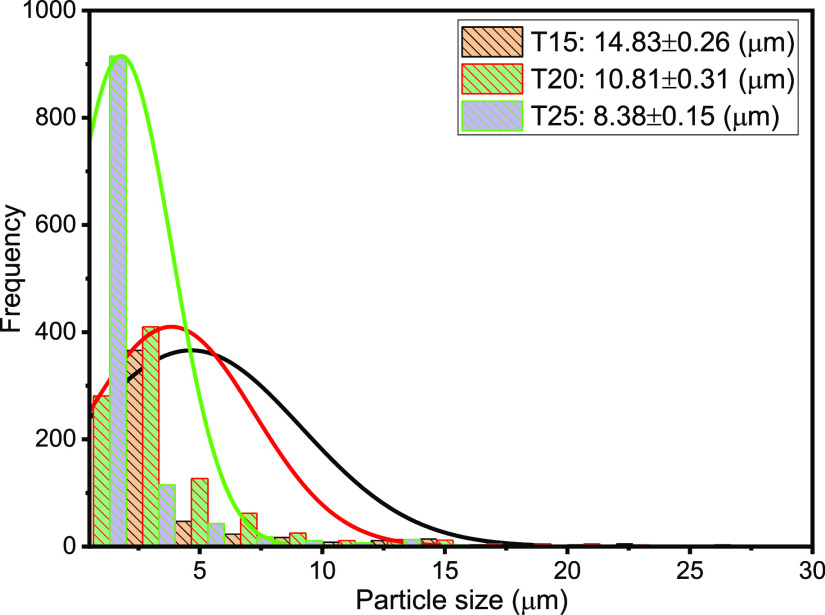
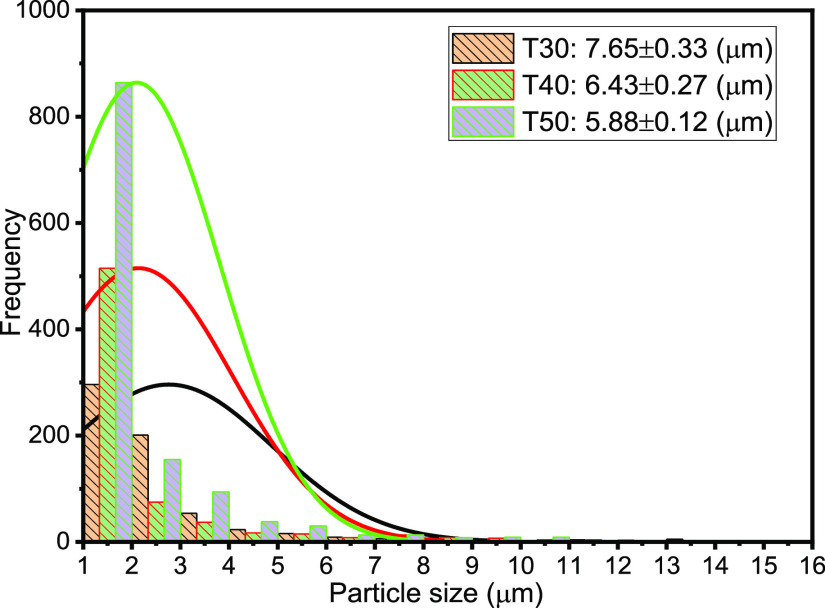
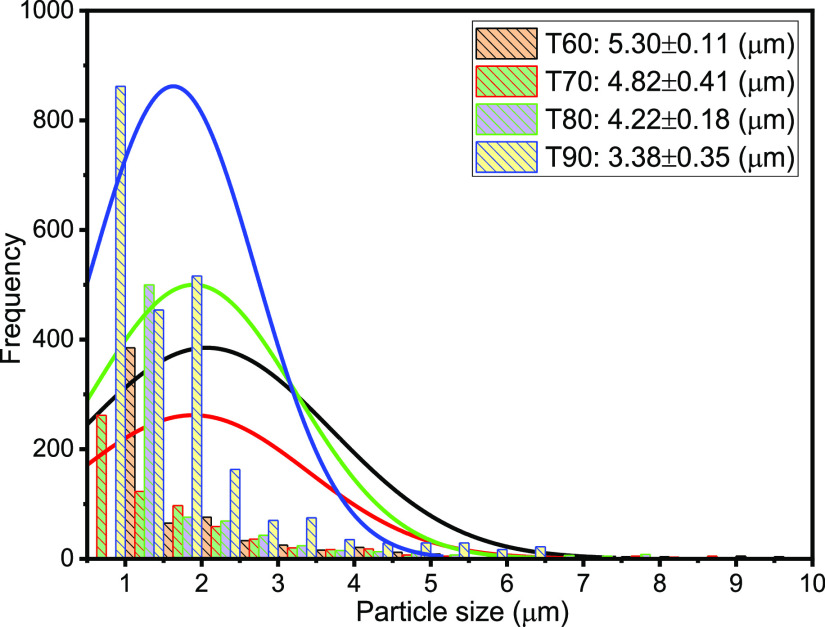
The droplet size distribution (DSD) of an emulsion is one of the critical factors, which controls its behavior including stability and flow properties.13,15,36,37 Thus, the DSD affects the destabilization processes, such as flocculation, coalescence, and resistance to sedimentation or creaming, and rheological properties.15Figures 3–7 present the particle sizes and size distributions of emulsion samples at different time intervals. The photomicrographic images of emulsion samples are presented in Figure 8 to support these results. The emulsions stabilized using PVA typically have low stability compared to the ones prepared using low-molecular-weight surfactants.10,32−34 It is generally observed from this work that the particle size decreases as the aging or sampling time increases. As expected, this observation essentially shows that destabilization increases with time. However, it is faster during the early storage times, 0–25 min (Figures 3 and 4), and becomes slower as the storage time increases from 30 to 90 min (Figures 5 and 6). Thereafter, from 120 to 150 min, the decrease in particle size becomes slowest, with almost a constant value between 210 and 300 min (Figure 7). In addition, it can be observed that the particle sizes are all polydisperse and that there is a larger population of smaller particles as the aging time increases. As a rule of thumb, under specific conditions, the smaller the droplets, the more stable the emulsions.15
Figure 3.
Particle sizes and distributions after 0, 5, and 10 min sampling times.
Figure 7.
Particle size and distributions after 120, 150, 210, and 300 min sampling times.
Figure 8.
Photomicrographs of emulsion particles at different aging times.
Figure 4.
Particle sizes and distributions after 15, 20, and 25 min sampling times.
Figure 5.
Particle sizes and distributions after 30, 40, and 50 min sampling times.
Figure 6.
Particle sizes and distributions after 60, 70, 80, and 90 min sampling times.
Specifically, the particle size distributions of the freshly prepared emulsion and after 5 and 10 min sampling times are compared in Figure 3. The freshly prepared emulsion (time t = 0) has average particle diameter 26.45 μm (±0.15), compared to 21.13 (±0.23) and 18.57 μm (±0.18) after 5 and 10 min, respectively. Similarly, from Figure 4, it is observed that the particle size decreases from 14.83 μm (±0.26) to 8.38 μm (±0.15) after 15 and 25 min, respectively. From Figure 5, it is observed that the particle sizes after 30 and 50 min are 7.65 μm (±0.33) and 5.88 μm (±0.12), respectively. A similar trend can be observed from Figure 6 as the particle size decreases from 5.3 μm (±0.11) to 3.38 μm (±0.35) after 60 and 90 min, respectively. Figure 7 shows that the size decreased from 2.92 μm (±0.31) to 1.28 μm (±0.25) after 120 and 300 min, respectively. Apparently, as seen in Figure 8, the separation reached equilibrium after this time, representing nearly complete phase separation.
3.2. Turbidity and Stability Factor of Emulsion
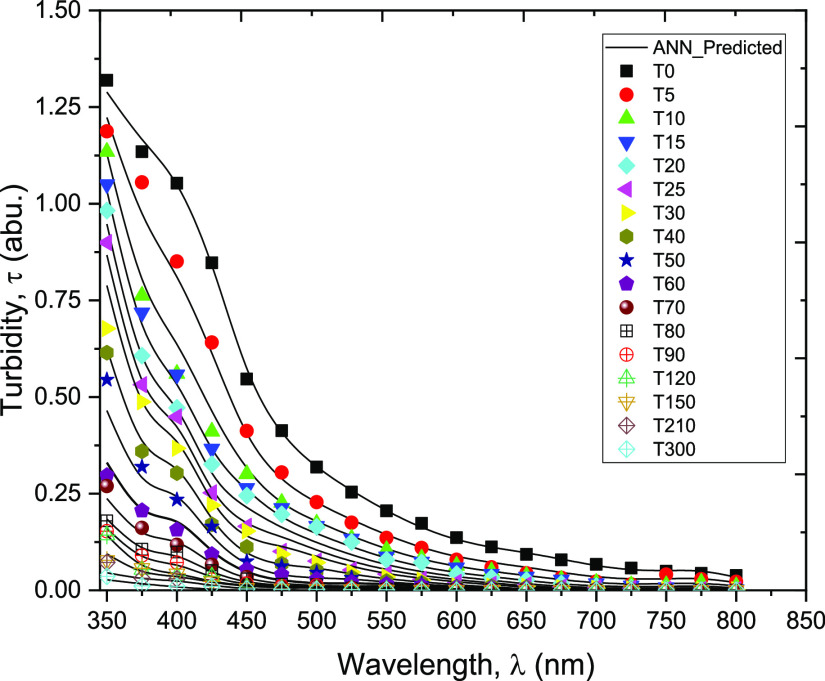
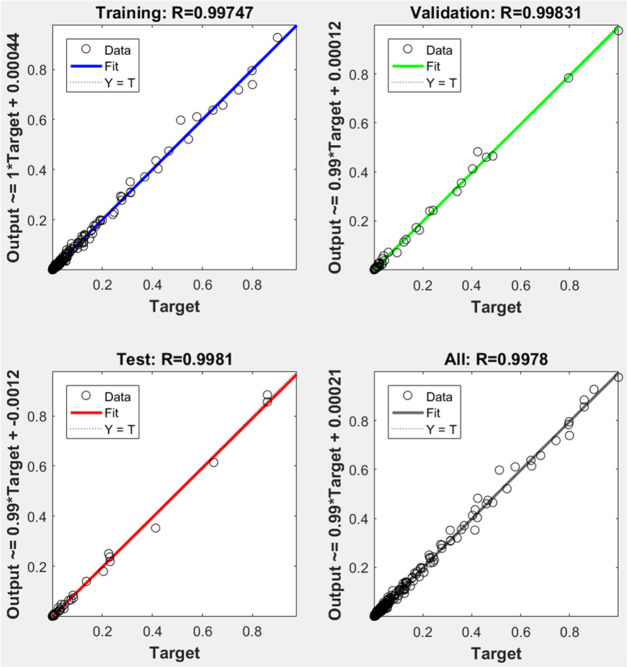
The artificial neural network (ANN) is an efficient method to model relationships among process variables and offers a number of advantages over the mechanistic models including the non-requirement of the mathematical description of the phenomena involved.37 The ANN technique has been used in various capacities to solve problems in different aspects of the petroleum industry.38−41 In a related approach to the one presented in this paper, Li et al.42 employed ANN to determine particle size distributions using neural networks from several spectral extinction measurements. Their efforts confirmed feasibility of the technique with advantages of simplicity of use, instantaneous delivery of results, and suitability for online particle size analysis. In this work, the measured and ANN-simulated turbidity values at different wavelengths (350–800 nm) and time intervals (0–300 min) are presented in Figure 9. The regression plot of the ANN predictive performance is presented in Figure 10. Figure 10 indicates good modeling and prediction of the data using the ANN model (R2> 0.99). The present technique essentially offers the advantage of predicting the turbidity of an emulsion at any given time during storage.
Figure 9.
Plots of measured and ANN-predicted turbidity values versus wavelength at different time intervals.
Figure 10.
ANN regression plots for training and predicting turbidity.
From Figure 9, it can generally be observed that the turbidity decreases with the wavelength and similarly decreases with the sampling time intervals, as the emulsion ages. These observations closely agreed with those reported in the previous works.23,24 The present results can also be corroborated with the observations from the particle size and distribution reported in the previous section (see Section 3.1). In addition, they show that the turbidity values, at different wavelengths (350 and 650 nm), are relatively high within the early period of storage (between 0 and 70 min). Conversely, the change in turbidity becomes less prominent at higher wavelengths (675 and 800 nm) and sampling times (80 and 300 min). These observations are probably due to low stability of the emulsion under investigation, as reported in our previous works,10 and in agreement with those reported by other investigators.32,33 Based on the interactions between the vinyl acetate units of PVAs and the oil droplets and on the presence of resin-stabilized asphaltenic aggregates at the interface, PVA is understood to enhance stability through adsorption at the oil–water interfaces, which subsequently induces steric repulsions between the oil droplets. However, the steric repulsion effect of PVA is believed to be most active, typically, during the first 15 min of the separation process.32 Moreover, depending on the mixing speed and other factors such as the salinity of the aqueous phase, oil–water ratio, and concentration and chemical properties of PVA, the emulsion stabilized using PVA generally has low stability and separates within 1 hour of storage without any chemical demulsifier additive.10,32
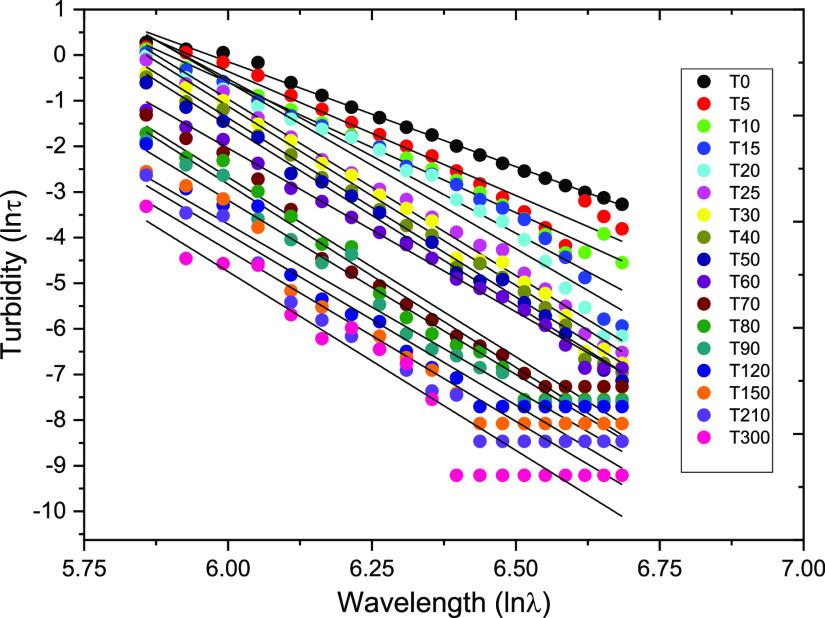
Furthermore, the magnitude of variation of turbidity with the wavelength measured as exponent m (see eq 3) is plotted in Figure 11. The linear plots can be observed to give good fittings with the values of m in the range of −8.03 to −4.60 as shown in Table 1. From these results, the average value of m (−7.71644) was used to calculate the stability factor (N0/N) using eq 10. It is worth mentioning that the abilities to absorb and scatter light are the two most critical factors that determine emulsion turbidity.43 Previous researchers23,30 have theoretically and experimentally assessed the sensitivity of the turbidity to the wavelength for different colloidal dispersions. Thus, the accuracy and measurement error in this method may be due to uncertainty in the turbidity and/or the wavelength exponent (m). As available elsewhere in the literature,23,27 the values of m differ among different dispersion systems.
Figure 11.
Linear fittings of turbidity and wavelength at different sampling times.
Table 1. Values of m Obtained from eq 3.
| time (min) | m | R2 |
|---|---|---|
| 0 | –4.60 | 0.99 |
| 5 | –5.44 | 0.96 |
| 10 | –5.72 | 0.99 |
| 15 | –6.76 | 0.95 |
| 20 | –7.31 | 0.95 |
| 25 | –7.74 | 0.99 |
| 30 | –7.86 | 0.99 |
| 40 | –7.85 | 0.99 |
| 50 | –7.89 | 0.99 |
| 60 | –7.18 | 0.99 |
| 70 | –7.87 | 0.96 |
| 80 | –8.03 | 0.97 |
| 90 | –7.64 | 0.96 |
| 120 | –7.28 | 0.91 |
| 150 | –7.49 | 0.92 |
| 210 | –7.51 | 0.90 |
| 300 | –7.84 | 0.89 |
As available in the literature, values of m ranging from approximately −1.0 to +0.8 were found for carbon black dispersions, while −0.5 was reported for the Graphon/n-heptane system.29 Then, from the turbidity spectra measured within the 400–600 nm spectral band for silica nanoparticle suspension, Khlebtsov et al.44 reported the wavelength exponent between 2.6 and 3.8. In addition, for turbidimetric determination of the stability of acoustically prepared paraffin oil-in-water emulsions, in the wavelength between 400 and 500 nm, the exponent value = −0.606 to +0.255 was reported, and for 400–480 nm, the exponent ranging between −0.610 and +0.459 was reported.23
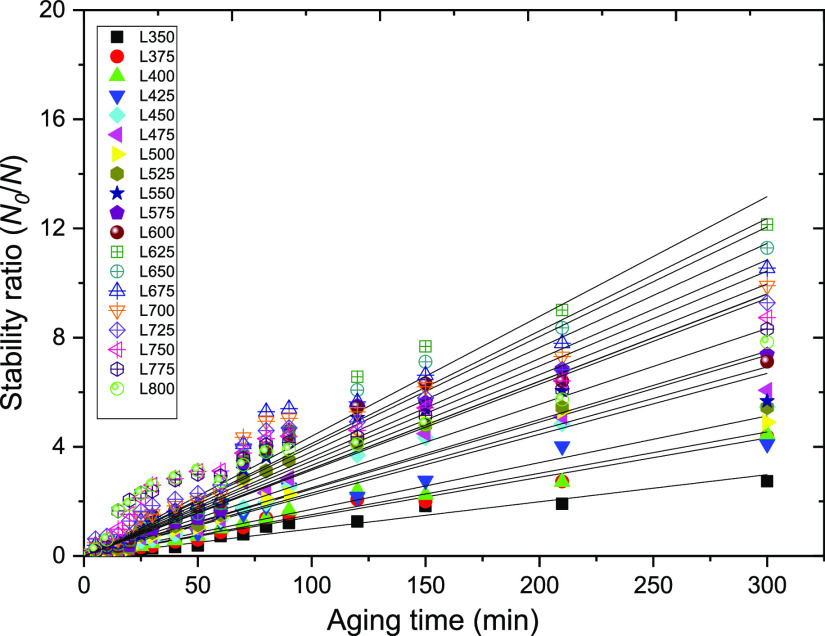
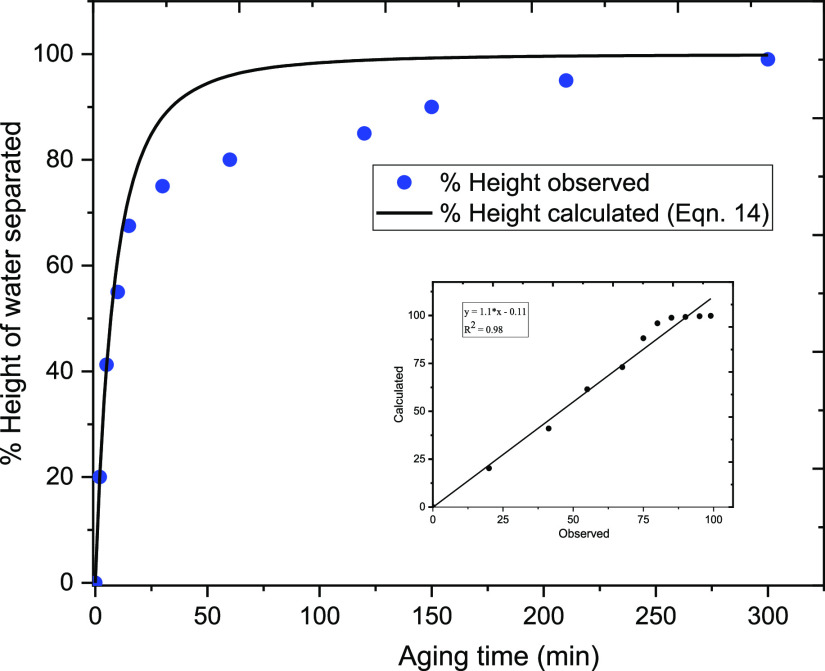
Finally, as presented in Figure 12, the stability factor plotted against the time intervals ((N0/N) – 1 versus time) gave the values of destabilization rate constant (κ′: min–1), which range between 0.01 and 0.04 min–1 (at wavelengths between 350 and 800 nm, respectively; see Table 2). The results obtained herein compare fairly well with those reported for the bottle tests by Civan et al.14 As presented in Table 2, it can be observed that the value of rate constant remains unchanged between the wavelengths of 375 and 650 nm (i.e., κ′ = 0.02 min–1). Moreover, as shown in Figure 13, this value is consistent with the value of the rate constant (κ′ = 0.015 min–1) obtained using the bottle test and calculated from eq 14 with the order of reaction (n) = 1.45.
Figure 12.
Plots of emulsion stability ratio measured at different wavelengths.
Table 2. Values of Destabilization Rate Constants at Different Wavelengths.
| wavelength (λ) | κ′ (min–1) | R2 |
|---|---|---|
| 350 | 0.01 | 0.98 |
| 375 | 0.02 | 0.99 |
| 400 | 0.02 | 0.98 |
| 425 | 0.02 | 0.95 |
| 450 | 0.02 | 0.96 |
| 475 | 0.02 | 0.95 |
| 500 | 0.02 | 0.91 |
| 525 | 0.02 | 0.92 |
| 550 | 0.02 | 0.89 |
| 575 | 0.02 | 0.93 |
| 600 | 0.02 | 0.98 |
| 625 | 0.02 | 0.96 |
| 650 | 0.02 | 0.90 |
| 675 | 0.03 | 0.93 |
| 700 | 0.04 | 0.82 |
| 725 | 0.04 | 0.76 |
| 750 | 0.04 | 0.78 |
| 775 | 0.03 | 0.81 |
| 800 | 0.04 | 0.82 |
Figure 13.
Observed and predicted heights of the water phase separated with the aging time of emulsion samples.
4. Conclusions
Determination of emulsion stability plays a key role in process design and development for separation and production operations in the oil industry. Several techniques have been developed for determination of particle size and/or stability of emulsions. These methods have different challenges including complexity of operation, sensitivity of the equipment, accuracy of the measurement, lengthy time of operation, and high cost of the equipment. In this study, experiments have been conducted using O/W emulsions to validate the theory of turbidimetric determination of emulsion stability. The findings from the turbidity measurement have been supported using particle size and distribution analyses performed using optical/video microscopy. Moreover, the destabilization rate constant obtained from the turbidity test (between wavelengths 375 and 650 nm) has been found to be close to the one obtained from the kinetic modeling using the bottle test. Therefore, it can be concluded that the method under investigation can be used to determine the stability of typical O/W emulsions with an acceptable level of accuracy within these wavelengths..
5. Materials and Methodology
5.1. Materials
In this study, a heavy oil sample (kinematic viscosity at 50 °C = 6970 mm2/s, density at 15 °C = 1016.4 kg/m3, and °API = 7.60) was used as a dispersed phase, while the aqueous phase containing 0.5% w/w hydrophilic polymeric surfactant, poly(vinyl alcohol) (PVA), supplied by Kuraray Co., Ltd., Japan, was the continuous phase. PVA has a molecular weight of 41 Kg/mol, a viscosity (at 25 °C) of 2.75 cP, and a density (at 25 °C) of 1.0005 g/cm3, while the degree of hydrolysis is 88 mol %. The solution also contains 1% w/w salt (sodium chloride (NaCl) supplied by Junsei Chemical Co., Ltd., Japan, and the purity is 99.55%).
5.2. Methodology
5.2.1. Preparation of O/W Emulsion
The O/W emulsion was prepared by mixing the oil sample in the aqueous solution (ratio 1:1) in a 50 mL Pyrex glass bottle at 500 rpm mixing speed and 40 °C temperature for 10 min using a hot plate with a magnetic stirrer (REXIM RSH-1D, Japan). Then, 25 mL of emulsion was prepared during each batch mixing when required. Samples were collected for particle size analysis using microscopy, stability bottle tests, and turbidity tests.
5.2.2. Particle Size Analysis
The emulsion particle size was measured using optical/video microscopy with a light microscope (objective lenses 40/0.65 and 160/0.17) interfaced with a computer. For each test, a drop (from the storage; see Section 5.3.4) was carefully put on a microscope slide (76 mm × 26 mm, 0.3–1.0 mm; Matsunami Glass, Osaka, Japan) and a cover slip (22 mm × 22 mm, 0.12–0.17 mm thick; Matsunami Glass, Osaka, Japan) was placed over it immediately. Then, video and still images of the emulsion particles were recorded. The particle sizes were determined using ImageJ software following the image enhancement procedure recommended by Moradi et al.15 The average diameters of the particles in the emulsions were estimated using the Sauter mean volume diameter (d32), which is given by eq 11
| 11 |
where ni is the number of droplets counted as the ith diameter (di) of the droplet (μm). The particle size distribution was expressed as the lognormal probability density function f(x), eq 12
| 12 |
where x is the particle size, σ is the shape parameter (and is the standard deviation of the log of the distribution), and ω is the mean of the log of the distribution.
5.2.3. Bottle Test and Rate Law
The kinetic stability of each emulsion during settling was studied using the bottle test. About 8 mL of a freshly prepared emulsion was transferred into a graduated 10 mL Pyrex glass test tube (with cap) and immediately covered to avoid evaporation. Phase separation was observed by visual observation in real time with the aid of a monochromatic light source (LA-150TX, Hayashi, Tokyo, Japan).
In the previous studies, differential rate analysis has been used to determine the stability of emulsion.35 The change in stability of emulsion Se [i.e., percentage water separated (%H = 100 – Se)] as the bitumen particles creamed at a storage temperature of 25 °C was expressed as follows (eq 13)
| 13 |
Taking the following initial conditions
| 14 |
then, eq 13 is expressed in a linear form as follows (eq 14)
| 14 |
From eq 14, determination of demulsification
rate constant, κ′ (min–1), and the
order n could be sought using the differential method
of analysis.31 Taking Se = 100%, a plot of  against log10 Se gives a straight line whose slope is n and intercept is κ′.
5.3.4. Turbidity Measurement
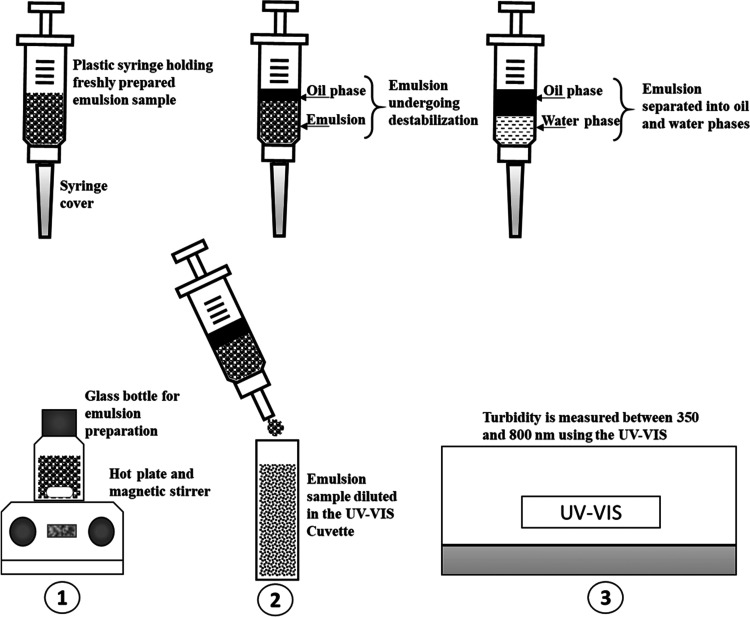
The schematic of the emulsion preparation and turbidity measurement procedure is described in Figure 14. The freshly prepared emulsion sample was transferred into a 5 mL plastic syringe and was immediately covered with a cap. It was carefully placed in the rack to allow creaming at different time intervals (from 0 to 300 min). The emulsification experiment was repeated for different sampling intervals. For the turbidity measurement, about 0.5–1 mL of the emulsion sample was carefully dispensed from the syringe and was diluted with an appropriate quantity of filtered water. The absorbance was measured using a UV-visible spectrophotometer (UV-2450, Shimadzu, Japan) between the wavelengths of 350 and 800 nm, at each sampling time interval. Figure 15 shows the typical samples of a diluted emulsion in a UV cuvette (note: the sample was placed for measurement immediately after dilution, so the photos displayed in Figure 15 were taken after the measurement of absorbance).
Figure 14.
Simplified schematic of emulsion preparation and turbidity test. Top: storage of the emulsion sample. Bottom: (1) emulsion preparation, (2) emulsion dilution using filtered water in the cuvette, and (3) turbidity measurement in the UV–vis spectrophotometer.
Figure 15.
Diluted samples of an O/W emulsion taken at different sampling time intervals (0–300 min).
5.3.5. Processing of Turbidity Data
The absorbance data obtained from the turbidity measurement was modeled using the artificial neural network (ANN). The inputs are the time interval (0–300 min) of sampling and wavelength (350–800 nm). The target is turbidity or the absorbance values. In this work, a multilayer feedforward neural network was implemented using the Neural Network Toolbox in MATLAB (MATLAB 2016b, The Mathworks, Inc.). The feedforward neural network utilizes the Levenberg–Marquardt (LM) back-propagation learning algorithm, which is an error minimization technique with backward error propagation (the ANN architecture is shown in Figure 16). To improve the performance of the network, the input and output data were normalized between 0 and 1 as given in eq 15.
| 15 |
where xnorm is the normalized value of the input data and xac and xmax represent any value and the maximum value of the input data, respectively.
Figure 16.
ANN fitting network architecture.
Then, the turbidity data obtained from the ANN simulation was used for calculating the exponent value (m) from eq 3, as well as the stability factor (N0/N) using eq 10. Subsequently, the demulsification rate constant (κ′: min–1) was obtained by plotting (N0/N) – 1 versus time (t).
Acknowledgments
The College of Petroleum and Geoscience (CPG) at King Fahd University of Petroleum & Minerals is acknowledged for the support in publishing this work.
The authors declare no competing financial interest.
References
- Shaw D. J.Butterworth-Heinemann, 4th ed.; Elsevier Science Linacre House: Jordan Hill, Burlington, 2003; pp 1–5. [Google Scholar]
- Fakoya M. F.; Ahmed R. M. A generalized model for apparent viscosity of oil-based muds. J Pet Sci Eng. 2018, 165, 777–785. 10.1016/j.petrol.2018.03.029. [DOI] [Google Scholar]
- Weiss J. Emulsion stability determination. Curr Protoc Food. Anal Chem. 2002, 3, D3.4.1–D3.4.17. 10.1002/0471142913.fad0304s03. [DOI] [Google Scholar]
- Hasan S. W.; Ghannam T. M.; Esmail N. Heavy crude oil viscosity reduction and rheology or pipeline transportation. Fuel 2010, 89, 1095–1100. 10.1016/j.fuel.2009.12.021. [DOI] [Google Scholar]
- Bennion D. B.; Chan M.; Sarioglu G.; Courtnage D.; Wansleeben J.; Hirata T.. The In-situ Formation of Bitumen-water Stable Emulsions in Porous Media during Thermal Stimulation, 1993. SPE International Thermal Operations Symposium (Bakersfield, California), SPE-25802-MS.
- Clausse D.; Gomez F.; Dalmazzone C.; Noik C. A Method for the Characterization of Emulsions, Thermo granulometry: Application to water-in-crude oil Emulsion. J. Colloid Interface Sci. 2005, 287, 694–703. 10.1016/j.jcis.2005.02.042. [DOI] [PubMed] [Google Scholar]
- Fradette L.; Brocart B.; Tanguy P. A. Comparison of Mixing Technologies for the Production of Concentrated Emulsions. Chem. Eng. Res. Des. 2007, 85, 1553–1560. 10.1205/cherd06015. [DOI] [Google Scholar]
- Martínez-Palou R.; María de Lourdes M.; Zapata-Rendón B.; Mar-Juárez E.; Bernal- Huicochea C.; Juan de la Cruz C.; Jorge A. Transportation of heavy and extra-heavy crude oil by pipeline: A review. J. Pet. Sci. Eng. 2011, 75, 274–282. 10.1016/j.petrol.2010.11.020. [DOI] [Google Scholar]
- Alade O. S.; Al Shehri D. A.; Mahmoud M. Investigation into the effect of silica nanoparticles on the rheological characteristics of water-in-heavy oil emulsions. Pet. Sci. 2019, 16, 1374–1386. 10.1007/s12182-019-0330-x. [DOI] [Google Scholar]
- Alade O. S.; Sasaki K.; Sugai Y.; Ademodi B.; Nakano M. Bitumen emulsification using a hydrophilic polymeric surfactant: Performance evaluation in the presence of salinity. J. Pet. Sci. Eng. 2016, 138, 66–76. 10.1016/j.petrol.2015.11.031. [DOI] [Google Scholar]
- Wong S. F.; Lim J. S.; Dol S. S. Crude oil emulsion: A review on formation, classification and stability of water-in-oil emulsions. J. Pet. Sci. Eng. 2015, 135, 498–504. 10.1016/j.petrol.2015.10.006. [DOI] [Google Scholar]
- Umar A. A.; Mohd Saaid I.; Sulaimon A. A.; Mohd Pilus R. A review of petroleum emulsions and recent progress on water-in-crude oil emulsions stabilized by natural surfactants and solids. J. Pet. Sci. Eng. 2018, 165, 673–690. 10.1016/j.petrol.2018.03.014. [DOI] [Google Scholar]
- Krebs T.; Schroen C. G. P. H.; Boom R. M. Separation Kinetics of an Oil-in water Emulsion under Enhanced Gravity. Chem. Eng. Sci. 2012, 71, 118–125. 10.1016/j.ces.2011.10.057. [DOI] [Google Scholar]
- Civan F.; Alarcon L. J.; Campbell S. E. Laboratory confirmation of new emulsion stability model. J. Pet. Sci. Eng. 2004, 43, 25–34. 10.1016/j.petrol.2003.11.002. [DOI] [Google Scholar]
- Moradi M.; Alvarado V.; Huzurbazar S. Effect of salinity on water-in-crude oil emulsions: evaluation through drop-size distribution proxy. Energy Fuels 2011, 25, 260–268. 10.1021/ef101236h. [DOI] [Google Scholar]
- Yang Q.; Ke D.; Yang M.; Hong J.; Ran Q.; Wang X. Effect of Salt Concentration on the Phase Separation of Bitumen Emulsions. Colloids Surf., A. 2013, 425, 1–5. 10.1016/j.colsurfa.2013.02.041. [DOI] [Google Scholar]
- Fingas M.Stability and Resurfacing of Dispersed Oil. http://pwsrcac.org/docs/d0026200.pdf. 2013, Retrieved December, 2020 from www.google.com.
- Badolato G. G.; Aguilar F.; Schuchmann H. P.; Sobisch T.; Lerche D.. Evaluation of Long Term Stability of Model Emulsions by Multisample Analytical Centrifugation. In Surface and Interfacial Forces—From Fundamentals to Applications. Progress in Colloid and Polymer Science, Auernhammer G. K.; Butt H. J.; Vollmer D., Eds.; Springer: Berlin, Heidelberg, 2008; Vol. 134, pp 66–73. [Google Scholar]
- Al-Sabagh A. M.; Nasser N. M.; Abd El-Hamid T. M. Investigation of kinetic and rheological properties for the demulsification process. Egypt. J. Pet. 2013, 22, 117–127. 10.1016/j.ejpe.2012.11.013. [DOI] [Google Scholar]
- Al-Roomi Y.; George R.; Elgibaly A.; Elkamel A. Use of a novel surfactant for improving the transportability/transportation of heavy/viscous crude oils. J. Pet. Sci. Eng. 2004, 42, 235–243. 10.1016/j.petrol.2003.12.014. [DOI] [Google Scholar]
- Dong M.; Ma S.; Liu Q. Enhanced heavy oil recovery through interfacial instability: A study of chemical flooding for Brintnell heavy oil. Fuel 2009, 88, 1049–1056. 10.1016/j.fuel.2008.11.014. [DOI] [Google Scholar]
- Fan Y.; Simon S.; Sjoblom J. Interfacial shear rheology of asphaltenes at oil–water interface and its relation to emulsion stability: Influence of concentration, solvent aromaticity and nonionic surfactant. Colloids Surf., A. 2010, 366, 120–128. 10.1016/j.colsurfa.2010.05.034. [DOI] [Google Scholar]
- Reddy S. R.; Fogler H. A. Emulsion Stability: Determination from Turbidity. J. Colloid Interface Sci. 1981, 79, 101–104. 10.1016/0021-9797(81)90052-7. [DOI] [Google Scholar]
- Song M. G.; Cho S. H.; Kim J. Y.; et al. Novel evaluation method for the water- in- oil (W/O) emulsion stability by Turbidity Ratio Measurements. Korean J. Chem. Eng. 2002, 19, 425–430. 10.1007/BF02697151. [DOI] [Google Scholar]
- Hu Y.; Ting Y.; Hu J.; Hsieh S. Techniques and methods to study functional characteristics of emulsion systems. J. Food Drug Anal. 2017, 25, 16–26. 10.1016/j.jfda.2016.10.021. [DOI] [PMC free article] [PubMed] [Google Scholar]
- Frentcel M.; Shwartz R.; Garti N. Turbidity measurements as a technique for Evaluation of water-in-oil emulsion stability. J. Dispersion Sci. Technol. 1982, 3, 195–207. 10.1080/01932698208943633. [DOI] [Google Scholar]
- Liu J.; Xu S.; Sun Z. Toward an Understanding of the Turbidity Measurement of Heterocoagulation Rate Constants of Dispersions Containing Particles of Different Sizes. Langmuir 2007, 23, 11451–11457. 10.1021/la701426u. [DOI] [PubMed] [Google Scholar]
- Yang K. C.; Hogg R. Estimation of particle size distributions from turbidiometric measurements. Anal. Chem. 1979, 51, 758–763. 10.1021/ac50042a041. [DOI] [Google Scholar]
- Parfitt G. D.; Willis E. Stability of non-aqueous dispersions: II Graphon in solutions of alkyl benzenes in n-heptane. J. Colloid Interface Sci. 1966, 22, 100–106. 10.1016/0021-9797(66)90070-1. [DOI] [Google Scholar]
- Melik D. H.; Fogler H. S. Turbidiometric determination of particle size distributions of colloidal systems. J. Colloid Interface Sci. 1983, 92, 61–180. 10.1016/0021-9797(83)90125-X. [DOI] [Google Scholar]
- Levenspiel O.Chemical Reaction Engineering, Vol. 3; John Wiley & Sons: USA, 1999; pp 13–14. [Google Scholar]
- Nguyen D.; Balsamo V. Emulsification of heavy oil in aqueous solutions of poly (vinyl alcohol): A method for reducing apparent viscosity of production fluids. Energy Fuels 2013, 27, 1736–1747. 10.1021/ef3014986. [DOI] [Google Scholar]
- Fletcher P.; Bolton G.; Forsyth J.; Jaska C.; Cobos S.. The Pipeline Transportation of Heavy Oil Using Water Based Dispersions. World Heavy Oil Congress: Aberdeen Scotland, 2012, WHOC12-185. [Google Scholar]
- Abdurahman N. H.; Rosli Y. M.; Azhari N. H.; Hayder B. A. Pipeline Transportation of Viscous Crudes as Concentrated Oil-in-water Emulsions. J. Pet. Sci. Eng. 2012, 90–91, 139–144. 10.1016/j.petrol.2012.04.025. [DOI] [Google Scholar]
- Alade O. S.; Sasaki K.; Ogunlaja A. S.; Sugai Y.; Ademodi B.; Nakano M. Kinetic analysis and modeling of stability of bitumen-in-water emulsion stabilized by polyvinyl alcohol (PVA). Pet. Sci. Technol. 2016, 34, 184–191. 10.1080/10916466.2015.1118499. [DOI] [Google Scholar]
- Borges G. R.; Farias G. B.; Braz T. M.; Santos L. M.; Amaral M. J.; Fortuny M.; Franceschi E.; Dariva C.; Santos A. F. Use of near infrared for evaluation of droplet size distribution and water content in water-in-crude oil emulsions in pressurized pipeline. Fuel 2015, 147, 43–52. 10.1016/j.fuel.2015.01.053. [DOI] [Google Scholar]
- Alade O.; Al Shehri D.; Mahmoud M.; Sasaki K. Viscosity–Temperature–Pressure Relationship of Extra-Heavy Oil (Bitumen): Empirical Modelling versus Artificial Neural Network (ANN). Energies 2019, 12, 2390. 10.3390/en12122390. [DOI] [Google Scholar]
- Kiss A.; Fruhwirth K. R.; Leoben M.; Pongratz R.; Maier R. In Formation breakdown pressure prediction with artificial neural networks. Proceedings of the SPE International Hydraulic Fracturing Technology Conference and Exhibition, Muscat, Oman, 16–18 October 2018, SPE-191391-18IHFT-MS.
- Adeeyo Y. A.; Saaid M. I. In Artificial Neural Network Modeling of Viscosity at Bubble-point Pressure and Dead Oil Viscosity of Nigerian Crude Oil. Proceedings of the SPEk NAICE Conference, Lagos, Nigeria, 31 July–2 August, 2017, SPE-189142-MS.
- Elkatatny S.; Tariq Z.; Mahmoud M. Real time prediction of drilling fluid rheological properties using artificial neural networks visible mathematical model (white box). J. Pet. Sci. Eng. 2016, 146, 1202–1210. 10.1016/j.petrol.2016.08.021. [DOI] [Google Scholar]
- Ghaffarian N.; Eslamloueyan R.; Vaferi B. Model identification for gas condensate reservoirs by using ANN method based on well test data. J. Pet. Sci. Eng. 2014, 123, 20–29. 10.1016/j.petrol.2014.07.037. [DOI] [Google Scholar]
- Li M.; Frette T.; Wilkinson D. Particle Size Distribution Determination from Spectral Extinction Using Neural Networks. Ind. Eng. Chem. Res. 2001, 40, 4615–4622. 10.1021/ie000826+. [DOI] [Google Scholar]
- Linke C.; Drusch S. Turbidity in oil-in-water-emulsions — Key factors and visual perception. Food Res. Int. 2016, 89, 202–210. 10.1016/j.foodres.2016.07.019. [DOI] [PubMed] [Google Scholar]
- Khlebtsov B. N.; Khanadeev V. A.; Khlebtsov N. G. Determination of the size, concentration, and refractive index of silica nanoparticles from turbidity spectra. Langmuir 2008, 24, 8964–8970. 10.1021/la8010053. [DOI] [PubMed] [Google Scholar]
- Gunji M.; Ueda H.; Ogata M.; Nakagaki M. Studies on the Oil- in-Water Emulsions Stabilized with Gum-Arabic by using the turbidity ratio method. Yakugaku Zasshi 1992, 112, 906. 10.1248/yakushi1947.112.12_906. [DOI] [Google Scholar]
- Rahn-Chique K.; Puertas A. M.; Romero-Cano S. M.; Rojas C.; Urbina-Villalba G. Nano-emulsion stability: Experimental evaluation of the flocculation rate from turbidity measurements. Adv. Colloid Interface Sci. 2012, 178, 1–20. 10.1016/j.cis.2012.05.001. [DOI] [PubMed] [Google Scholar]


