

Abstract
A two-step process of carbonization coupled with steam activation was proposed for wooden activated carbon production from four kinds of biomass waste materials. The TG-FTIR results show that the carbonization process started at around 250 °C and finished at 500 °C for the coconut shell, pinewood, and plywood. The carbonization temperature of corn straw was lower than those of the other three samples, which was attributed to the higher concentration of ash content. FTIR results for the volatile compounds during carbonization show that CH4, CO, CO2, and hydrocarbons are the main detected gaseous species. The CH4 and CmHn yields of pinewood and plywood are higher than those of the coconut shell and corn straw. The carbonization results on the tubular furnace reactor show that furfural and phenol and its derivatives are the main tar compounds in waste carbonization. Carbonization experiments show that a temperature of 500 °C and residence time of 30 min are the optimized parameters for the three biomass wastes. The char yields are 26.4, 25.73, and 30.38% for pinewood, plywood, and coconut shell, respectively. CFD modeling has proven that using 20% of the volatiles could achieve lowest pollution and provide heat for carbonization of biomass waste. The steam activation results show that an activation temperature of 800 °C and activation time of 30 min are suitable for all three biomass samples, which could obtain optimized AC yields and adsorption quality for dioxin.
1. Introduction
Biomass is a kind of traditional resource that has existed on Earth for billions of years. Different from traditional biomass utilization methods (cooking and heating), diversified clean and high-efficiency biomass conversion technologies have been developed in recent decades, such as pyrolysis, gasification, clean combustion, and digestion, which are apt to be coupled with the existing fossil fuel utilization systems.1 What is more, biomass is the only carbonaceous and carbon-neutral renewable energy, which could be converted into fuels and chemicals. Based on the above advantages, biomass is considered as one of the most potential renewable energies in the future.
In addition to being an energy source, biomass can also become an excellent environmental protection material after a specific conversion or treatment. The most common utilization is the preparation of activated carbon with developed adsorption capacity.2,3 Compared with coal, biomass has higher activity and the pore structure of activated carbon is more developed. In the traditional activated carbon production industry, more indicators are mainly concerned with the production rate and adsorption capacity of activated carbon, while the tar, volatile components, and other by-products produced in the activated carbon production process are less taken into consideration. However, the traditional wooden activated carbon production process causes a lot of pollution, and the intermediate products such as combustible gas and tar produced in the preparation process of activated carbon are not adequately treated, which seriously restricts the development of the activated carbon industry.4,5 Besides, in recent years, China’s domestic waste incineration disposal has increased rapidly.6,7 Dioxin is one of the main pollution compounds during waste incineration.8,9 The dioxins in waste incineration flue gas are generally adsorbed by activated carbon.10−12 Therefore, the demand for activated carbon is increasing. The low-cost and high-efficiency activated carbon production has a strong industrial prospect.
Therefore, there is a pressing need to develop an efficient and clean activated carbon production technology using waste biomass materials. Although a number of methods have been proposed and used for wooden activated carbon production, a method and theory coupled with high efficiency and low pollution are still not reported. Computational fluid dynamics (CFD) has been an effective tool for the design and optimization of the reactor in biomass utilization, such as gasification, pyrolysis, and combustion.13−16 Khodaei et al.17 conducted a combined CFD simulation of the thermal conversion of biochar formation and the combustion of volatiles in an industrial pyrolysis plant. The coupled multiphase modeling of biochar production and volatile combustion was conducted. However, the detailed reaction of tar compounds produced during pyrolysis was not included. However, there is seldom research on the rotary carbonizing furnace optimization by the CFD method. Zhao and Chen18 used EDEM and CFD to investigate the moving and mixing of char particles in the rotary furnace. The effect of char sharp on the particle moving was simulated and compared. However, the detailed reactions during steam activation were not considered. Ngamsidhiphongsa et al.19 investigated gasification in an Imbert gasifier including tar conversion using the CFD method. The global kinetic mechanism for tar combustion was coupled in the model. However, the tar conversion was influenced by the heterogeneous reaction of char, and the char activation was not considered. Until now, there are still very few studies on char production and by-product utilization synergistically. Using the CFD method for design and optimization of the furnace is rarely reported.
In this work, four typical kinds of biomass waste received from China were used as the raw materials for activated carbon production. A two-step method, namely, carbonization coupled with steam activation, was used. The by-products, especially tar compounds, were analyzed. The CFD method was used to study the utilization of the carbonization by-product. In the end, an environmentally friendly process for producing activated carbon from biomass waste is proposed.
2. Experiment Section
2.1. Materials
Four kinds of raw materials (pinewood, plywood, coconut shell, and corn straw) were used for carbonization and further for preparation of activated carbon samples. The coconut shell was produced in Hainan Province. Pinewood, plywood, and corn straw wastes were produced in Anhui Province. Afterward, the raw materials were crushed into 1–5 cm size and then pyrolyzed in a tubular furnace reactor. The ultimate analysis of the four samples is shown in Table 1.
Table 1. Ultimate Analysis of the Four Samples.
| ultimate
analysis (%) |
|||||||
|---|---|---|---|---|---|---|---|
| samplea | C | H | N | S | Ob | ash | moisture |
| pinewood | 43.52 | 5.94 | 1.72 | 0.12 | 37.52 | 2.18 | 8.80 |
| plywood | 40.85 | 5.15 | 5.20 | 0.57 | 35.15 | 5.65 | 7.63 |
| coconut shell | 49.58 | 5.91 | 0.45 | 0.72 | 30.71 | 0.55 | 12.08 |
| corn straw | 35.77 | 4.78 | 1.73 | 0.24 | 26.61 | 13.54 | 17.33 |
As received basis.
Calculated by minusing.
Before thermogravimetric experiments, the biomass samples were ground into powder with diameters of 100–150 μm. The samples were kept in a drying oven at 40 °C for 24 h before experiments.
The ash content has a great influence on the quality of activated carbon, and a high ash content can easily block the internal pores of activated carbon, so the high ash content is not conducive to the production of activated carbon. It can be seen from the ultimate analysis results that the ash content of coconut shell raw materials is the lowest, about 0.55%, and the ash content of wood chips is about 2.18%. These two raw materials have low ash contents and are suitable to be used as raw materials for the preparation of activated carbon. At present, wood chips, coconut shells, fruit shells, and other raw materials are also used in the production and preparation of wooden activated carbon in the market. Due to the binder and paint, the ash content of plywood raw materials is slightly higher than that of wood chips, which is about 5.65%. Therefore, the quality of plywood activated carbon may be slightly lower than that of pinewood chip activated carbon. Corn straw has the highest ash content of 13.54%, which was much higher than the other three raw materials. Therefore, corn straw is generally not suitable for the preparation of activated carbon. The other three raw materials were further compared by carbonization and activation experiments.
2.2. Experimental Apparatus
A TA Q5000 thermobalance coupled with a Bruker Vertex 70 Fourier transform infrared spectrometer instrument (FTIR) was used to investigate the pyrolysis behaviors of four raw materials. The biomass samples were heated by programmed temperature controlling at a heating rate of 30 K/min from ambient temperature to 800 °C under a N2 atmosphere at a steady flow rate of 50 mL/min. The balance protect gas was nitrogen with a flow rate of 20 mL/min. The amount of biomass sample was weighed to be 20 ± 0.1 mg. The volatiles released in the thermobalance were swept to the FTIR detector by the carrier gas. The TA and FTIR instruments were connected by a Teflon tube with a diameter of 3 mm, which was warmed at 180 °C by electric heating insulation to avoid the condensation of volatiles along the furnace tube.
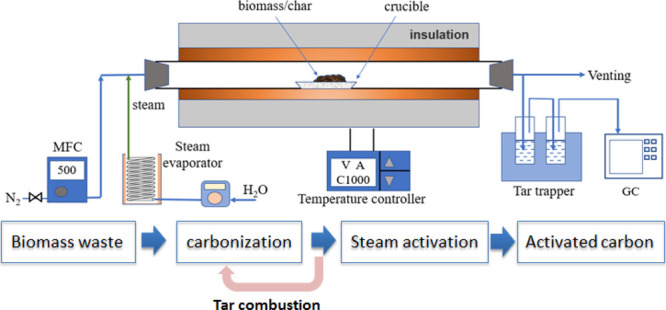
The carbonization and steam activation experiments were conducted in a laboratory-scale tubular furnace reactor as shown in Figure 1. The tubular furnace reactor was made of quartz glass, with a diameter of 80 mm and length of 1000 mm. The constant temperature zone in the middle part of the reactor is about 300 mm. The insulating layer thickness is about 150 mm. A PID electric heating system was used for temperature control of the furnace. In order to obtain the optimized conditions, the carbonization temperature was controlled at 400–600 °C and the activation temperatures were chosen at 700–900 °C. During the carbonation process, the biomass samples (around 5 g) were spread in a ceramic crucible, which was put in the middle part of the reactor. Then the reactor was heated to the target temperature at a heating rate of 10 K/min. The sweeping gas was nitrogen, and the flow rate was controlled by a mass flow rate at 400 mL/min. The samples were kept at the target temperature for 30 min and then pulled to the end location of the quartz tube to be cooled to temperature lower than 100 °C, which were biochar samples. The biochar samples were collected in a dry oven at 40 °C and used for analysis and further steam activation experiments. The tar compounds contained in the pyrolysis gas were trapped by isopropanol solvent, and the pyrolysis gas was then analyzed by gas chromatography.
Figure 1.

Laboratory-scale tubular furnace reactor used for carbonization and activation.
During the activation process, the furnace was first heated to the target activation temperature and then the biochar samples (around 3 g) were put into the middle part of the furnace. The water flow rate was controlled by a peristaltic pump, and then the water was heated by a steam evaporator. The steam was swept with nitrogen into the furnace to react with biochar. The nitrogen flow rate was controlled at 200 mL/min. When the activation end time was reached, the peristaltic pump was shut down and the samples were pulled to the end location of the furnace to be cooled down under a nitrogen atmosphere, which were the activated carbon samples.
2.3. Analysis Methods
The biochar and activated carbon samples were weighed after cooling, and the yields of the biochar and activated carbon samples were calculated. The iodine adsorption value, methylene blue adsorption value, and ash content of activated char were determined according to the method of GB/T 12496.4-1999. The specific surface area and pore distribution of activated char were measured by the gas adsorption (N2) method.20
The tar compound analysis was conducted on a Trace DSQII type GC instrument coupled with a mass spectrometry system. The chromatographic column was a DB-WAX polarity column, with a size specification of 30 m × 0.25 mm × 0.25 mm. When testing the tar samples, the oven temperature was initially controlled at 45 °C and heated to 250 °C at a speed of 10 °C/min and then kept at 250 °C for 25 min.
3. Results and Discussion
3.1. TG-FTIR Results of Biomass Carbonization
It can be seen that the coconut shell starts carbonization at about 250 °C, and carbonization was completed at about 500 °C (Figure 2).21 In terms of the heating rate of 10 °C/min, the carbonization process only needs 20–30 min under sufficient heating conditions. In the actual carbonization furnace, the carbonization time may need to be extended due to the restriction of the heat transfer process. At 500 °C, the yield of the carbonized material was 28.9%.
Figure 2.

Thermogravimetric characteristics of the four biomass samples: (a) TG curves; (b) DTG curves.
The pinewood was initially pyrolyzed at about 250 °C and completely carbonized at about 500 °C. The yield of carbonized biochar was about 25%, slightly lower than that of the coconut shell. Therefore, for pinewood, the carbonization process is basically similar to that of coconut shells.
The pyrolysis process of plywood was similar to that of pinewood, and the main carbonization temperature range was 250–500 °C. The biochar yield was about 31.8% at 500 °C, which was higher than those of the coconut shell and pinewood. This may be due to its high ash content.
With regard to corn straw, the main temperature range of pyrolysis and carbonization was 220–450 °C, which was slightly lower than those of the other three wooden materials. The yield of the carbonized material was about 39.1%, which was attributed to the highest ash content as referred to the ultimate analysis results.
Based on the above analysis, the ash content of corn straw is the highest, and the ash content of carbonized materials can reach 13.54/39.1% = 36.3% (assuming that all ash was retained in biochar). Therefore, the high ash content may affect the pore formation process and the quality of activated carbon during the activation process. However, Ding et al.22 found that the Na2CO3 catalyst had a promotion effect on the pore structure development of coal char, but excessive catalyst addition would block the pore structure. A similar phenomenon was also shown in Lahijani et al.’s work.23 The ash contents of the carbonized materials of the coconut shell and pinewood are much lower, which is more suitable for subsequent activation. The ash content of plywood is between those of pinewood and corn straw, which may have a certain influence on the quality of activated carbon. Further comparative verification is needed in subsequent activation experiments.
In order to analyze the volatile release properties during carbonization, a set of typical 3D plots of IR spectra for different biomass pyrolysis volatiles are shown in Figure 3.
Figure 3.

3D FTIR absorbance spectra of gaseous products during the four biomass samples’ pyrolysis.
The IR spectra kept tracking of the release volatiles from 40 to 800 °C. From Figure 3, it can be observed that gases (CO2, CO, CH4, CxHy, H2O) and some organic volatile compounds (such as acids, aldehydes, alcohols, and ethers) were identified. The TGA and DTG curves discussed above have just indicated the volatile release properties by weight. The 3D IR absorbance maps gave intuitional impression of the gas and volatile organic compound release properties. In order to reveal the volatile release qualitatively and quantitatively, the IR spectrum of the peak absorbance location at the main release stage was picked to investigate the carbonization process. The main peak absorbance curves of the four materials’ pyrolysis are shown in Figure 4.
Figure 4.

FTIR spectra of the main volatiles released during the four materials’ pyrolysis at the peak stages.
It can be seen that during the carbonization process, there are quite gaseous species and organic compounds released. CH4, CO, CO2, and hydrocarbons are the main detected gaseous species.21,24,25 Hydrogen is a nonpolar molecule and therefore is not shown in the infrared spectrum. It can be indicated that the CH4 and CmHn yields of pinewood and plywood are higher than those of the coconut shell and corn straw. The peak heights of the C=O bond and C–O for the coconut shell are the highest, which indicates that the aldehyde, acid, and alcohol yields of the coconut shell are higher than those of the other three materials. Corn straw releases the most CO and the least amount of organic compounds. This may be attributed to the catalytic effect of the ash compounds for the cracking of organic tar compounds. Wei et al.26 found that the ash additive has an effect on the coal pyrolysis, which benefited the char reactivity and decreased the order degree of the coal char carbon structure. The tar and gaseous products also were changed. Most of the research demonstrated that alkaline and alkaline earth metal (AAEM) catalysts that remained in ash were conducive to inhibiting the graphitization of char and enhancing the quantity of the amorphous carbon structure in char.23 The AAEMs also have a significant effect on tar cracking and reforming to form small gaseous compounds, such as H2 and CO.
3.2. Results of Biomass Carbonization in the Tubular Furnace Reactor
Next, the carbonization experiments of pinewood, plywood, and coconut shell were conducted in the tubular furnace reactor. Different carbonization conditions (temperature and residence time) were taken into consideration. The carbonization results of pinewood are summarized in Table 2.
Table 2. Carbonization Results of Pinewood under Different Conditionsa.
| temperature (°C) | time (min) | raw material (g) | char mass yield (g) | char yield (wt %) |
|---|---|---|---|---|
| 400 | 60 | 10.06 | 3.02 | 30.2 |
| 500 | 60 | 10.61 | 2.72 | 25.6 |
| 600 | 60 | 10.10 | 2.60 | 25.7 |
| 500 | 30 | 10.08 | 2.64 | 26.4 |
| 500 | 90 | 10.02 | 2.57 | 25.6 |
Carbonization conditions: heating rate = 10 °C/min, N2 flow rate = 0.5 L/min.
It can be seen that when the temperature is too low (below 400 °C), the pinewood chips are not fully carbonized. When the pyrolysis temperature reaches 500 °C, the wood chips are basically carbonized completely, which is consistent with the results of the thermogravimetric experiments above. The char yield is almost unchanged as the carbonization temperature continues to rise. Comparing the carbonization times of 30, 60, and 90 min, it can be found that the char yield is almost unchanged after the carbonization time exceeds 30 min. Therefore, the following conclusions can be drawn: The carbonization of wood chips can be fully achieved by using a heating rate of 10 °C/min, final temperature of 500 °C, and carbonization time of 30 min.
Similarly, the carbonization results of plywood are summarized in Table 3.
Table 3. Carbonization Results of Plywood under Different Conditionsa.
| temperature (°C) | time (min) | raw material (g) | char mass yield (g) | char yield (%) |
|---|---|---|---|---|
| 600 | 60 | 13.11 | 3.215 | 24.52 |
| 500 | 60 | 10.15 | 2.536 | 24.99 |
| 400 | 60 | 10.12 | 2.844 | 28.10 |
| 500 | 90 | 10.87 | 2.703 | 24.87 |
| 500 | 30 | 10.26 | 2.640 | 25.73 |
Carbonization conditions: heating rate = 10 °C/min, N2 flow rate = 0.5 L/min.
It can be seen that the pattern of plywood carbonization is similar to that of pinewood. When the carbonization temperature reaches 500 °C, the plywood samples are completely carbonized. At this temperature, the carbonization residence time is about 30 min, and extending the carbonization time has no obvious influence on the char yield. The carbonization yield is 25.73% under the conditions of 500 °C and 30 min residence time, which is also similar to pinewood.
The effects of different carbonization final temperatures and residence times at 400, 500, and 600 °C on the yield of coconut shell carbonization are compared in Table 4. It could be seen that the coconut shell could not be fully carbonized at 400 °C, and there are still 15% volatiles retained in the coconut shell char for 60 min at 400 °C. When the temperature reaches 500 °C or above, the char yield is stable at about 30% and does not change much with the residence time. It can be judged that the coconut shell particles can be fully carbonized at 500 °C for 30 min. At the same time, it can be seen that in the thermogravimetric test, the char yield of coconut shell raw materials is about 28.9% at 500 °C, while that of the experiment in a fixed bed reactor is about 30%, slightly higher than that of the thermogravimetric test. This is due to the low use of TGA raw materials and the fine grain size, which benefit the release of volatiles. So, the carbon rate is lower in the TGA experiment.
Table 4. Carbonization Results of the Coconut Shell under Different Conditionsa.
| temperature (°C) | time (min) | raw material (g) | char mass yield (g) | char yield (%) |
|---|---|---|---|---|
| 500 | 30 | 15.957 | 4.848 | 30.38 |
| 600 | 60 | 13.09 | 3.813 | 29.13 |
| 600 | 30 | 20.56 | 6.248 | 30.39 |
| 400 | 60 | 20.094 | 6.996 | 34.82 |
| 400 | 30 | 19.063 | 6.752 | 35.42 |
Carbonization conditions: heating rate = 10 °C/min, N2 flow rate = 0.5 L/min.
In general, the reasonable working conditions used in the carbonization of coconut shell particles are as follows: the final temperature of carbonization is 500 °C, the heating speed is 10 °C/min, the carbonization time is 30 min, and the yield of char is around 30%.
Noncondensable organic compounds, namely, tar compounds, are important by-products during biomass carbonization. The treatment and utilization of tar are critical to the production of activated carbon. The GC/MS results of the tar samples for pinewood, plywood, and coconut shell are shown in Figure 5.
Figure 5.

GC/MS peak spectrograms of tar: (a) pinewood tar; (b) plywood tar; (c) coconut shell tar.
It can be indicated from Figure 5 that the molecule weights of tar compounds are distributed over a wide range. Furan and its derivatives, such as furfural, are the main representative pyrolysis products of cellulose and hemicellulose.27 Phenol and its derivatives are the main debris pyrolysis products generated by lignin,28,29 which account for the largest amount of detected tar compounds. In order to analyze the amounts of individual tar compounds, the peak areas of the 12 main tar compounds were calculated and the relative concentration values of the three materials are summarized in Table 5.
Table 5. GC/MS Results of Pinewood Tar Compounds.
| relative
concentration (%) |
|||||
|---|---|---|---|---|---|
| R.T. (min) | compound | M.W. | pinewood | plywood | coconut shell |
| 2.48 | furfural | 96 | 3.38 | 1.83 | 0.45 |
| 7.02 | phenol | 94 | 18.37 | 3.33 | 4.02 |
| 8.01 | 3-methyl-1,2-cyclopentanedione | 112 | 1.46 | 0.94 | 0.43 |
| 8.94 | 2-methoxyl-phenol | 124 | 4.8 | 2.44 | 2.07 |
| 10.76 | creosol | 138 | 1.56 | 1.12 | 1.46 |
| 11.43 | 2-isopropoxyphenol | 152 | 0.78 | 1.15 | 0.39 |
| 12.08 | 2-methoxy-4-ethylphenol | 152 | 2.35 | 1.37 | 1.53 |
| 13.26 | 2,6-dimethoxyphenol | 154 | 4.83 | 2.98 | 2.62 |
| 14.41 | 1,4-methoxy-3-(methoxymethyl)phenol | 168 | 2.47 | 2.2 | 2.13 |
| 15.38 | 3,4,5-trimethoxyl-toluene | 182 | 1.41 | 1.42 | 1.55 |
| 17.37 | 2,6-dimethoxy-4-(1E)-1-propen-1-y1-phenol | 194 | 1.24 | 1.27 | 1.37 |
| 18.15 | trans-sinapyl alcohol | 210 | 0.66 | 0.97 | 1.14 |
Furfural is a kind of pyrolysis product of cellulose and hemicellulose. The furfural concentration of pinewood tar is about 3.38%, which is the highest among the three samples. Phenol and its derivatives are important tar products in lignin pyrolysis. The relative concentration of phenol in pinewood tar is about 18.37%, which is much higher than those of plywood and coconut shell. Furfural and phenol and its derivatives are the main tar compounds during biomass carbonization. These organic compounds will cause serious problems if emitted directly into the environment. Besides, these organic compounds have similar properties to diesel, and the direct emissions will also produce a waste of energy.30 Therefore, using the by-products (tar and combustible gases) by combustion to produce heat is a clean and energy-saving method during activated carbon production.
3.3. CFD Modeling of the Combustion Room of the Rotary Carbonization Reactor
In order to use the carbonization by-product, a combustion room is designed for dealing with the volatiles (gaseous and tar compounds) to provide the heat for carbonization. The structure of the rotary carbonization furnace is shown in Figure 6.
Figure 6.
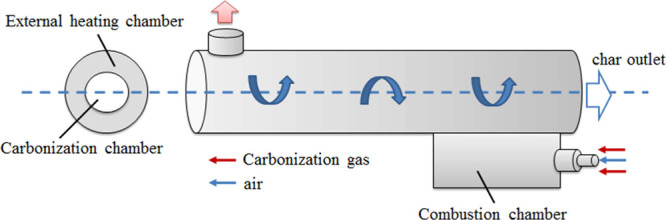
Structure of the rotary carbonization furnace.
The carbonization furnace adopts a sleeve type design. The biomass material moves in the inner cylinder, and the hot flue gas flows in the outer cylinder. The flue gas is produced by the combustion of part of the carbonization volatiles in the combustion chamber, which provides the heat needed by the drying and carbonization reactions in the inner cylinder. The detailed size of the furnace is as follows: The diameters of the carbonization chamber and external heating chamber are 400 and 700 mm, respectively. The length of the rotary furnace is 3000 mm. The length of the combustion chamber is 1200 mm. The diameter of the carbonization gas inlet is 16 mm, and the diameter of the air inlet is 10 mm.
In order to optimize the operation of the reactor, CFD modeling is used to simulate the combustion of volatiles. The kinetic reactions and parameters for the combustion process are adopted from Zhao et al.30 and Su et al.16 Phenol is chosen as the tar model compound. The conversion of tar and the formation of PAHs and soot are included in this model. Three kinds of working conditions are simulated and compared: (1) 10% volatiles used for combustion; (2) 20% volatiles used for combustion; (3) 30% volatiles used for combustion. The temperature distribution properties in the cross section are shown in Figure 7.
Figure 7.

Temperature distribution in the cross area of the rotary reactor: (a) 10% of the carbonization volatiles used for combustion; (b) 20% of the carbonization volatiles used for combustion; (c) 30% of the carbonization volatiles used for combustion.
It can be seen that with the increase of volatile used in the combustion chamber, the high temperature area increases, which will provide enough heat for the drying and carbonization of the raw material. However, too much heat will result in the overheating of biochar and is not conducive to the subsequent activation process. Besides, too much volatile will lead to the waste of energy and the formation of pollutants. To quantitatively analyze the effects of different amounts of volatile combustion, the temperature values and some pollution produced in the chamber are calculated and summarized in Table 6.
Table 6. Summary of the Combustion Room under Different Conditions.
| 10% volatile | 20% volatile | 30% volatile | |
|---|---|---|---|
| peak temperature | 1847 | 1840 | 1909 |
| average temperature | 1403 | 1403 | 1547 |
| outlet temperature | 1214 | 1327 | 1415 |
| phenol yield (wt %) | 9.02 × 10⁻⁴ | 2.33 × 10⁻¹² | 2.17 × 10⁻¹⁷ |
| soot yield (wt %) | 6.67 × 10⁻⁵ | 6.31 × 10⁻⁵ | 2.71 × 10⁻⁵ |
| CO yield (vol %) | 0.01082 | 0.00147 | 0.00725 |
It can be indicated that using 20% of the volatiles produced during carbonization could achieve the lowest pollution yield and maintain a high enough flue gas temperature for biomass carbonization. Phenol and soot could be almost removed, and the CO yield is the lowest in the three cases (0.00147 vol %). It is proven that using part of the carbonization volatiles for combustion to provide the heat needed by carbonization is effective and environmentally friendly.
3.4. Steam Activation of Char
The main factors affecting steam activation include activation temperature, activation time, and water vapor amount (steam/carbonized material ratio).It is through the multifactor analysis that the process test obtains the optimal activation conditions of different raw materials, which could be used to guide the design and operation of the activation furnace equipment. In this experiment, activation process conditions were designed for wooden raw materials, as discussed in Section 2.2. Because there are many factors, the orthogonal test combined with single factor analysis is adopted to optimize the test conditions and reduce the test load. According to the quality of activated carbon (iodine adsorption value, methylene blue adsorption value) and activated carbon yield, comprehensive analysis of activation conditions could benefit screening the better process parameters.
It can be found from Table 7 that, for pinewood, the activation temperature is crucial, and the activation temperature is too low or insufficient, and the activation temperature is too high, which will lead to overactivation, resulting in the decrease of yield and iodine value. When activated at 900 °C, the activated carbon yield was only 2.57%, and the iodine value was only 815 mg/g. Therefore, for wood chips, an activation temperature zone of 800 °C is more appropriate.
Table 7. Steam Activation Results of Pinewood under Different Conditions.
| temperature (°C) | time (min) | H2O flow (mL/min) | char feeding (g) | AC yield (g) | AC yield (wt %) | IVa (mg/g) | MBVb (mg/g) |
|---|---|---|---|---|---|---|---|
| 700 | 30 | 1 | 11.78 | 1.56 | 13.24 | 763 | 75 |
| 800 | 30 | 1 | 11.19 | 0.705 | 6.30 | 977 | 142.5 |
| 900 | 30 | 1 | 16.1 | 0.414 | 2.57 | 815 | 115 |
| 800 | 10 | 1 | 10.98 | 1.852 | 16.87 | 809 | 90 |
| 800 | 60 | 1 | 11.134 | 0.633 | 5.69 | 712 | 60 |
| 800 | 30 | 0.75 | 11.622 | 0.912 | 7.85 | 1023 | 150 |
| 800 | 30 | 0.5 | 10.17 | 1.123 | 11.04 | 959 | 142.5 |
| 800 | 45 | 0.5 | 11.52 | 1.052 | 9.13 | 1068 | 150 |
Iodine sorption value.
Methylene blue adsorption value.
By comparing the activation time and moderately increasing the activation time, a better activation effect can be obtained. Similarly, the activation time is too long, which will also cause the burning loss of carbon, resulting in the decrease of the carbon rate and iodine value. It can be seen that a good activation effect can be achieved after activation for about 30 min at 800 °C.
Steam flow is another key factor. With too little steam, the char surface contacts with insufficient steam and a pore-making reaction is difficult to form. When the steam amount is too large, gasification reaction that occurred in internal pores is too violent, which will cause excessive ablation. It can be seen that a steam flow rate of 0.5–0.75 mL/min can obtain the best activation effect.
In general, for pinewood, better activated carbon can be obtained by using steam at 800 °C, 30 min activation time, and 0.5 mL/min, with a yield of 11%, iodine value of 959 mg/g, and methylene blue value of 142 mg/g. It can completely meet the demand of flue gas purification, and the overall economy is good.
According to the carbonization experiment, it can be known that due to the binder, paint, and other components, the ash content of plywood is higher and is not conducive to the generation of activated carbon. The activation experiments showed that the quality of plywood activated carbon declined compared with pinewood (Table 8). A steam flow rate of 1 mL/min with 30 min activation time at 800 °C can obtain better activated carbon, with a yield of 13.16% and an iodine value of 819 mg/g, which can meet the needs of flue gas purification in the power plant.
Table 8. Steam Activation Results of Plywood under Different Conditions.
| temperature (°C) | time (min) | H2O flow (mL/min) | char feeding (g) | AC yield (g) | AC yield (wt %) | IVa (mg/g) | MBVb (mg/g) |
|---|---|---|---|---|---|---|---|
| 700 | 30 | 0.75 | 26.52 | 5.375 | 20.27 | 590 | 45 |
| 800 | 30 | 0.75 | 19.628 | 2.748 | 14.00 | 750 | 75 |
| 900 | 30 | 0.75 | 20.3 | 1.049 | 5.17 | 834 | 97.5 |
| 800 | 45 | 0.75 | 19.85 | 2.073 | 10.44 | 811 | 90 |
| 800 | 60 | 0.75 | 19.644 | 1.735 | 8.83 | 743 | 94 |
| 800 | 30 | 1 | 19.764 | 2.601 | 13.16 | 819 | 105 |
| 800 | 45 | 1 | 20.476 | 2.057 | 10.05 | 743 | 90 |
Iodine sorption value.
Methylene blue adsorption value.
The coconut shell, with high lignin content and low ash content, is an excellent raw material for activated carbon production. Similar to pinewood chips and plywood, the steam activation results of the coconut shell are shown in Table 9.
Table 9. Steam Activation Results of the Coconut Shell under Different Conditions.
| temperature (°C) | time (min) | H2O flow (mL/min) | char feeding (g) | AC yield (g) | AC yield (wt %) | IVa (mg/g) | MBVb (mg/g) |
|---|---|---|---|---|---|---|---|
| 700 | 30 | 1 | 20.093 | 5.301 | 26.38 | 678 | 45 |
| 800 | 30 | 1 | 21.129 | 4.48 | 21.20 | 926 | 60 |
| 900 | 30 | 1 | 20.743 | 1.041 | 5.02 | 1002 | 127.5 |
| 800 | 45 | 1 | 20.312 | 2.104 | 10.36 | 992 | 120 |
| 900 | 45 | 0.75 | 20.241 | 0.942 | 4.65 | 766 | 60 |
| 800 | 45 | 0.75 | 20.121 | 3.483 | 17.31 | 901 | 90 |
| 800 | 60 | 0.75 | 21.012 | 2.349 | 11.18 | 888 | 75 |
| 800 | 30 | 1.25 | 20.04 | 2.896 | 14.45 | 903 | 90 |
| 800 | 45 | 1 | 39.186 | 5.189 | 13.24 | 1101 | 135 |
| 800 | 60 | 1 | 39.701 | 3.627 | 9.14 | 1086 | 127.5 |
Iodine sorption value.
Methylene blue adsorption value.
By comparing the effects of temperature on coconut shell steam activation, it can be seen that the yield of coconut shell activated carbon reached 26.38% but the iodine value was only 678 mg/g when the activation time was 30 min and the steam flow was 1 mL/min at 700 °C. This indicated that water vapor activation could not be fully activated to make pores in coconut shell char at 700 °C. When the temperature was increased to 800 °C, the yield decreased to 21.2% and the iodine value increased rapidly to 926 mg/g. When the temperature continued to rise to 900 °C, the iodine value increased to 1002 mg/g and the yield rapidly decreased to 5.02%.
Taking the iodine value and yield of coconut shell activated carbon into consideration, an activation temperature of 800 °C is more ideal. However, the methylene blue adsorption value of coconut shell carbon was low under the conditions of 800 °C, activation for 30 min, and steam of 1 mL/min. This may be due to improper selection of the activation time or steam amount.
The activation time was changed to compare the effects of activation times of 30, 45, and 60 min on coconut shell char. At 45 min, the yield was 10.36%, the iodine value was 992 mg/g, and the methylene blue adsorption value was 120 mg/g. Proper extension of the activation time can improve the activation degree and methylene blue adsorption value. When the activation time was further increased to 60 min, it could be seen that both the yield and iodine value decreased, which may be due to the burning loss caused by overactivation.
The activation experiments use a small number of samples; therefore, the temperature, steam and material mixing are more uniform. However, in engineering practice, char size is larger and there are obvious problems such as heat and mass transfer and mixing. To further compare the impact of raw material size on the quality of activated carbon, the initial amount of raw materials was increased. By doubling the amount of raw materials, it can be seen that the optimal condition can be reached under the conditions of 800 °C, 45 min activation time, and 1 mL/min steam flow rate. The yield of coconut shell activated carbon is 13.2%, the iodine value is 1101 mg/g, and the methylene blue adsorption value is 135 mg/g. It can be inferred that in the actual industrial rotary activated furnace, due to the existence of the furnace body rotation, the mixing of materials and water vapor more fully, through reasonable design, can obtain better coconut shell activated carbon.
The steam activation of char is a typical gasification process. The global reactions during char–steam interaction could be summarized below23
| 1 |
| 2 |
In reaction 1, Cf refers to the char active surface, which could combine with a steam molecule to form a C(O) complex and release H2. The C(O) complex will further decompose to form a new active site Cf and release CO. In this way, the surface carbon atoms are consumed and pores are formed. With a moderate steam supply and reaction temperature, parts of carbon atoms are gasified and the remaining carbon atoms form the activated carbon. In order to obtain the largest porosity and activated carbon yield, reasonable activation temperature, steam amount, and reaction time should be provided.
3.5. Analysis of the Specific Surface Area and Pore Structure of Activated Carbon
According to the analysis standards provided by the International Society for Pure and Applied Chemistry (IUPAC), it is generally considered that a pore diameter less than 2 nm is a micropore; 2–50 nm is a mesopore, and greater than 50 nm is a macropore.31
Different pore sizes play different roles in the adsorption process. Macropores account for a small proportion in the specific surface area and are often used as adsorption channels in activated carbon. A mesopore is a channel for adsorption of molecules, and capillary condensation occurs under certain pressure, which plays an important role in adsorption of macromolecules. The adsorption effect of micropores is the largest, which plays a dominant role in the adsorption amount of activated carbon, and determines the adsorption capacity of activated carbon to a large extent.12
The pore distribution characteristics of activated carbons prepared from the three wooden raw materials (pinewood, plywood, and coconut shells) were analyzed using the general N2 gas adsorption method. The pore distribution characteristics of the three activated carbons with pore size change are shown in Figure 8.
Figure 8.

Pore diameter distribution profiles of the three activated carbon samples: (a) pinewood AC; (b) plywood AC; (c) coconut shell AC.
The pore distribution of pinewood activated carbon is relatively wide, ranging from 2 to 50 nm, and the specific surface area is the largest within the range of 2–5 nm. From the above analysis, it can be seen that this part of the pore structure plays a major role in the adsorption process of dioxins. At the same time, mesopores and macropores are also gently distributed, and the pores larger than 5 nm are basically linear, providing a channel for dioxin molecules to transmit to the internal adsorption point.32,33 It can be concluded that the wood chip activated carbon is an ideal material for dioxin adsorption.34
The pore structure distribution of the plywood is similar to that of pinewood, and the main pore structure ranges from 2 to 9 nm, covering the effective dioxin adsorption range (2–5 nm). Theoretically, activated carbon has good adsorption of dioxins. Compared with the target, there were more pores and fewer micropores, and the adsorption capacity of dioxins was probably slightly weaker than that of pinewood.35
It can be seen that the pore distribution of coconut shells is significantly different from those of pinewood and plywood. There were fewer pores larger than 5 nm, and the structure of 2–5 nm medium micropores was also less than that of pinewood. It is mainly distributed within the range of less than 2 nm on the surface. Therefore, it can be indicated that coconut shell activated carbon has larger surface area, higher iodine value, but is not a suitable adsorbent of dioxins. The main reasons are as follows: (1) the coconut shell activated carbon is given priority to pores with diameters less than 2 nm, which is close to or even smaller than the dioxin molecules and cannot effectively adsorb dioxins; (2) there are few mesoporous and macroporous structures, which cannot provide enough dioxins to enter the micropores for adsorption.
3.6. Adsorption and Removal of Dioxin by Activated Carbon
Dioxins are the product of oxygen combining two benzene rings. In terms of molecular weight, they are 184–460 g/mol organic halogen compounds. Taking 2,3,7,8-PCDD as an example, the size of a molecule can be estimated to be 1.8 nm in maximum length, 1.0 nm in width, and 0.4 nm in minimum thickness.36 When 1 ng-TEQ/Nm3 dioxin-like compounds are present in the gas to be purified, it can be considered that the number of dioxin-like compounds in 1 Nm3 is about 2–200 trillion. In actual incineration flue gas, most of these dioxin molecules are attached to particles such as dust, and about 40% of the dioxins are in molecular form suspended in the gas.12 As adsorbents of dioxin-like compounds, they must have the ability to attract and adsorb dioxin-like compounds. In order to introduce molecules of dioxin-like compounds into the pores of the adsorbent (activated carbon), the pore inlet diameter is considered to be an order of magnitude larger than the maximum diameter of the dioxin-like compound molecules.37 In order to induce dioxin-like compounds to the adsorption fixed position in the deeper part of the pore through the molecular motion of dioxin-like compounds, the cone-shaped shrinking pores are ideal. Meanwhile, in order to adsorb and fix the attracted dioxin-like compounds, a large number of pores with a pore diameter of 2.0–5.0 nm are required.
Based on the results in Section 3.4, the pinewood and plywood activated carbon samples have abundant pores with diameters ranging from 2.0 to 5.0 nm, which indicate that these two kinds of materials are very suitable for activated carbon production via a two-step process (carbonization coupled with steam activation).
4. Conclusions
A two-step process of carbonization coupled with steam activation was proposed for wooden activated carbon production from four kinds of biomass waste materials. The volatile release properties and the carbonization and steam activation conditions were investigated. The optimized parameters were obtained for activated carbon production from wastes. The main conclusions are as follows.
-
(1)
The TG-FTIR results show that the carbonization process started at around 250 °C and finished at 500 °C for the coconut shell, pinewood, and plywood. The carbonization temperature of corn straw was lower than those of the other three samples, which was attributed the higher concentration of ash content. FTIR results for the volatile compounds during carbonization show that CH4, CO, CO2, and hydrocarbons are the main detected gaseous species. The CH4 and CmHn yields of pinewood and plywood are higher than those of the coconut shell and corn straw.
-
(2)
The carbonization results on the tubular furnace reactor show that furfural and phenol and its derivatives are the main tar compounds in waste carbonization. Carbonization experiments show that a temperature of 500 °C and residence time of 30 min are the optimized parameters for the three biomass wastes. The char yields are 26.4, 25.73, and 30.38% for pinewood, plywood, and coconut shell, respectively.
-
(3)
CFD modeling has proven that using 20% of the volatiles for direct combustion could achieve lowest pollution and provide heat for carbonization of biomass waste. The tar and other pollutions could be almost removed by direct combustion.
-
(4)
The steam activation results show that an activation temperature of 800 °C, activation time of 30 min, and steam/char mass ratio of 1.5 are suitable for all three biomass samples. The pore structure analysis indicate that the activated carbon samples derived from pinewood and plywood have abundant pores with average diameters ranging from 2 to 5 nm, which is suitable for dioxin removal. The coconut shell activated carbon is given priority to micropores with diameters under 2 nm, which is not suitable for large molecular pollutant removal, such as dioxin.
Acknowledgments
This work was sponsored in part by the Talent Scientific Research Fund of LSHU (No. 2016XJJ-049).
The authors declare no competing financial interest.
References
- Heidenreich S.; Foscolo P. U. New concepts in biomass gasification. Prog. Energy Combust. Sci. 2015, 46, 72–95. 10.1016/j.pecs.2014.06.002. [DOI] [Google Scholar]
- Köseoǧlu E.; Akmil-Bašar C. Preparation, structural evaluation and adsorptive properties of activated carbon from agricultural waste biomass. Adv. Powder Technol. 2015, 26, 811–818. 10.1016/j.apt.2015.02.006. [DOI] [Google Scholar]
- Kim Y. H. Process simulation of activated carbon production using a rotary kiln. Korean J. Chem. Eng. 2011, 28, 27–31. 10.1007/s11814-010-0367-4. [DOI] [Google Scholar]
- Derlet R. W.; Albertson T. E. Activated charcoal--past, present and future. West. J. Med. 1986, 145, 493–496. [PMC free article] [PubMed] [Google Scholar]
- Xu D.; Yang L.; Ding K.; Zhang Y.; Gao W.; Huang Y.; Sun H.; Hu X.; Syed-Hassan S. S. A.; Zhang S.; Zhang H. Mini-Review on Char Catalysts for Tar Reforming during Biomass Gasification: The Importance of Char Structure. Energy Fuels 2020, 34, 1219–1229. 10.1021/acs.energyfuels.9b03725. [DOI] [Google Scholar]
- Jiang X.; Li Y.; Yan J. Hazardous waste incineration in a rotary kiln: a review. Waste Disposal Sustainable Energy 2019, 1, 3–37. 10.1007/s42768-019-00001-3. [DOI] [Google Scholar]
- Tao H.; He P.; Zhang Y.; Sun W. Performance evaluation of circulating fluidized bed incineration of municipal solid waste by multivariate outlier detection in China. Front. Environ. Sci. Eng. 2017, 11, 4. 10.1007/s11783-017-0945-3. [DOI] [Google Scholar]
- Buekens A.; Cen K. Waste incineration, PVC, and dioxins. J. Mater. Cycles Waste Manage. 2011, 13, 190–197. 10.1007/s10163-011-0018-9. [DOI] [Google Scholar]
- Zhang Y.; Ma Z.; Fang Z.; Qian Y.; Zhong P.; Yan J. Review of harmless treatment of municipal solid waste incineration fly ash. Waste Disposal Sustainable Energy 2020, 2, 1–25. 10.1007/s42768-020-00033-0. [DOI] [Google Scholar]
- Kulkarni P. S.; Crespo J. G.; Afonso C. A. M. Dioxins sources and current remediation technologies — A review. Environ. Int. 2008, 34, 139–153. 10.1016/j.envint.2007.07.009. [DOI] [PubMed] [Google Scholar]
- Mukherjee A.; Debnath B.; Ghosh S. K. A Review on Technologies of Removal of Dioxins and Furans from Incinerator Flue Gas. Procedia Environ. Sci. 2016, 35, 528–540. 10.1016/j.proenv.2016.07.037. [DOI] [Google Scholar]
- Cui Y.-Y.; Yang G.-H.; Xiao G.-H.; Zhou J.-H.; Ding G.-Z.; Pan X.-J. Adsorption of Dioxin by Bag Filter + Powdered Activated Carbon. Water, Air, Soil Pollut. 2017, 228, 160. 10.1007/s11270-017-3337-1. [DOI] [Google Scholar]
- Liu D.; Van Wachem B. Comprehensive assessment of the accuracy of CFD-DEM simulations of bubbling fluidized beds. Powder Technol. 2019, 343, 145–158. 10.1016/j.powtec.2018.11.025. [DOI] [Google Scholar]
- Qi T.; Lei T.; Yan B.; Chen G.; Li Z.; Fatehi H.; Wang Z.; Bai X.-S. Biomass steam gasification in bubbling fluidized bed for higher-H2 syngas: CFD simulation with coarse grain model. Int. J. Hydrogen Energy 2019, 44, 6448–6460. 10.1016/j.ijhydene.2019.01.146. [DOI] [Google Scholar]
- Jurtz N.; Kraume M.; Wehinger G. D. Advances in fixed-bed reactor modeling using particle-resolved computational fluid dynamics (CFD). Rev. Chem. Eng. 2019, 35, 139–190. 10.1515/revce-2017-0059. [DOI] [Google Scholar]
- Su Y.; Luo Y.; Chen Y.; Wu W.; Zhang Y. Experimental and numerical investigation of tar destruction under partial oxidation environment. Fuel Process. Technol. 2011, 92, 1513–1524. 10.1016/j.fuproc.2011.03.013. [DOI] [Google Scholar]
- Khodaei H.; Gonzalez L.; Chapela S.; Porteiro J.; Nikrityuk P.; Olson C. CFD-based coupled multiphase modeling of biochar production using a large-scale pyrolysis plant. Energy 2021, 119325. 10.1016/j.energy.2020.119325. [DOI] [Google Scholar]
- Zhao S.; Chen L. Utilization of biomass waste for activated carbon production by steam gasification in a rotary reactor: experimental and theoretical approach. Biomass Convers. Biorefin. 2020, 1. 10.1007/s13399-020-00921-9. [DOI] [Google Scholar]
- Ngamsidhiphongsa N.; Ponpesh P.; Shotipruk A.; Arpornwichanop A. Analysis of the Imbert downdraft gasifier using a species-transport CFD model including tar-cracking reactions. Energy Convers. Manage. 2020, 213, 112808. 10.1016/j.enconman.2020.112808. [DOI] [Google Scholar]
- Zhao S.; Zhang Y.; Su Y. Experimental investigation of rice straw oxidative pyrolysis process in a hot-rod reactor. J. Anal. Appl. Pyrolysis 2019, 142, 104646. 10.1016/j.jaap.2019.104646. [DOI] [Google Scholar]
- Yang H.; Yan R.; Chen H.; Lee D. H.; Zheng C. Characteristics of hemicellulose, cellulose and lignin pyrolysis. Fuel 2007, 86, 1781–1788. 10.1016/j.fuel.2006.12.013. [DOI] [Google Scholar]
- Ding L.; Zhou Z.; Guo Q.; Huo W.; Yu G. Catalytic effects of Na2CO3 additive on coal pyrolysis and gasification. Fuel 2015, 142, 134–144. 10.1016/j.fuel.2014.11.010. [DOI] [Google Scholar]
- Lahijani P.; Zainal Z. A.; Mohamed A. R.; Mohammadi M. CO2 gasification reactivity of biomass char: catalytic influence of alkali, alkaline earth and transition metal salts. Bioresour. Technol. 2013, 144, 288–295. 10.1016/j.biortech.2013.06.059. [DOI] [PubMed] [Google Scholar]
- Yang H.; Yan R.; Chen H.; Zheng C.; Lee D. H.; Liang D. T. In-Depth Investigation of Biomass Pyrolysis Based on Three Major Components: Hemicellulose, Cellulose and Lignin. Energy Fuels 2006, 20, 388–393. 10.1021/ef0580117. [DOI] [Google Scholar]
- Yu J.; Paterson N.; Blamey J.; Millan M. Cellulose, xylan and lignin interactions during pyrolysis of lignocellulosic biomass. Fuel 2017, 191, 140–149. 10.1016/j.fuel.2016.11.057. [DOI] [Google Scholar]
- Wei J.; Guo Q.; Ding L.; Gong Y.; Yu J.; Yu G. Understanding the effect of different biomass ash additions on pyrolysis product distribution, char physicochemical characteristics, and char gasification reactivity of bituminous coal. Energy Fuels 2019, 33, 3068–3076. 10.1021/acs.energyfuels.9b00064. [DOI] [Google Scholar]
- Bradbury A. G. W.; Sakai Y.; Shafizadeh F. A kinetic model for pyrolysis of cellulose. J. Appl. Polym. Sci. 1979, 23, 3271–3280. 10.1002/app.1979.070231112. [DOI] [Google Scholar]
- Ales H.; Igor S.; Alexandra S.; Michal J.; Peter S. Lignin pyrolysis (Book of Abstract), CEI_JRC European Workshop on Advanced Biofuels, Biorefinery and Bio-economy: A Challenge for Central and East European Countries, Bratislava, Slovakia, Mar 25–27, 2015; pp. 42.
- Zhao S.; Luo Y.; Su Y.; Zhang Y.; Long Y. Experimental Investigation of the Oxidative Pyrolysis Mechanism of Pinewood on a Fixed-Bed Reactor. Energy Fuels 2014, 28, 5049–5056. 10.1021/ef500612q. [DOI] [Google Scholar]
- Zhao S.; Bi X.; Pan X.; Su Y.; Wu W. The optimization of in-situ tar reduction and syngas production on a 60-kW three-staged biomass gasification system: theoretical and practical approach. Biomass Convers. Biorefin. 2019, 5, 1. 10.1007/s13399-019-00536-9. [DOI] [Google Scholar]
- Kanellopoulos N.Nanoporous Materials: Advanced Techniques for Characterization, Modeling, and Processing; 1st ed.; Kanellopoulos N., Ed.; Crc Press: Boca Raton, 2011; pp. 1–544 . [Google Scholar]
- Mori K.; Matsui H.; Yamaguchi N.; Nakagawa Y. Multi-component behavior of fixed-bed adsorption of dioxins by activated carbon fiber. Chemosphere 2005, 61, 941–946. 10.1016/j.chemosphere.2005.03.035. [DOI] [PubMed] [Google Scholar]
- Ji S. S.; Ren Y.; Buekens A.; Chen T.; Lu S. Y.; Cen K. F.; Li X. D. Treating PCDD/Fs by combined catalysis and activated carbon adsorption. Chemosphere 2014, 102, 31–36. 10.1016/j.chemosphere.2013.12.008. [DOI] [PubMed] [Google Scholar]
- Bell J. G.; Zhao X.; Uygur Y.; Thomas K. M. Adsorption of Chloroaromatic Models for Dioxins on Porous Carbons: The Influence of Adsorbate Structure and Surface Functional Groups on Surface Interactions and Adsorption Kinetics. J. Phys. Chem. C 2011, 115, 2776–2789. 10.1021/jp1099893. [DOI] [Google Scholar]
- Atkinson J. D.; Hung P. C.; Zhang Z.; Chang M. B.; Yan Z.; Rood M. J. Adsorption and destruction of PCDD/Fs using surface-functionalized activated carbons. Chemosphere 2015, 118, 136–142. 10.1016/j.chemosphere.2014.07.055. [DOI] [PubMed] [Google Scholar]
- Zhou X.-J.; Buekens A.; Li X.-D.; Ni M.-J.; Cen K.-F. Adsorption of polychlorinated dibenzo-p-dioxins/dibenzofurans on activated carbon from hexane. Chemosphere 2016, 144, 1264–1269. 10.1016/j.chemosphere.2015.10.003. [DOI] [PubMed] [Google Scholar]
- Zhou X.; Li X.; Xu S.; Zhao X.; Ni M.; Cen K. Comparison of adsorption behavior of PCDD/Fs on carbon nanotubes and activated carbons in a bench-scale dioxin generating system. Environ. Sci. Pollut. Res. 2015, 22, 10463–10470. 10.1007/s11356-015-4180-9. [DOI] [PubMed] [Google Scholar]