

Abstract

Oil shale is a promising unconventional resource and in situ upgrading technology has been a practical approach for enhancing oil and gas recovery. Mineral-based clin/SBA-15 has been prepared and subsequently functionalized to get SO3H-SBA-15 catalysts. Compared with the noncatalytic conversion of oil shale under subcritical water, sulfonic acid grafted catalysts have played a predominant role in enhancing the oil yield by 3–16% and improving oil qualities. The O/C atomic ratio was declined to 0.10–0.11, while the hydrocarbon yield was sharply increased to 47–60% from 34%. The energy recovery has been elevated to 75–82%, and the produced oil had a heating value of 35–37 MJ/kg. Compared with that without catalyst, the energy recovery rate is 34.55%, and the heating value is 23.61 MJ/kg. The overall oil yield showed a linear trend with respect to the medium and strong acid amounts on SO3H-SBA-15 in the aqueous conversion of oil shale. It was indicated that the SO3H– group assisted in the depolymerization via the C–C and C–O bond breaking. Upon the addition of SO3H-SBA-15, the activation energies of the oil shale catalytic conversation are decreased dramatically to 78 kJ/mol. It provided a practical approach for the in situ upgrading of oil shale under milder reaction conditions.
1. Introduction
Oil shale is regarded as one of the maximum energy resources in the world, and shale oil reserves converted from oil shale is 689 billion tons.1−3 China’s oil shale reserves are abundant, estimated at 720 billion tons, which is equivalent to 47.6 billion tons of shale oil; therefore, it is likely to become the best substitute for conventional fossil fuels.4,5 Oil shales are sedimentary rocks containing a high proportion of organic matter (kerogen),6 which can be converted into a material similar to petroleum by heating.7,8 However, the incomplete transformation of kerogen results in the obtained shale oil containing a large amount of high-molecular-weight hydrocarbons. The existence of these components leads to the instability and high viscosity of shale oil.9,10 Therefore, there is a certain practical significance and theoretical value to finding a new method to promote the conversion of oil shale into shale oil as well as improving the oil quality.11
Compared with the conventional utilization of oil shale such as surface processing and retorting and burning, the in situ conversion process (ICP) has been developing as an energy-efficient approach for enhancing oil and gas recovery.12,13 The main objective of the oil shale ICP is to yield hydrocarbons as much as possible under the downhole conditions. This process definitely involves breaking the heavy components such as kerogen and bitumen and improving the movability of the derived oil. Kerogen is the main organic matter in oil shale, which is the largest and most economical organic carbon reservoir and hydrocarbon source.14,15 Hydraulic fracture facilitates the accelerated repining of immature kerogen and promoting kerogen to bitumen conversion as there are high-pressure steam and acidic fracturing fluid.16 Aquathermolysis has many advantages over other upgrading methods for unconventional heavy oil exploitation,17 and the most appropriate catalysts are those containing strong, active sites that can cleave the C–C, C–O, and related bonds in resins and asphaltenes, leading to an incline of saturates and lighter aromatic hydrocarbons.
The minerals in the shale revealed a slight catalytic effect on organic conversion under exploitation conditions where hot water or pressurized steam was injected. More nanocatalysts have been designed and prepared for the in situ conversion of heavy oil.18 Solid-acid catalysts are mostly supported catalysts, which can effectively overcome the disadvantages of homogeneous catalysts and enhance the oil yield of oil shale in situ exploration. Modified solid-acid catalyst, such as grafting sulfonic acid group, shows good catalytic activity to some extent, because of the high density of the sulfonic acid group (−SO3H) and stability.19−21 Sulfonic acid groups (−SO3H) were grafted to the meso-Y zeolite framework for biodiesel hydrocracking to jet fuel.22 Sulfonic acid functionalized SBA-15 catalyst was employed for the highly selective production of 5-hydroxymethylfurfural from fructose.23
For enhancing the recovery of hydrocarbons from shale oil, a mineral-based clin/SBA-15 catalyst was made in a lab,24 and better performance could be obtained with the high density of strong acid sites on clin/SBA-15. In this manuscript, we modified clin/SBA-15 with sulfuric acid by grafting the −SH group and H2O2 oxidation, and the SO3H/SBA-15 catalysts were tested for their activity for enhanced oil recovery (EOR) of oil shale under 280 °C. The milder reaction conditions of catalytic conversion may be beneficial to promote the practical application of in situ oil shale upgrading.
2. Materials and Methods
2.1. Catalyst Preparation
SO3H/SBA-15 was prepared from clin/SBA-15 and (3-mercaptopropyl) trimethoxysilane (MPTMS) in toluene refluxing at 110 °C for 24 h, with 30% H2O2 oxidation, and 0.5 mol/L H2SO4 washing (Figure 1). The supporter clin/SBA-15 was prepared from clinoptilolite by the hydrothermal method according to the previous papers.25,26 The energy-dispersive spectrometry (EDS) and Fourier transform infrared (FT-IR) spectrum of SO3H/SBA-15 showed the presence of the sulfur element, which indicates the grafting of the sulfonic acid group.
Figure 1.

Preparation route of SO3H/SBA-15.
2.2. Characterization of SO3H/SBA-15
The synthesized catalysts were characterized by a X-ray diffractometer (XRD) (Bruker D8 ADVANCE) for the phase identification with Cu Kα radiation at 30.0 kV and 20.0 mA. The 2θ scan range was from 0.6 to 7° and 6 to 50°. Scanning electron microscopy (SEM) and EDS analyses were carried out using ZEISS (GeminiSEM 300) at 15 kV, and transmission electron microscopy (TEM) analysis was carried out using (JEM 2100) at 30 kV. The functional groups were analyzed by FT-IR spectroscopy on Nicolet 380 in the range from 4000 to 400 cm–1. The Brunauer–Emmett–Teller (BET) surface area was measured by nitrogen adsorption at 77 K in a volumetric static adsorption instrument (Micromeritics ASAP 2020). Before measuring the nitrogen adsorption, the sample was degassed in a vacuum at 180 °C for 3 h. According to the adsorption branches of the isotherms, the Barrett–Joyner–Halenda (BJH) method was used to calculate the pore size distribution.
The total acids and medium and strong acids were determined using both chemical titration and UV spectra. To determine the total acidity, 0.04 g of catalyst was fully reacted with 20.0 mL of 0.01 mol/L sodium hydroxide solution for 2 h, and the supernatant was obtained by centrifugation. Then, the residual sodium hydroxide in the supernatant was titrated with 0.01 mol/L hydrochloric acid solution of standard concentration, and the acid–base indicator used was a 1% (m/v) phenolphthalein solution. To determine the medium and strong acids, 0.02 g of catalyst and 50 mL of 0.632 mmol/L pyridine cyclohexane solution were ultrasonicated at 298 K for 3 h. The absorbance of the extractions of the samples is determined at 251 nm, and the amounts of medium and strong acids were calculated according to the standard curve.
2.3. Oil Shale In Situ Catalytic Conversion
The properties of oil shale are shown in Table S1. The oil shale was crushed and screened to <10 mm size. The in situ catalytic conversion experiment of oil shale to obtain shale oil was carried out at a final temperature of 280 °C (maintained for 4 h) and a heating rate of 10 °C/min using a 50 mL batch reactor with 20 mL of water, 8 g of oil shale, and 0.8 g of catalysts. The liquid products of oil shale in situ catalytic conversion were extracted using dichloromethane; after which, they were filtered to reach an oil–water separation using vacuum filters and washed with dichloromethane. The schematic diagram for the reactor was provided in our previous papers.24
The simulated distillation method SY/T 5779-2008 was employed to determine the boiling point distribution of the oil samples.
Gas chromatography–mass spectrometry (GC–MS) analysis was conducted using Agilent 7890GC-5975MS to analyze the liquid productions. The split ratio was set at 5:1 for analyzing the shale oil, and the temperature was maintained at 300 °C. The initial temperature was 50 °C and then heated at a 25 °C/min temperature ramp to 200 °C and heated at a 3 °C/min temperature ramp until a final temperature of 280 °C and held for 10 min.
The higher heating value (HHV),27 as eq 1, was calculated based on the elemental analysis.
| 1 |
where C, H, and O are the mass percentage contents of carbon, hydrogen, and oxygen, respectively.
The energy recovery rate (ER),28 as eq 2, of shale oil is an important index to evaluate the liquefaction efficiency.
| 2 |
2.4. Oil Shale Pyrolysis
The oil shale pyrolysis experiment was performed on STA409PC. The mixture of oil shale and catalysts with the total mass of around 10 mg (9 mg oil shale + 1 mg catalyst) was added into the quartz crucible, heated to 110 °C in an N2 flow with a rate of 40 mL/min, and maintained for 20 min to remove moisture. The mixture was then heated to 700 °C at a rate of 10 °C/min and in an N2 flow with a rate of 40 mL/min.
The kinetic parameters, pre-exponential factor A and activation energy Ea, were calculated according to the Newkirk method as shown in eqs 3 and4.
| 3 |
| 4 |
In this equation, α is the reaction fraction, k is the reaction rate constant, Ea is the activation energy (kJ/mol), A is the pre-exponential factor, R is the gas constant, 8.314 J/(mol K), and T is the temperature (K).
3. Result and Discussion
3.1. Catalyst Characterizations
The TEM images (cross section direction (a1, a2) and perpendicular to the channel direction (a3)) and the SEM images (b) are shown in Figure 2. Clin/SBA-15 comprised rope-like domains with a relatively uniform size. The images showed the longitudinal arrangement of the mesopores, which was the characteristic of SBA-15 materials. It can be known from the TEM image that the two-dimensional hexagonal structure of clin/SBA-15 was not destroyed after the grafting of the sulfonic acid group. The pore size is ∼5 nm, which has good active center accessibility for heavy components in oil shale. The EDS image of the SO3H/SBA-15 catalyst (4 mmol/g) is shown in Figure 2. Also, the following elements were detected on the surface of the catalyst: Si, Al, O, C, and S, which indicated that clin/SBA-15 was successfully grafting with the sulfonic acid group. The presence of mesoporous silica was confirmed by strong O and Si signals, while Al and S signals detected in the surface area showed that Al and S elements were evenly distributed on the catalyst surface. The silicon–aluminum ratio of the SO3H/SBA-15 catalyst is 77.14, and the loading of S is 3.68 mmol/g.
Figure 2.

TEM images (a1, a2, a3), SEM images (b1, b2, b3), and EDS images of the SO3H/SBA-15 (4 mmol/g) catalyst.
The wide-angle and small-angle XRD patterns of SO3H/SBA-15 are shown in Figure 3a,b, respectively. According to the results, there is an obvious (100) mesoporous diffraction peak in the small-angle region, which was the typical characteristic of SBA-15.29,30 This peak confirmed that the hexagonal structure was also maintained after the sulfonic groups were grafted. The nitrogen adsorption–desorption isotherms and the corresponding pore size distributions of SO3H/SBA-15 samples are depicted in Figure 3c. The N2 adsorption–desorption isotherm of SO3H/SBA-15 was a type IV feature with a H1 type hysteresis loop, which was the typical characteristics of SBA-15.31,32 The specific surface area of SO3H/SBA-15 declined to 541.15 m2/g, which was lower than that of clin/SBA-15 (563 m2/g),24 and the pore size was also reduced to 4.80 nm. The decrease in the surface area, pore volume, and pore size of the SO3H/SBA-15 suggested that the grafting reaction was not only carried out on the surface of the catalyst but also proceeded in the inside of the pore, resulting in a certain degree of plugging phenomenon.33 FT-IR was used as an effective method to determine whether silane was successfully grafted onto the surface of the supporter.34 The FT-IR image of SO3H/SBA-15 was shown in Figure 3d. In addition to the typical absorption peaks of SBA-1535,36 at 3468, 1083, 806, 461, and 1643 cm–1, there was a weak absorption peak of the S–H bond at 2356 cm–1, indicating that sulfhydryl has been successfully grafted to the surface of the carrier clin/SBA-15. After oxidation by H2O2, the peak disappeared, indicating that −SH is completely oxidized to −SO3H, which was consistent with the reports of Xingdong.37 The stretching vibration of methylene C–H bond in MPTMS is at 2950 cm–1.
Figure 3.

XRD patterns (a) and (b), N2 adsorption–desorption isotherms and pore size distributions (c), and FT-IR spectra of the SO3H/SBA-15 catalyst (d).
3.2. Relationship of Shale Oil Yield and Acid Amount
Table 1 shows the total and medium acid amounts of SO3H/SBA-15. The total acid content of SO3H/SBA-15 had a maximum value of 1.47 mmol/g when the loading was 5 mmol/g, and the medium-strong acid content reached 86.90% at 4 mmol/g grafting.
Table 1. Acid Amounts of SO3H/SBA-15 Catalysts.
| total acids (mmol/g) | medium and strong acid (mmol/g) | medium and strong acid content (%) | |
|---|---|---|---|
| SO3H/SBA-15(1 mmol/g) | 1.39 | 1.11 | 79.86 |
| SO3H/SBA-15(2 mmol/g) | 1.43 | 1.06 | 74.13 |
| SO3H/SBA-15(3 mmol/g) | 1.45 | 1.13 | 77.93 |
| SO3H/SBA-15(4 mmol/g) | 1.45 | 1.26 | 86.90 |
| SO3H/SBA-15(5 mmol/g) | 1.47 | 1.24 | 84.35 |
| SO3H/SBA-15(6 mmol/g) | 1.46 | 1.25 | 85.62 |
The product distribution, oil, residual, and gas- and water-soluble organics (WSO) of oil shale conversion with the SO3H/SBA-15 catalyst are shown in Figure 4. The original amount of the product yield is in the Supporting Information Table S2. The oil yield of oil shale reached 39.62–55.55% after adding SO3H/SBA-15, and the highest oil yield reached 55.55% when the loading was 4 mmol/g, which was 42.65% higher than that of oil shale thermal conversion.
Figure 4.

Product distribution map of the SO3H/SBA-15 catalyst for oil shale conversion (280 °C, 4 h, 8 g of oil shale, 0.8 g of catalysts, 20 mL of water).
The relationship between the acid content of SO3H/SBA-15 and the oil yield of shale oil is shown in Figure 5. It can be seen that the acid amount was not linearly related to the oil yield, and there was an extreme point. When the total acid amount was 1.47 mmol/g, the medium and strong acid amounts were 1.26 mmol/g, accounting for 87%. That is to say, the oil yield reached the maximum when the loading amount of sulfonic acid was 4 mmol/g, which was attributed to medium and strong acid sites.
Figure 5.

Relationship between the acid amount of SO3H/SBA-15 catalyst and oil shale oil production.
3.3. Shale Oil Conversion with SO3H/SBA-15
From the GC–MS analysis (Figure 6), nearly half of the products are hydrocarbons, and the rest were oxygenated compounds, such as alcohols, ketones, organic acids, and so on. With the loading of 3, 4, and 5 mmol/g, the yield of hydrocarbon could reach 58–60%, which was 20% higher than that without catalyst, while the yield of hydrocarbon decreases when the loading was up to 6 mmol/g. It could be inferred that the appropriate amount of acid sites was beneficial to enhance the yield of hydrocarbons. Deoxygenation was the crucial process for shale oil upgrading, and it could be promoted by strong acid sites on the catalyst. This work provided a better understanding of the role of −SO3H and new insights into the design of the in situ upgrading catalysts for oil shale exploration.
Figure 6.

Product categories of shale oil derived from shale aqueous conversion (280 °C, 4 h, 8 g oil shale, 0.8 g catalysts, 20 mL water).
The carbon number distribution of oil shale catalytic conversion products is shown in Figure 7 and Table 2. The carbon number distributions of the catalytic conversion products of oil shale were all from C6 to C19, and the reaction products were mainly alkanes and naphthenes. The SO3H/SBA-15 catalysts with different loadings had different selectivities to carbon numbers. The selectivity of C9 was the best when the loading was 4 mmol/g, accounting for about 25%, and the selectivity of C7 was the second, accounting for 21.23%. It can be known from Table 2 that as the loading increased, the content of naphtha gradually increased. When the loading was 4 mmol/g, the content of naphtha reached a maximum of 70.84%; when the load continued to increase, the content of naphtha decreased instead, which was caused by the medium-strong acid content of SO3H/SBA-15. The result shows that increasing the medium-strong acid content in the catalyst could better convert the macromolecules to small molecules and had better selectivity for the catalytic conversion products.
Figure 7.

Carbon number distribution of oil shale catalytic conversion products (280 °C, 4 h, 8 g oil shale, 0.8 g catalysts, 20 mL water).
Table 2. Carbon Number Distribution of Oil Shale Catalytic Conversion Products (wt %).
| C5–C11 | C11–C20 | |
|---|---|---|
| 1 mmol/g | 41.51 | 58.49 |
| 2 mmol/g | 43.17 | 56.83 |
| 3 mmol/g | 47.39 | 52.61 |
| 4 mmol/g | 70.84 | 29.16 |
| 5 mmol/g | 47.72 | 52.28 |
| 6 mmol/g | 43.81 | 56.19 |
The boiling point distribution of shale oil conversion products with SO3H/SBA-15 is shown in Figure 8 and Table 3. The boiling point of the conversion products of shale oil with SO3H/SBA-15 is between 130 and 330 °C. There was no vacuum gas oil and residues above 350 °C. From Table 3, the content of naphtha increased with the increase of the acid amount in the SO3H/SBA-15. The content of naphtha was the highest, reaching 37.14%, when the loading was 4 mmol/g.
Figure 8.

Boiling point distribution of the oil shale catalytic conversion products (280 °C, 4 h, 8 g of oil shale, 0.8 g of catalysts, 20 mL of water).
Table 3. Boiling Point Distribution of the Oil Shale Catalytic Conversion Products (wt %).
| 100–170 °C | 170–350 °C | |
|---|---|---|
| 1 mmol/g | 24.60 | 75.40 |
| 2 mmol/g | 24.06 | 75.94 |
| 3 mmol/g | 27.44 | 72.56 |
| 4 mmol/g | 41.44 | 58.56 |
| 5 mmol/g | 33.91 | 66.09 |
| 6 mmol/g | 26.23 | 73.77 |
The elemental analysis of the conversion products of shale oil with SO3H/SBA-15 is shown in Table 4. The elemental analysis was performed from the result of GC–MS (Table S3). Compared with the oil product of thermal conversion, the content of C in the shale oil conversion products with SO3H/SBA-15 increased by 33.13–33.89%, the content of O decreased by 32.99–34.26%, and the H content enhanced to 4.61–5.55%. Moreover, the H/C and O/C atomic ratios in the conversion products were significantly reduced. The quality of oil increases when O/C decreases and the decrease of H/C was attributed to demethylation or further decomposition into the gas phase. The increase of the C content and the decrease of the O content in the catalytic conversion sample had a significant effect on the increase of the high calorific value, which increased it by 15–8 MJ/kg. At the same time, the energy recovery rate of catalytic conversion of shale oil increased significantly, and the energy recovery rate of 4 mmol/g SO3H/SBA-15 catalytic conversion of shale oil could reach 81.51%.
Table 4. Element Content, HHV Value, and ER Value of the Oil Shale Catalytic Conversion Products.
| atomic ratio |
|||||||
|---|---|---|---|---|---|---|---|
| C (wt %) | H (wt %) | O (wt %) | H/C | O/C | HHV (MJ/kg) | ER (%) | |
| oil shale | 47.14 | 7.62 | 40.22 | 1.94 | 0.64 | 19.63 | |
| without catalyst | 53.45 | 7.72 | 30.67 | 1.73 | 0.43 | 23.61 | 34.55 |
| 1 mmol/g | 80.87 | 8.17 | 10.96 | 1.21 | 0.10 | 37.03 | 74.74 |
| 2 mmol/g | 80.47 | 7.30 | 12.23 | 1.09 | 0.11 | 35.43 | 77.16 |
| 3 mmol/g | 81.03 | 7.34 | 11.63 | 1.09 | 0.11 | 35.78 | 78.26 |
| 4 mmol/g | 80.57 | 7.61 | 11.82 | 1.13 | 0.11 | 35.98 | 81.51 |
| 5 mmol/g | 80.93 | 7.23 | 11.84 | 1.07 | 0.11 | 35.56 | 80.32 |
| 6 mmol/g | 80.27 | 7.57 | 12.15 | 1.13 | 0.11 | 35.76 | 80.07 |
3.4. Oil Shale Pyrolysis
The pyrolysis process of shale oil is basically divided into three stages:38 the pyrolysis of the low-temperature section (50–200 °C), this stage is mainly caused by the water volatilization in the oil shale; the high-temperature section pyrolysis (300–600 °C) is mainly caused by the pyrolysis of organic matter in shale oil; and ultrahigh-temperature section (700–900 °C) is mainly caused by the pyrolysis of inorganic matter and fixed carbon. Compared with the low-temperature section and the high-temperature section, the thermal decomposition process at this stage is less obvious. Combined with the specific temperature of the oil shale pyrolysis experiment, the final temperature used in the thermogravimetric experiment is 700 °C.
Figure 9 shows the TG and differential thermogravimetric (DTG) curves of shale oil in an N2 atmosphere with a heating rate of 10 °C/min. According to the DTG curve, a small weight loss peak appeared in the temperature range of 50–200 °C, which is the dehydration peak of the oil shale pyrolysis process; a very obvious weightlessness peak appeared in the temperature range of 300–600 °C, which is the weightlessness peak caused by the pyrolysis of organic matter in shale oil, especially the pyrolysis of asphalt and kerogen.
Figure 9.
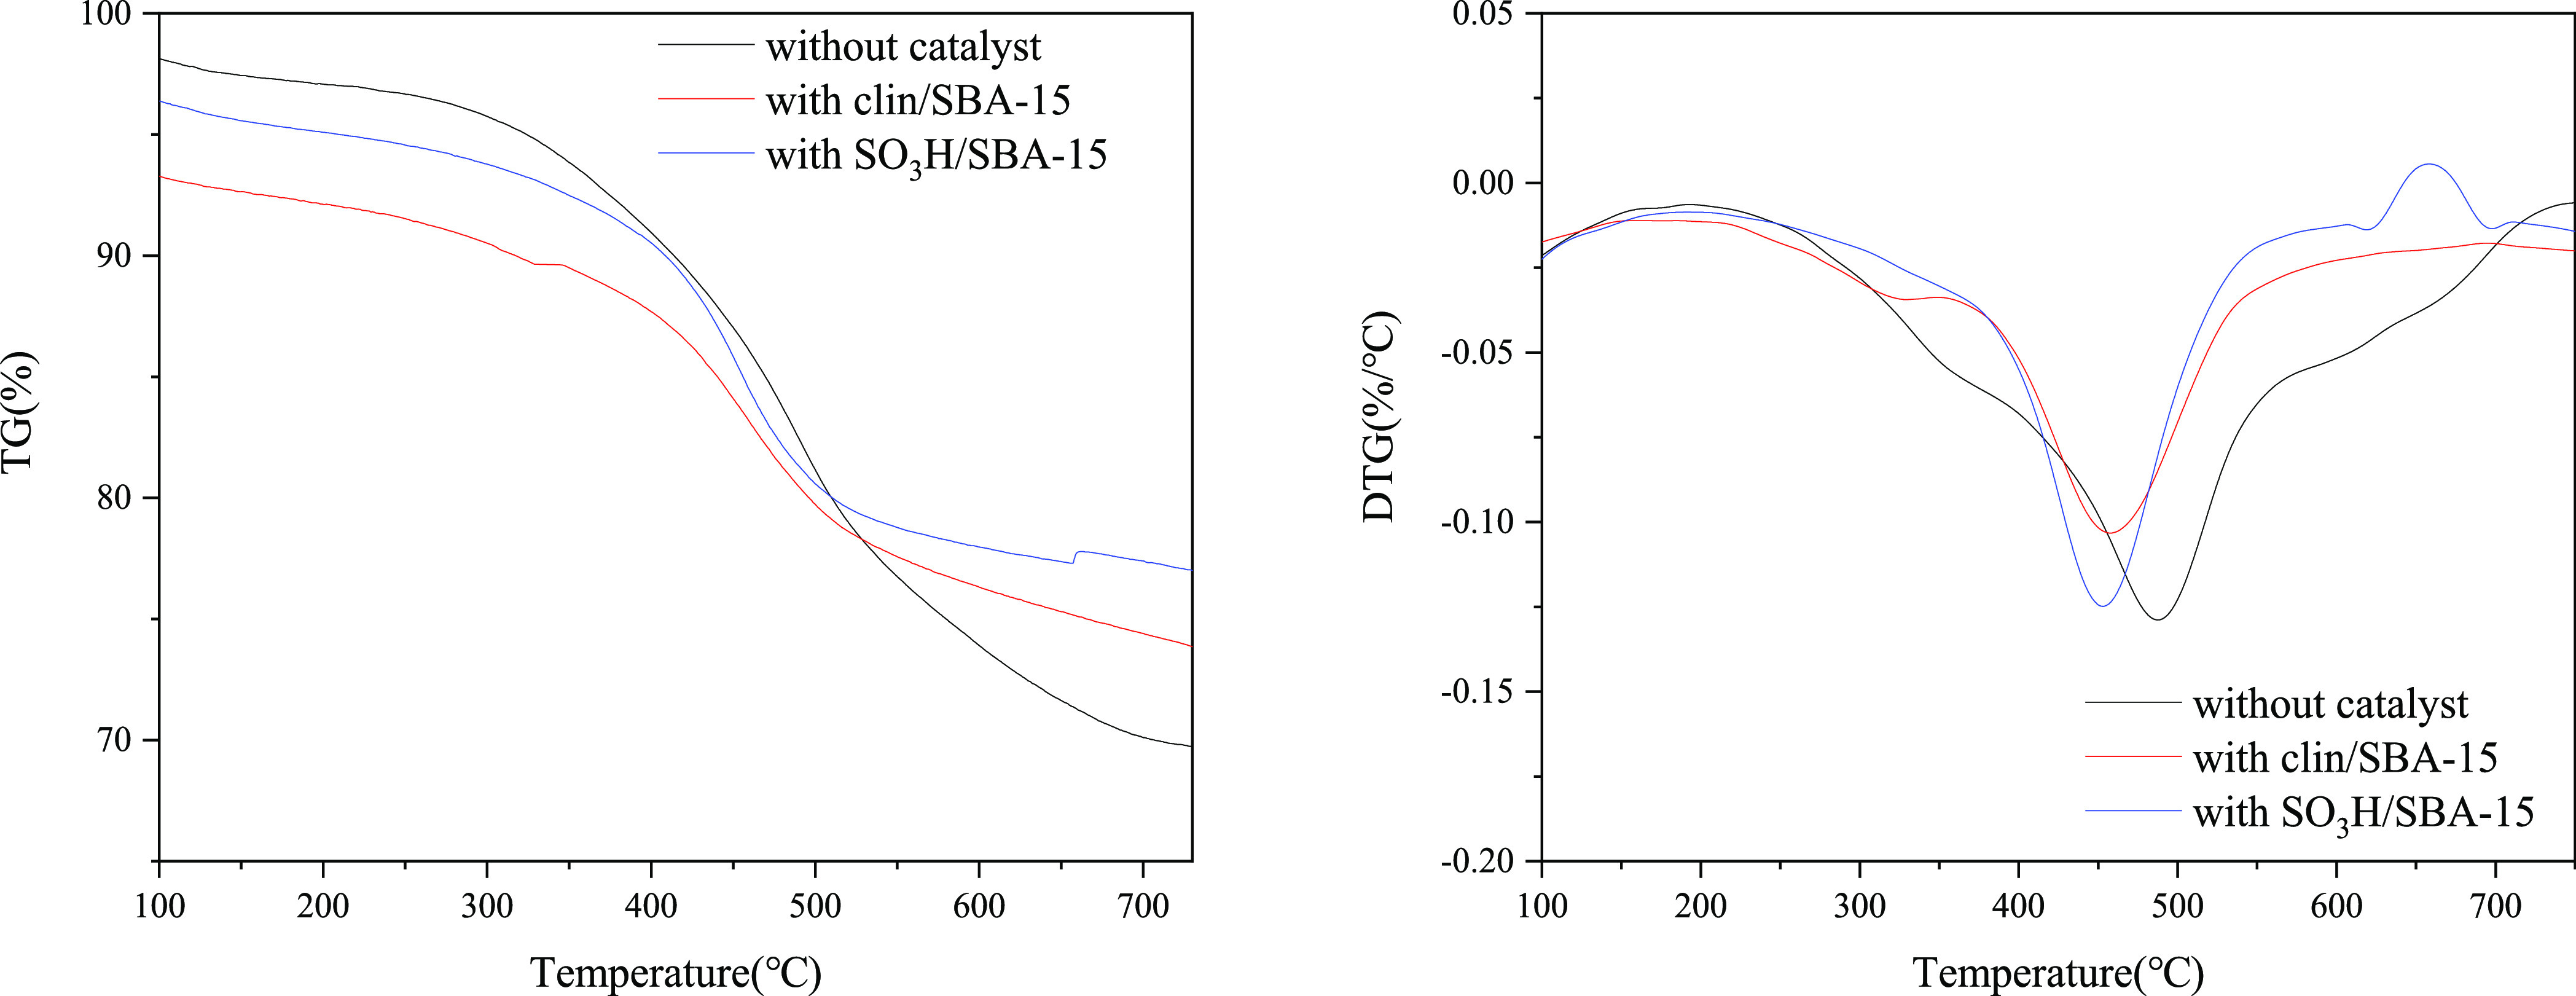
TG and DTG curve of oil shale pyrolysis and catalytic pyrolysis.
Shale oil pyrolysis showed a maximum weight loss rate at 459.47 °C, and the temperature for maximum weight loss rate for shale oil with clin/SBA-15 was 457.91 °C and that with SO3H/SBA-15 was 451.74 °C, which are both lower than the maximum weight loss rate temperature of the shale oil pyrolysis. It shows that after adding catalysts, the pyrolysis temperature for the maximum weight loss rate moves to the low-temperature region, and the catalyst promotes the pyrolysis of shale oil.39 Thakur and Nuttall40 studied the pyrolysis kinetics of shale oil using isothermal and nonisothermal thermogravimetry method. The results show that the pyrolysis process of shale oil follows the first-order kinetics.
The kinetic analysis of the pyrolysis process was performed using the Newkirk method, and the calculation results are shown in Table 5. The activation energy of oil shale pyrolysis is 107.80 kJ/mol, which is in the range of the activation energy of shale oil pyrolysis reported by Sun38 et al. After adding clin/SBA-15 and SO3H/SBA-15, the activation energies were declined to 73.15 and 78.74 kJ/mol, respectively. The activation energy of the breaking of the C–C bonds of heavy oil was about 168.7 kJ/mol (calculated by the Friedman method),41 and it was much higher than that of catalytic oil shale pyrolysis. It can be inferred that the addition of catalysts can converse more components in shale oil, reduce the conversion temperature of oil shale, and significantly increase the distillate yield in the lower temperature range.
Table 5. Characteristic Decomposition Temperature and Activation Energy of Oil Shale Pyrolysis and Catalytic Pyrolysis (the Newkirk model).
| TM (°C) | Ea (kJ/mol) | R2 | temperature zone (°C) | |
|---|---|---|---|---|
| thermal | 459.47 | 107.80 | 0.997 | 300–600 |
| with clin/SBA-15 | 457.91 | 73.15 | 0.998 | 300–600 |
| with SO3H/SBA-15 | 451.74 | 78.74 | 0.998 | 300–600 |
4. Conclusions
In this manuscript, by adding the SO3H-SBA-15 catalyst, the activation energy of oil shale catalytic pyrolysis was reduced, the conversion of oil shale was promoted, and the relationship between the acid amount of catalyst and oil production yields was explored. The quality of product oil was further improved, including more C5–C11 distillates, declining O/C ratio, and higher HHV. The Newkirk method was used to analyze the thermal transformation process of oil shale, and the thermal transformation of oil shale conforms to follow the first-order reaction model.
Supporting Information Available
The Supporting Information is available free of charge at https://pubs.acs.org/doi/10.1021/acsomega.0c06264.
Methods of catalyst preparation; list of geochemical properties of oil shale (Table S1); list of characteristics of oil shale determined by the Fisher assay analysis under anoxic conditions (Table S2); list of product yield of oil shale conversion with SO3H/SBA-15 (Table S3); and list of components of the SO3H/SBA-15 catalyst for the catalytic conversion reaction of oil shale (Table S4) (PDF)
Author Contributions
The manuscript was written through contributions of all authors. All authors have given approval to the final version of the manuscript.
The authors thank the financial support from the China National Key Research and Development Project (No. 2019YFA0705503), National Natural Science Foundation of China (No. 21376230) and State Research and Development Center for Oil Shale Exploitation (No. G580019001).
The authors declare no competing financial interest.
Supplementary Material
References
- Altun N. E.; Hiçyilmaz C.; Hwang J. Y.; Suat BaǦci A.; Kök M. V. Oil shales in the world and Turkey; reserves, current situation and future prospects: a review. Oil Shale 2006, 23, 211–227. [Google Scholar]
- Ngô C.; Natowitz J. B.. Our Energy Future: Resources, Alternatives, and the Environment; Wiley, 2009. [Google Scholar]
- Shawabkeh R. Equilibrium study and kinetics of Cu2+ removal from water by zeolite prepared from oil shale ash. Process Saf. Environ. Prot. 2009, 87, 261–266. 10.1016/j.psep.2009.04.001. [DOI] [Google Scholar]
- Chang Z.; Chu M.; Zhang C.; Bai S.; Lin H.; Ma L. Influence of inherent mineral matrix on the product yield and characterization from Huadian oil shale pyrolysis. J. Anal. Appl. Pyrolysis 2018, 130, 269–276. 10.1016/j.jaap.2017.12.022. [DOI] [Google Scholar]
- Lu Y.; Wang Y.; Wang Q.; Zhang J.; Zhao Y.; Zhang Y. Investigation on the catalytic effect of AAEMs on the pyrolysis characteristics of Changji oil shale and its kinetics. Fuel 2020, 267, 117287 10.1016/j.fuel.2020.117287. [DOI] [Google Scholar]
- Niu M.; Wang S.; Han X.; Jiang X. Yield and characteristics of shale oil from the retorting of oil shale and fine oil-shale ash mixtures. Appl. Energy 2013, 111, 234–239. 10.1016/j.apenergy.2013.04.089. [DOI] [Google Scholar]
- Trikkel A.; Kuusik R.; Martins A.; Pihu T.; Stencel J. M. Utilization of Estonian oil shale semicoke. Fuel Process. Technol. 2008, 89, 756–763. 10.1016/j.fuproc.2008.01.010. [DOI] [Google Scholar]
- Han X.; Kulaots I.; Jiang X.; Suuberg E. M. Review of oil shale semicoke and its combustion utilization. Fuel 2014, 126, 143–161. 10.1016/j.fuel.2014.02.045. [DOI] [Google Scholar]
- Jiang H.; Hong W.; Zhang Y.; Deng S.; Chen J.; Yang C.; Ding H. Behavior, kinetic and product characteristics of the pyrolysis of oil shale catalyzed by cobalt-montmorillonite catalyst. Fuel 2020, 269, 117468 10.1016/j.fuel.2020.117468. [DOI] [Google Scholar]
- Li C.; Huang W.; Zhou C.; Chen Y. Advances on the transition-metal based catalysts for aquathermolysis upgrading of heavy crude oil. Fuel 2019, 257, 115779 10.1016/j.fuel.2019.115779. [DOI] [Google Scholar]
- Demirbas A. Conversion of oil shale to liquid hydrocarbons. Energy Sources, Part A 2016, 38, 2698–2703. 10.1080/15567036.2015.1115925. [DOI] [Google Scholar]
- Kang Z.; Zhao Y.; Yang D. Review of oil shale in-situ conversion technology. Appl. Energy 2020, 269, 115121 10.1016/j.apenergy.2020.115121. [DOI] [Google Scholar]
- Bauman J. H.; Deo M. Simulation of a Conceptualized Combined Pyrolysis, In Situ Combustion, and CO2 Storage Strategy for Fuel Production from Green River Oil Shale. Energy Fuels 2012, 26, 1731–1739. 10.1021/ef2017072. [DOI] [Google Scholar]
- Pan S.; Wang Q.; Bai J.; Chi M.; Cui D.; Wang Z.; Liu Q.; Xu F. Molecular Structure and Electronic Properties of Oil Shale Kerogen: An Experimental and Molecular Modeling Study. Energy Fuels 2018, 32, 12394–12404. 10.1021/acs.energyfuels.8b03307. [DOI] [Google Scholar]
- Agrawal V.; Sharma S. Molecular characterization of kerogen and its implications for determining hydrocarbon potential, organic matter sources and thermal maturity in Marcellus Shale. Fuel 2018, 228, 429–437. 10.1016/j.fuel.2018.04.053. [DOI] [Google Scholar]
- Wang L.; Tian Y.; Yu X.; Wang C.; Yao B.; Wang S.; Winterfeld P. H.; Wang X.; Yang Z.; Wang Y.; Cui J.; Wu Y.-S. Advances in improved/enhanced oil recovery technologies for tight and shale reservoirs. Fuel 2017, 210, 425–445. 10.1016/j.fuel.2017.08.095. [DOI] [Google Scholar]
- Muraza O.; Galadima A. Aquathermolysis of heavy oil: A review and perspective on catalyst development. Fuel 2015, 157, 219–231. 10.1016/j.fuel.2015.04.065. [DOI] [Google Scholar]
- Meng X.; Bian J.; Li J.; Ma Z.; Long Q.; Su J. Porous aluminosilicates catalysts for low and medium matured shale oil in situ upgrading. Energy Sci. Eng. 2020, 8, 2859–2867. 10.1002/ese3.704. [DOI] [Google Scholar]
- Ma X.; Yuan H.; Zhang H. Preparation, characterization and application of sulfonated mesoporous hollow carbon microspheres. J. Porous Mater. 2019, 26, 1103–1110. 10.1007/s10934-018-0706-0. [DOI] [Google Scholar]
- Bolagam R.; Boddula R.; Srinivasan P. One-step preparation of sulfonated carbon and subsequent preparation of hybrid material with polyaniline salt: a promising supercapacitor electrode material. J. Solid State Electrochem. 2017, 21, 1313–1322. 10.1007/s10008-016-3487-x. [DOI] [Google Scholar]
- Chang B.; Li Y.; Guo Y.; Yin H.; Zhang S.; Yang B. SO3H-functionalized hollow mesoporous carbon sphere prepared by simultaneously achieving sulfonation and hollow structure. J. Porous Mater. 2015, 22, 629–634. 10.1007/s10934-015-9935-7. [DOI] [Google Scholar]
- Cheng J.; Zhang Z.; Zhang X.; Liu J.; Zhou J.; Cen K. Sulfonated mesoporous Y zeolite with nickel to catalyze hydrocracking of microalgae biodiesel into jet fuel range hydrocarbons. Int. J. Hydrogen Energy 2019, 44, 1650–1658. 10.1016/j.ijhydene.2018.11.110. [DOI] [Google Scholar]
- Wang L.; Zhang L.; Li H.; Ma Y.; Zhang R. High selective production of 5-hydroxymethylfurfural from fructose by sulfonic acid functionalized SBA-15 catalyst. Composites, Part B 2019, 156, 88–94. 10.1016/j.compositesb.2018.08.044. [DOI] [Google Scholar]
- Yu C.; Qi Z.; Guo Y.; Bian J.; Meng X.; Long Q. Oil shale in situ catalytic conversion over clin/SBA-15 composites under subcritical water. J. Anal. Appl. Pyrolysis 2020, 152, 104942 10.1016/j.jaap.2020.104942. [DOI] [Google Scholar]
- Bian J.; Wang Y.; Zhang Q.; Fang X.; Feng L.; Li C. Fatty acid decarboxylation reaction kinetics and pathway of co-conversion with amino acid on supported iron oxide catalysts. RSC Adv. 2017, 7, 47279–47287. 10.1039/C7RA08507A. [DOI] [Google Scholar]
- Li J.; Fang X.; Bian J.; Guo Y.; Li C. Microalgae hydrothermal liquefaction and derived biocrude upgrading with modified SBA-15 catalysts. Bioresour. Technol. 2018, 266, 541–547. 10.1016/j.biortech.2018.07.008. [DOI] [PubMed] [Google Scholar]
- Wildschut J.; Mahfud F. H.; Venderbosch R. H.; Heeres H. J. Hydrotreatment of Fast Pyrolysis Oil Using Heterogeneous Noble-Metal Catalysts. Ind. Eng. Chem. Res. 2009, 48, 10324–10334. 10.1021/ie9006003. [DOI] [Google Scholar]
- Chen J. Bio-oil production from hydrothermal liquefaction of Pteris vittata L.: Effects of operating temperatures and energy recovery. Bioresour. Technol. 2018, 265, 320–327. 10.1016/j.biortech.2018.06.019. [DOI] [PubMed] [Google Scholar]
- Choi M.; Heo W.; Kleitz F.; Ryoo R. Facile synthesis of high quality mesoporous SBA-15 with enhanced control of the porous network connectivity and wall thickness. Chem. Commun. 2003, 12, 1340–1341. 10.1039/B303696K. [DOI] [PubMed] [Google Scholar]
- Zhao D.; Sun J.; Li Q.; Stucky G. D. Morphological Control of Highly Ordered Mesoporous Silica SBA-15. Chem. Mater. 2000, 12, 275–279. 10.1021/cm9911363. [DOI] [Google Scholar]
- Zhang P.; Wu H.; Fan M.; Sun W.; Jiang P.; Dong Y. Direct and postsynthesis of tin-incorporated SBA-15 functionalized with sulfonic acid for efficient biodiesel production. Fuel 2019, 235, 426–432. 10.1016/j.fuel.2018.08.029. [DOI] [Google Scholar]
- Kruk M.; Jaroniec M.; Ko C. H.; Ryoo R. Characterization of the Porous Structure of SBA-15. Chem. Mater. 2000, 12, 1961–1968. 10.1021/cm000164e. [DOI] [Google Scholar]
- Xue Z.; Shang H.; Xiong C.; Lu C.; An G.; Zhang Z.; Cui C.; Xu M. Synthesis of polyoxymethylene dimethyl ethers catalyzed by sulfonic acid-functionalized mesoporous SBA-15. RSC Adv. 2017, 7, 20300–20308. 10.1039/C7RA02678A. [DOI] [Google Scholar]
- Won J.-H.; Lee H.-J.; Yoon K.-S.; Hong Y. T.; Lee S.-Y. Sulfonated SBA-15 mesoporous silica-incorporated sulfonated poly(phenylsulfone) composite membranes for low-humidity proton exchange membrane fuel cells: Anomalous behavior of humidity-dependent proton conductivity. Int. J. Hydrogen Energy 2012, 37, 9202–9211. 10.1016/j.ijhydene.2012.03.036. [DOI] [Google Scholar]
- Jiang T.; Huang Q.; Li Y.; Fang M.; Zhao Q. Catalytic performance of strong acid catalyst: Methyl modified SBA-15 loaded perfluorinated sulfonic acid obtained by the waste perfluorinated sulfonic acid ion exchange membrane. J. Solid State Chem. 2018, 258, 602–609. 10.1016/j.jssc.2017.11.027. [DOI] [Google Scholar]
- Xing R.; Liu N.; Liu Y.; Wu H.; Jiang Y.; Chen L.; He M.; Wu P. Novel Solid Acid Catalysts: Sulfonic Acid Group-Functionalized Mesostructured. Polymers 2007, 17, 2455–2461. [Google Scholar]
- Xingdong Y.; S j.; Guohui Li.; Jinglai Z.; Man K. J.; Eon P. S. Prepararion of Highly Active Esterif icat ion Catalyst SBA-15 Mesoporous Silica Funct ional ized with Sulfonic Acid Group. Chem. Res. Chin. Univ. 2002, 23, 2332–2335. [Google Scholar]
- Sun Y.; Bai F.; Lü X.; Jia C.; Wang Q.; Guo M.; Li Q.; Guo W. Kinetic study of Huadian oil shale combustion using a multi-stage parallel reaction model. Energy 2015, 82, 705–713. 10.1016/j.energy.2015.01.080. [DOI] [Google Scholar]
- Azizi K.; Keshavarz Moraveji M.; Abedini Najafabadi H. Characteristics and kinetics study of simultaneous pyrolysis of microalgae Chlorella vulgaris, wood and polypropylene through TGA. Bioresour. Technol. 2017, 243, 481–491. 10.1016/j.biortech.2017.06.155. [DOI] [PubMed] [Google Scholar]
- Thakur D. S.; Nuttall H. E. Kinetics of pyrolysis of Moroccan oil shale by thermogravimetry. Ind. Eng. Chem. Res. 1987, 26, 1351–1356. 10.1021/ie00067a015. [DOI] [Google Scholar]
- Chen K.; Wang Z.; Liu H.; Ruan Y.; Guo A. Thermodynamic and thermokinetic study on pyrolysis process of heavy oils. J. Therm. Anal. Calorim. 2013, 112, 1423–1431. 10.1007/s10973-012-2652-4. [DOI] [Google Scholar]
Associated Data
This section collects any data citations, data availability statements, or supplementary materials included in this article.