

SUMMARY
Detyrosination of the α-tubulin C-terminal tail is a post-translational modification (PTM) of microtubules that is key for many biological processes [1]. Although detyrosination is the oldest known microtubule PTM [2–7], the carboxypeptidase responsible for this modification, VASH1/2-SVBP, was identified only three years ago [8,9], precluding genetic approaches to prevent detyrosination. Studies examining the cellular functions of detyrosination have therefore relied on a natural product, parthenolide, that is widely believed to block detyrosination of α-tubulin in cells, presumably by inhibiting the activity of the relevant carboxypeptidase(s) [10]. Parthenolide is a sesquiterpene lactone that forms covalent linkages predominantly with exposed thiol groups, e.g., on cysteine residues [11–13]. Using mass spectrometry, we show that parthenolide forms adducts on both cysteine and histidine residues on tubulin itself, in vitro and in cells. Parthenolide causes tubulin protein aggregation and prevents the formation of microtubules. In contrast to epoY, an epoxide inhibitor of VASH1/2-SVBP [9], parthenolide does not block VASH1-SVBP activity in vitro. Lastly, we show that epoY is an efficacious inhibitor of microtubule detyrosination in cells, providing an alternative chemical means to block detyrosination. Collectively, our work supports the notion that parthenolide is a promiscuous inhibitor of many cellular processes, and suggests that its ability to block detyrosination may be an indirect consequence of reducing the polymerization-competent pool of tubulin in cells.
Keywords: Parthenolide, tubulin, detyrosination, vasohibin, epoY
eTOC Blurb
Parthenolide is used to inhibit detyrosination of α-tubulin, a post-translational modification of microtubules. Hotta et al. show that parthenolide does not inhibit the microtubule detyrosinase VASH1, but instead covalently modifies tubulin itself, preventing microtubule assembly. Effects of parthenolide on cells should be interpreted with caution.
RESULTS
Parthenolide (PTL) is a natural product produced by the feverfew plant Tanacetum parthenium that is used as an anti-inflammatory and anti-cancer agent [14]. Owing to a lactone moiety, PTL is a thiol-reactive electrophile that forms a covalent bond with cysteine residues in various protein targets. Among its known cellular targets are IκB kinase β (IKK-β) [15], heat-shock protein Hsp72 [16], Janus kinase JAK2 [17], and focal adhesion kinase 1 (FAK1) [18]. Treatment of cells with PTL blocks the accumulation of detyrosinated tubulin, and PTL has thus been suggested to be a specific inhibitor of cellular detyrosinases [19]. Despite its promiscuous nature, PTL has become commonly used by researchers studying the cellular functions of the α-tubulin tyrosination/detyrosination (Y/ΔY) cycle (e.g., [20–24]). Given the role of detyrosinated microtubules in the physiology of cardiomyocytes, PTL has also been suggested as a therapeutic agent with which to treat cardiomyopathies [25].
PTL reduces the levels of detyrosinated α-tubulin in cells and destabilizes microtubules during cell division and interphase.
We began our work by first analyzing the effect of PTL on the levels of microtubule detyrosination in cells. To accomplish this, we constructed a HeLa knock-in cell line that inducibly expresses the heterodimeric α-tubulin carboxypeptidase vasohibin 1 (VASH1)–small vasohibin binding protein (SVBP) [8,9]. VASH1 was tagged with EGFP and a PA affinity tag [26], and co-expressed with SVBP-FLAG using a bicistronic, doxycycline-inducible vector. Cells over-expressing VASH1-SVBP for 3 days contained high levels of detyrosinated microtubules as assessed by immunoblotting (Figures 1A) and immunofluorescence (Figure S1B), indicating that our construct was functional. A 2-hour treatment of cells that had over-expressed VASH1-SVBP for 3 days with either 20 μM or 100 μM PTL led to a concentration-dependent reduction in the levels of detyrosinated α-tubulin (Figure 1A). This result is consistent with previous work showing that PTL reduces the levels of detyrosinated microtubules in cells [19].
Figure 1. PTL reduces the levels of detyrosinated α-tubulin in cells and destabilizes microtubules during cell division.
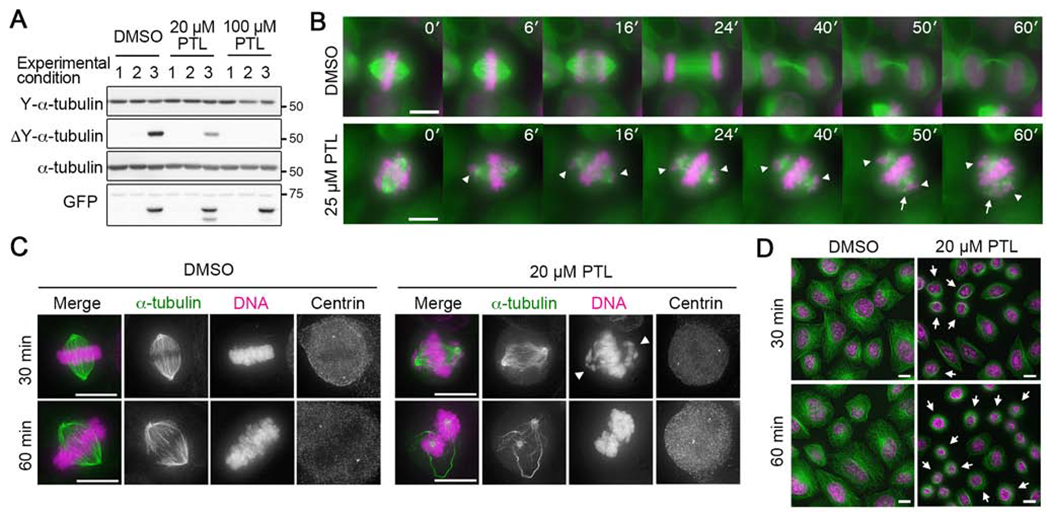
(A) Immunoblot analysis of whole cell lysates prepared from HeLa cells treated with doxycycline to induce expression of GFP-tagged VASH1-SVBP and with PTL to block detyrosination. The GFP immunoblot reports the presence of GFP-VASH1. Lane numbers indicate experimental conditions: #1: 30 minutes of simultaneous PTL and doxycycline treatment; #2: 2 hours of simultaneous PTL and doxycycline treatment; #3; 3 days of doxycycline induction followed by 2 hours of PTL treatment. See also Figure S1.
(B) Time-lapse microscopy of mitotic HeLa cells stably expressing GFP-α-tubulin and H2B-mCherry treated with DMSO or 25 μM PTL. Green, α-tubulin; magenta, histone-H2B. Arrowheads: chromosomes accumulating near spindle poles; arrows: split poles. Time point (min) is indicated in each image. Bars, 10 μm. See also Videos S1 and S2. (C and D) Immunofluorescence staining of HeLa Kyoto cells treated with DMSO or 20 μM PTL. Representative mitotic cells (C) and interphase cells (D) are shown. In merged images, α-tubulin is shown in green and DNA in magenta. Arrowheads indicate chromosomes that accumulated near the poles. Arrows indicate interphase cells that rounded up. Bars, 10 μm. Se Salsa Video S1, S2 and Figure S1
To characterize the acute effect(s) of PTL on mitotic progression, HeLa cells stably expressing GFP-α-tubulin and H2B-mCherry were treated with DMSO or 25 μM PTL and imaged by time-lapse microscopy (Figure 1B; Videos S1 and S2). While DMSO did not affect the progression of cells through cell division, PTL caused chromosomes to accumulate near the spindle poles (Figure 1B, arrowheads), consistent with previous work [20]. In addition, we observed that the density of spindle microtubules decreased over time, and that spindle poles frequently split at later time points (~50 min; Figure 1B, arrows).
To further characterize the microtubule cytoskeleton in PTL-treated cells, we carried out immunofluorescence staining of microtubules in HeLa cells treated with increasing concentrations of PTL. While bipolar spindles were observed in both control (DMSO) and PTL-treated cells, PTL treatment caused disorganization of microtubules and an apparent reduction in polymer levels, suggesting that microtubules were destabilized in drug-treated cells (Figures 1C and S1C), and chromosomes were displaced from the metaphase plate (Figure 1C, arrowheads). These effects were more pronounced at higher concentrations of PTL (Figure S1C). In addition to spindle defects, we also observed that interphase HeLa cells rounded up upon PTL treatment, which was also seen in U2OS cells (Figures 1D and S1D, arrows). PTL induced cell-rounding did not require microtubules, as HeLa cells that had been treated with nocodazole to disassemble microtubules responded similarly to non-drug treated cells (Figure S1E). Cell rounding could be due to inhibition of FAK by PTL, as reported recently [18]. Given the complex phenotypes observed in PTL-treated cells, we decided to reinvestigate the specificity of PTL as an inhibitor of tubulin detyrosination.
PTL does not block VASH1-mediated tubulin detyrosination in vitro
To test whether PTL inhibits the tubulin detyrosination activity of VASH1–SVBP, the tagged VASH1–SVBP complex was immunopurified from our knock-in HeLa cells (Figure 2A) and incubated with purified HeLa tubulin in the presence or absence of PTL. The Y/ΔY state of tubulin was probed by immunoblotting samples prepared at various time points. When HeLa tubulin and VASH1–SVBP were incubated with DMSO, we observed a decrease in tyrosinated α-tubulin and a concomitant increase in detyrosinated α-tubulin over time while total α-tubulin levels remained the same, demonstrating that the immunopurified VASH1–SVBP complex retained detyrosination activity (Figure 2B). Incubation with PTL did not significantly block the detyrosination activity of VASH1–SVBP, but rather resulted in the appearance of a faster-migrating α-tubulin band when blotting with antibodies against tyrosinated or detyrosinated α-tubulin (asterisks in Figures 2B, S2A, and S2B) and a slower-migrating α-tubulin band when blotting with antibodies to total α-tubulin (arrowheads in Figures 2B, S2A, and S2B). These results demonstrate that PTL does not block VASH1–SVBP complex-mediated tubulin detyrosination in vitro and rather results in a mobility shift of α-tubulin in an SDS-PAGE gel.
Figure 2. PTL does not inhibit tubulin detyrosination activity of VASH1-SVBP complex in vitro and forms covalent adducts on α- and β-tubulin both in vitro and in cells.
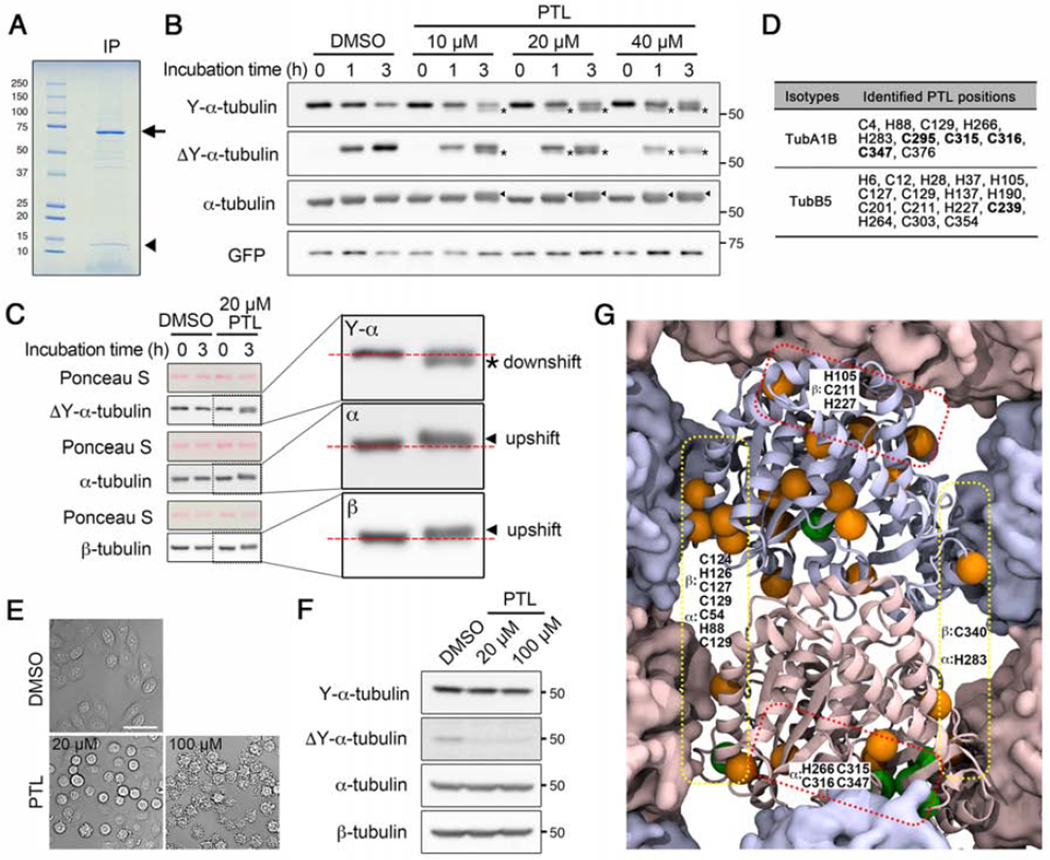
(A) SDS-PAGE analysis of VASH1-SVBP complex immunopurified from HeLa cells co-expressing PA-VASH1-EGFP and SVBP-FLAG. Expected positions of PA-VASH1-EGFP and SVBP-FLAG are shown with an arrow and an arrowhead, respectively.
(B) Immunoblot analysis of in vitro detyrosination assay using purified HeLa tubulin and VASH1-SVBP complex with increasing concentrations of PTL. Mobility shifts were detected on α-tubulin with different α-tubulin antibodies. Asterisks: downshifts detected with Y/ΔY α-tubulin antibodies; arrowheads: upshifts detected with total α-tubulin antibody. See also Figure S2.
(C) Immunoblot analysis of HeLa tubulin incubated with DMSO or 20 μM PTL for 3 hours. Enlarged blots for boxed areas are shown on the right with horizontal dotted red lines indicating band positions at the 0 hour time point. Mobility shifts occurred on both α- and β-tubulin. Asterisk, downshift of α-tubulin; arrowheads, upshifts of α- and β-tubulin. See also Figure S2.
(D) Residues of α- and β-tubulin where PTL adducts were detected in LC-MS/MS analysis of PTL-treated tubulin. Data corresponding to one isotype each for α- and β-tubulins (TubA1B and TubB5) are shown. Residues on which PTL forms adducts in cells are shown in bold. See also Figures S2 and S3, Table S1 and Data S1.
(E) Differential interference contrast (DIC) images of HeLa cells treated with DMSO or PTL for 1 hour.
(F) Immunoblot analysis of lysates prepared from HeLa cells treated with DMSO or PTL.
(G) Three-dimensional structure of tubulin dimer from the microtubule lattice side. The central dimer shows secondary structure while neighboring dimers are shown with a solid surface (pink, α-tubulin; blue, β-tubulin). Residues adducted by PTL are shown as spheres with orange: PTL-modified residues identified only in in vitro work; green: PTL-modified residues identified both in vitro and in cells. PTL-modified residues at the lateral or longitudinal contact points are indicated in yellow or red dotted boxes, respectively.
See also Figure S4.
PTL forms covalent adducts on α,β-tubulin
To determine whether PTL directly causes the mobility shift of α-tubulin, HeLa tubulin was incubated with PTL in the absence of the VASH1–SVBP complex. Immunoblots of the resulting samples demonstrate that both α- and β-tubulin underwent mobility shifts after PTL treatment (Figure 2C). Similar results were obtained with bovine brain tubulin (Figure S2C) and with PTL obtained from different manufacturers (Figure S2D). Shifts in α-tubulin mobility were first observed 45 min after PTL treatment (Figure S2E) and were temperature-dependent; mobility shifts occurred at 37°C, but not when the incubation was carried out on ice (Figure S2F). These results demonstrate that the mobility shifts of α- and β- tubulin are a result of a temperature-dependent chemical reaction on tubulin induced solely by PTL.
Previous work has shown that PTL covalently targets cysteine and histidine residues on several proteins such as Hsp72 [16], FAK1 [18] or ubiquitin-specific peptidase 7 (USP7; [27]). We thus hypothesized that both α- and β-tubulin are chemically modified by PTL. To test this, we analyzed PTL-treated HeLa tubulin by mass spectrometry (LC–MS/MS) and performed a database search for PTL modification of α- and β-tubulin using search parameters similar to those described by Berdan et al., 2019 [5]. We detected mass increases of 248.14 Da on numerous tubulin peptides representing most α- and β-tubulin isotypes, many of which could be confidently localized to specific cysteine and histidine residues (Figures 2D and S3; Table S1; Data S1). This result suggests that the mobility shifts of α- and β-tubulin observed on immunoblots may be related to the formation of covalent PTL adducts on α- and β-tubulin.
We then asked if PTL forms adducts on tubulin in cells. We prepared whole cell lysates from HeLa cells that had been treated with either DMSO or 20 or 100 μM PTL for one hour (Figure 2E) and analyzed them by immunoblot and LC-MS/MS. While mobility shifts in immunoblots of α- and β-tubulin were more difficult to observe (Figure 2F) than with the purified tubulin, the MS analysis clearly revealed that PTL adducts formed in cells on tubulin as well as other proteins (e.g., heat-shock proteins and USP7) (bold entries in Figure 2D and Table S1; Data S1). As we observed approximately 80 different proteins labeled with PTL in cells, this nonspecific adduct formation likely reduced the amount of PTL available to modify tubulin, preventing observable mobility shifts. These results show that PTL forms covalent linkages with many proteins in cells, including multiple cysteine and histidine residues of α- and β-tubulin both in vitro and in cells.
We mapped the residues adducted by PTL onto the three-dimensional structure of the α,β-tubulin dimer, and found that some PTL target residues are localized at the interfaces involved in longitudinal (H266, C315, C316, C347 of α-tubulin; H105, C211 and H227 of β-tubulin) or lateral (C54, H88, C129 and H283 of α-tubulin; C124, H126, C127, C129 and C340 of β-tubulin) interactions between neighboring subunits in the microtubule lattice (Figure 2G). Adduction of tubulin by PTL could impact the structural integrity of tubulin dimers and could also interfere with the interaction between tubulin dimers, thereby potentially affecting microtubule assembly.
PTL-modified tubulin aggregates in vitro
We hypothesized that the microtubule destabilizing effect of PTL in cells (Figures 1 and S1) may be due to the formation of PTL adducts that prevent tubulin from polymerizing or maintaining a polymeric state. To test the impact of PTL on the ability of tubulin to assemble into microtubules, 11 μM HeLa tubulin was supplemented with fluorescently-labeled bovine brain tubulin (10%) and 1 mM GTP and incubated at 37°C to promote microtubule assembly. By fluorescence microscopy, microtubules were observed for HeLa tubulin incubated in the presence of DMSO. In contrast, microtubule assembly was severely attenuated for HeLa tubulin incubated in the presence of PTL (Figure 3A), suggesting that PTL inhibits microtubule assembly. To examine this further, we centrifuged the reactions to pellet polymeric tubulin. Surprisingly, a significant amount of tubulin protein was found in the pellet fraction when the assembly reactions were carried out in the presence of PTL (Figure 3B). Interestingly, when we probed the pellet fraction by immunoblotting, mass-shifted α-tubulin was observed predominantly in the pellet fraction rather than in the supernatant (Figure 3B, asterisk and arrowhead). Since PTL inhibited microtubule assembly (Figure 3A), we hypothesized that the formation of PTL adducts on tubulin caused protein aggregation, e.g., by impacting tubulin structure. We used negative-stain electron microscopy to analyze the reactions, and indeed observed large protein aggregates much more frequently in the PTL-treated tubulin sample than in the DMSO control sample (Figure 3C). In summary, PTL causes tubulin aggregation and blocks microtubule assembly in vitro. This result provides a possible explanation for why microtubules are destabilized in HeLa treated with PTL (Figures 1 and S1).
Figure 3. PTL induces the formation of tubulin aggregates and prevents microtubule assembly in vitro.
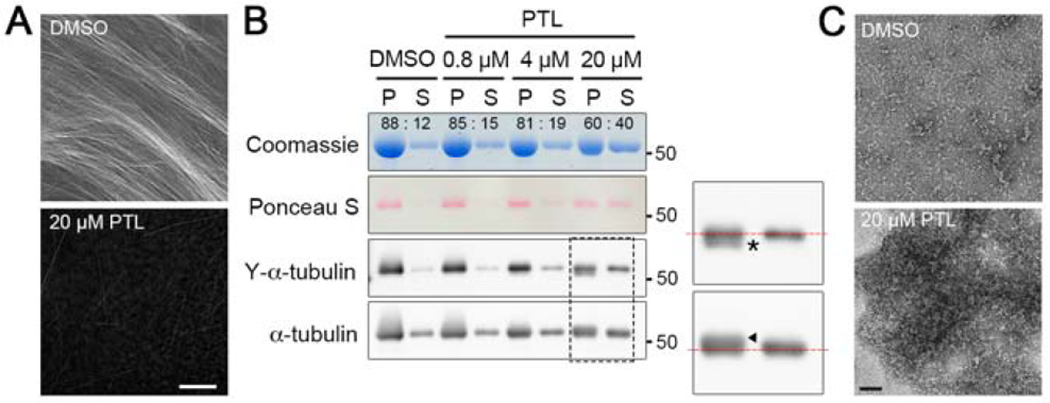
(A) Fluorescence microscopy of microtubules assembled in vitro in the presence or absence of PTL. Bar, 10 μm.
(B) Microtubule sedimentation assay for microtubules assembled in the presence of increasing concentrations of PTL. P, pellet; S, supernatant. Tubulin ratios between P and S in each condition were quantified using imageJ and shown in the Coomassie-stained gel. PTL-modified tubulin was preferentially detected in the pellet in 20 μM PTL-treatment (an asterisk and an arrowhead in enlarged blots).
(C) Negative stain electron microscopy of tubulin incubated with DMSO or 20 μM PTL for one hour at 37°C. Large aggregates were frequently observed in the PTL-treated tubulin sample. Bar, 50 nm.
EpoY is a specific VASH inhibitor both in vitro and in cells
Given the effects of PTL on tubulin aggregation and polymerization, we wanted to test whether epoY, a recently-developed VASH–SVBP inhibitor [13], can replace PTL as a specific inhibitor of tubulin detyrosination. EpoY is proposed to be a suicide inhibitor for VASH-SVBP that works by mimicking the C-terminal tyrosine of α-tubulin. Thus, it is expected to be highly specific to the VASH–SVBP carboxypeptidase. We tested the inhibitory effect of epoY on tubulin detyrosination in our in vitro detyrosination assay using immunopurified VASH1-SVBP complex or carboxypeptidase A (CPA). Detyrosinated tubulin was detected when HeLa tubulin was incubated with VASH1–SVBP complex in the DMSO control condition but its formation was completely blocked in the presence of epoY, even after 1 hour of incubation (Figure 4A). EpoY inhibition was specific for the VASH–SVBP complex, as epoY exhibited no inhibitory effect on the tubulin detyrosination activity of CPA in vitro (Figure 4B). EpoY also blocked tubulin detyrosination activity as measured by both immunoblotting and immunofluorescence in human bone osteosarcoma epithelial (U2OS) cells (Figures 4C and 4D) and human skin melanoma (CHL-1) cells (Figures 4E and 4F). Taken together, we show that epoY specifically blocks tubulin detyrosination mediated by VASH1–SVBP complex both in vitro and in cells.
Figure 4. EpoY is a potent inhibitor of VASH1-SVBP complex both in vitro and in cells.
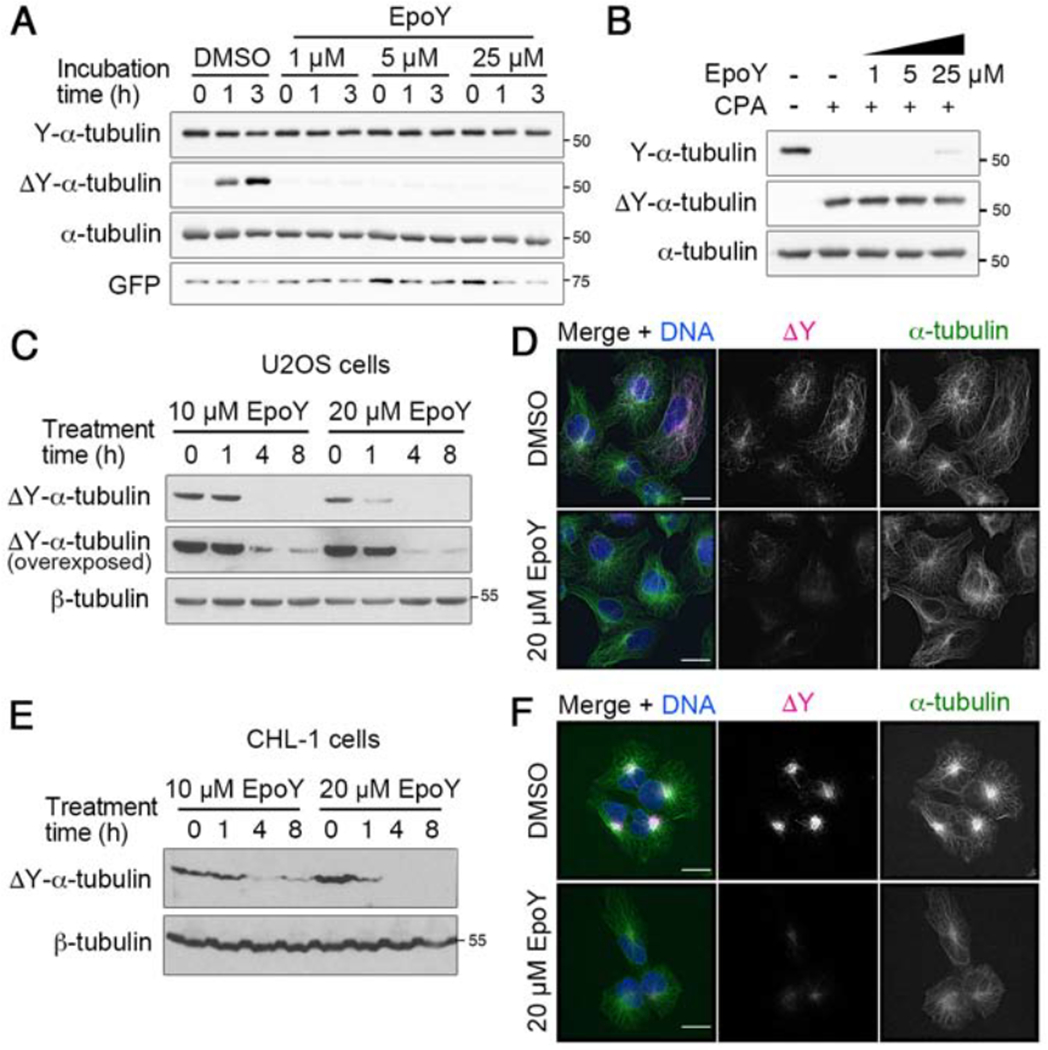
(A, B) Immunoblot analysis of in vitro detyrosination assay using (A) purified VASH1-SVBP complex and purified HeLa tubulin or (B) CPA and HeLa tubulin in the presence of increasing concentrations of epoY.
(C) Immunoblot analysis of lysates prepared from U2OS cells treated with 10 or 20 μM epoY for various times.
(D) Immunofluorescence staining of detyrosinated microtubules in U2OS cells treated with epoY for 4 hours. In merged images, ΔY-α-tubulin is shown in magenta, total α-tubulin in green, and DNA in blue. Bars, 10 μm.
(E) Immunoblot analysis of lysates prepared from CHL-1 cells treated with 10 or 20 μM epoY for various times.
(F) Immunofluorescence staining of detyrosinated microtubules in CHL-1 cells treated with or without 20 μM epoY overnight. In merged images, ΔY-α-tubulin is shown in magenta, total α-tubulin in green, and DNA in blue. Bars, 10 μm.
DISCUSSION
The tubulin Y/ΔY cycle was first described more than four decades ago [2–7], and has since been documented to affect a wide range of cellular processes, including intracellular trafficking and chromosome segregation [20,22,28–38]. In cardiomyocytes, detyrosinated microtubules form a physical link with sarcomeres via the intermediate filament protein desmin, and can thus modulate the stiffness and contractile properties of cardiomyocytes [23]. In this view, microtubule detyrosination will increase resistance to contraction – via strengthening the desmin-sarcomere interaction – and lower heart function, potentially causing diseases of the cardiovascular system [23]. Agents that block tubulin detyrosination thus have therapeutic potential, at least for the treatment of certain cardiomyopathies [25].
In recent years, researchers have adopted PTL as a tubulin carboxypeptidase inhibitor, despite early recognition that PTL is a promiscuous small molecule that likely interacts with any exposed thiol group [11–13]. Indeed, PTL has been found to react with many intracellular targets, including NF-κB, thioredoxin, DNA methyltransferase, and most recently, focal adhesion kinase [14,18]. Our findings are consistent with this notion, and show that both α- and β-tubulin proteins are direct targets of PTL. This result is not surprising, given that the tubulin heterodimer is cysteine-rich (20 cysteines in α,β-tubulin) and therefore reacts well with sulfhydryl-targeting reagents [39]. Our MS analysis demonstrated that histidine residues of α,β-tubulin were also covalently modified with PTL. This is consistent with previous work showing that PTL can react with histidine and lysine residues [16], and that tubulin is covalently modified by diethylpyrocarbonate (DEPC), a histidyl-targeting compound [40,41]. Interestingly, N-ethymaleimide (NEM), a second sulfhydryl-reacting compound, and DEPC did not block microtubule detyrosination (Figure S4A), suggesting that PTL, NEM, and DEPC covalently modify non-overlapping sets of proteins in cells. We note that brief (two-hour) treatment of cells with 100 μM NEM caused widespread microtubule disassembly, and a reduction in tubulin protein levels (Figures S4A and S4B). In addition, 10 mM DEPC reduced the fluorescence of GFP and mCherry; DNA and microtubules were readily visualized in fixed specimens that were immunostained, but GFP-tubulin and H2B-mCherry were nearly undetectable in live cells (Figure S4B).
PTL adducts were identified on many tubulin isotypes from our purified tubulin preparations, suggesting that covalent modification is not isotype-specific. In vitro, adduction of tubulin by PTL causes mobility shifts during gel electrophoresis, tubulin aggregation, and blocks microtubule assembly. While slower migration of α- and β-tubulin should reflect the PTL adduction, it is unclear what causes the faster migration of α-tubulin. PTL adducts may lower net positive charge, alter SDS binding, or increase globularity/compactness of tubulin to increase mobility. Blockage of microtubule assembly may be due to a reduction in the assembly-competent pool of tubulin, or adducts that form on the surface of tubulin dimer that interfere with tubulin-tubulin contact during microtubule polymerization. Because we detect PTL adducts on tubulin in cells, we speculate that the loss of tubulin polymer in cells stems from tubulin adduction by PTL, although other mechanisms (e.g., adduction of key microtubule regulators) are certainly plausible.
PTL reduces the levels of detyrosinated α-tubulin in cells [19], and this effect has been interpreted to mean that PTL inhibits the activity of a tubulin carboxypeptidase. Currently, Vasohibin (VASH), a member of the transglutaminase-like cysteine protease superfamily, is the only known bona fide tubulin carboxypeptidase, although it is likely that others exist given that human embryonic kidney (HEK) 293T cells engineered to lack VASH1 and VASH2 proteins contain detectable levels of detyrosinated α-tubulin [8]. Recent structural work demonstrated that PTL forms a covalent linkage with VASH1-C169 [42] which is a critical residue of VASH1’s catalytic triad [43], providing an attractive model for how PTL inhibits microtubule detyrosination in cells. In our work, however, we show that PTL does not inhibit the tubulin detyrosination activity of immunopurified VASH1–SVBP complex in vitro. This is in contrast to the effect of epoY, which acts as a potent inhibitor of VASH1-SVBP [9,42] (Figure 4). Given that PTL causes tubulin aggregation and a loss of polymer, we suggest that PTL reduces the levels of detyrosinated α-tubulin in cells through an indirect mechanism rather than blocking the activity of a tubulin carboxypeptidase.
In contrast to PTL, we show that epoY efficiently blocks VASH–SVBP activity but does not inhibit CPA in vitro, supporting the notion that epoY is a specific VASH–SVBP inhibitor [9,42]. We further demonstrate that epoY reduces tubulin detyrosination in U20S and CHL-1 cells, suggesting that this small molecule is preferable to PTL when studying tubulin detyrosination in cells. However, we also observed that epoY did not completely block tubulin detyrosination in U20S and CHL-1 cells (Figures 4C–F), suggesting that an as-of-yet unknown tubulin carboxypeptidase cooperates with VASH-SVBP.
In conclusion, we show that PTL does not block the tubulin detyrosination activity of VASH1–SVBP and present evidence that PTL lowers the level of detyrosinated tubulin in cells indirectly, through direct adduction of tubulin. Our work is consistent with the idea that PTL is highly promiscuous, limiting its value for studies of the microtubule cytoskeleton and clinical applications. EpoY, in contrast, is a useful inhibitor of vasohibins, and is likely to be useful in efforts to identify additional tubulin carboxypeptidases that detyrosinate α-tubulin in animal cells.
STAR Methods
RESOURCE AVAILABILITY
LEAD CONTACT
Further information and requests for resources and reagents should be directed to and will be fulfilled by the Lead Contact, Ryoma Ohi (oryoma@umich.edu).
MATERIALS AVAILABILITY
Plasmids, cell lines, and an antibody generated in this study are available upon request.
DATA AND CODE AVAILABILITY
The mass spectrometry proteomics data generated in this study have been deposited in the ProteomeXchange Consortium via the PRIDE partner repository with the dataset identifier PXD020113.
EXPERIMENTAL MODEL AND SUBJECT DETAILS
E.coli strain XL1-Blue (Agilent, Cat# 200236) was used throughout the molecular cloning. E.coli cells were cultured in standard LB medium supplemented with appropriate antibiotics at 37°C. Wild-type HeLa Kyoto, HeLa stably expressing GFP- α-tubulin and H2B-mCherry, CHL-1 and U2OS cells were cultured in DMEM medium containing 10% fetal bovine serum and antibiotics (penicillin and streptomycin). Knock-in cells that inducibly express VASH1-SVBP were cultured in DMEM containing 10% fetal bovine serum, and antibiotics, and 1 μg/ml puromycin. Cells were maintained in the presence of 5% CO2 at 37°C. Cells were not authenticated and are negative for mycoplasma contamination.
METHOD DETAILS
Chemicals
PTL was purchased from Sigma-Aldrich (Cat# P0667), Cayman Chemical (Cat# 70080) or Enzo Life Sciences (Cat# BML-T113-0050). Nocodazole (Cat# M1404), NEM Cat# 04259) and DEPC (Cat# 40718) were purchased from Sigma-Aldrich. EpoY was synthesized by the Vahlteich Medicinal Chemistry Core at University of Michigan. PTL, nocodazole, NEM and epoY were dissolved in DMSO and stored at −20°C.
Molecular Biology
To co-express VASH1 and SVBP, two bi-cistronic vectors, pmEGFP-N1-VASH1-IRES-SVBP and pEM791-VASH1-IRES-SVBP where the internal ribosome entry site (IRES) of Encephalomyocarditis virus is placed between PA-VASH1-GFP and SVBP-1x FLAG, were generated as follows: a fragment of PA-VASH1 that consists of a PA-tag (GVAMPGAEDDVV) and a flexible linker (3xGGGGS) inserted at the N-terminus of VASH1 was PCR amplified by PrimeSTAR max DNA polymerase (Takara Bio., Cat# R045B) using VASH1 cDNA (Horizon Discovery, Clone ID 5170122) as template. IRES-SVBP-6x glycine linker-1x FLAG was synthesized by gBlocks (Integrated DNA Technologies, Inc.). With Gibson assembly, either one or both of these fragments was inserted upstream or downstream, respectively, of mEGFP of pmEGFP-N1 vector, a modified version of pEGFP-N1 vector where EGFP was converted to monomeric EGFP (A207K mutation). To test the functionality of the obtained pmEGFP-N1-VASH1, pmEGFP-N1-IRES-SVBP and pmEGFP-N1-VASH1-IRES-SVBP, these plasmids were transfected in HeLa Kyoto cells using lipofectamine 2000 (Invitrogen, Catalog # 11668030) followed by whole cell lysate preparation and immunoblot analysis (Figure S1A). Finally, a fragment that covers two ORFs (PA-VASH1-mEGFP-IRES-SVBP-FLAG) was PCR amplified from pmEGFP-N1-VASH1-IRES-SVBP and cloned into pEM791 vector between AgeI and BsrGI sites by Gibson assembly. The resulting pEM791-VASH1-IRES-SVBP was used to establish a knock-in HeLa cell line co-expressing PA-VASH1-GFP and SVBP-FLAG in a doxycycline inducible manner using recombination mediated cassette exchange [44,45].
Tubulin detyrosination in cells
Tubulin detyrosination was induced in VASH1-SVBP knock-in HeLa cells by culturing cells in the presence of 2 μg/ml doxycycline for 30 minutes, 2 hours or 3 days. DMSO (vehicle control; 1%), PTL (20 or 100 μM), NEM (30 or 100 μM) or DEPC (1 or 10 mM) were added to the culture medium at the same time as the doxycycline-induction except for the 3-day induction experiment where the drug treatments were performed for the last 2 hours of VASH-SVBP over-expression.
Live Cell Imaging
HeLa cells stably expressing GFP-α-tubulin and H2B-mCherry were plated onto glass coverslip dishes coated with poly-L-lysine (MatTek) 24 hours prior to imaging. Cells were imaged in L-15 medium containing 10% fetal bovine serum, penicillin, streptomycin, and 7 mM K-HEPES, pH=7.7. Administration of PTL to mitotic cells being visualized was accomplished by acute addition of 1 ml of L-15 media containing 50 μM PTL to cells bathed in 1 ml of drug-free medium, yielding a final PTL concentration of 25 μM. For nocodazole treatment, cells were cultured in the presence of 3.3 μM nocodazole at 4°C for 1 hour with or without additional treatment with 20 μM PTL in nocodazole-containing medium at 37°C for 1 hour. For NEM and DEPC treatments, cells were cultured in the presence of 30 or 100 μM NEM or 1 or 10 mM DEPC for 2 hours. Z-stacks containing 6 focal planes with 2 μm spacing were acquired at 2 minute intervals over a total period of 60 minutes. Images were captured at 37°C using a DeltaVision Core system equipped with an 60X objective, a 1.59X magnifier (for mitotic cells), a Photometries Prime 95B sCMOS camera, and an environmental chamber (GE Healthcare). Differential interference contrast images were obtained with a 20X objective without magnifier.
Immunofluorescence staining
Wild-type and VASH1–SVBP knock-in HeLa, U20S and CHL-1 cells were seeded on coverslips 24 hours prior to staining. Cells were treated with DMSO (vehicle control; 0.2-1%), PTL (20 μM; 30–60 minutes), epoY (20 μM; 4 hours-overnight), NEM (30 or 100 μM; 2 hours) or DEPC (1 or 10 mM; 2 hours). After rinsing with DPBS, cells were fixed with ice-cold methanol for 10 min at −20°C. Blocking was done with 2% BSA in TBS (0.2 M Tris Base, 137 mM NaCl, pH 7.6) supplemented with 0.1% Triton X-100. Antibodies used are: anti-centrin (1 : 1,700) [46], anti-α-tubulin DM1 αconjugated with FITC (Sigma-Aldrich, Cat# F2168, 1:500), anti-detyrosinated α-tubulin (abcam [Figure S1B] or a custom antibody generated by the R. Ohi lab in collaboration with Covance [Figures 4D and 4F]) and goat anti-rabbit Alexa Fluor 594 (Invitrogen, Cat# A11012, 1:2,000). All antibodies were diluted in the blocking solution. DNA was counterstained with 5 μg/ml Hoechst. Coverslips were mounted with ProLong Diamond (Thermo Fisher). Images were obtained with a DeltaVision microscope equipped with an Olympus Plan Apo N 60x/1.42 oil immersion lens. Images were deconvolved and single optical sections were presented.
Tubulin purification
Tubulin was purified from HeLa cells using TOG affinity column chromatography [47–49]. Cells grown on 10 150 mm dishes (~80% confluent) were harvested by trypsinization, rinsed in DPBS twice and lysed in BRB80 (80 mM PIPES, 1 mM EGTA, 1 mM MgCl2 pH 6.8) supplemented with 1 mM DTT, protease inhibitor cocktail (complete mini EDTA free, Roche, Cat# 04693159001), 0.2 mM PMSF and 1% each phosphatase inhibitors (Sigma-Aldrich, Cat# P5726 and P0044). After sonication (10 sec x3), lysate was cleared by centrifugation (15,000 x g, 15 min, 4°C) followed by a filtration with 0.45 μm syringe filter (GE Healthcare, Cat# 6876-2504). Cleared lysate was loaded onto a TOG column in which approximately 15 mg of bacterially expressed GST-TOG1/2 protein was immobilized in a 1-ml of NHS-activated Sepharose 4 Fast Flow resin bed (GE Healthcare, Cat# 17090601). After washing, tubulin was eluted with BRB80 supplemented with 0.5 M ammonium sulfate and 10 μM GTP. The eluate was desalted with PD-10 desalting column (GE Healthcare, Cat# 17085101) and concentrated with an Amicon Ultra-4 10K cutoff centrifugal filter unit.
Tubulin was also purified from bovine brains by two cycles of assembly-disassembly in a high molarity PIPES buffer as described [50]. The concentrations of tubulins were determined by A280 measurement using NanoDrop (Thermo Fisher) with an extinction coefficient of 115,000 M−1cm−1. Purified tubulin was stored at −80°C until use. Prior to any in vitro experiments described in this study, tubulin was thawed and precleared by ultracentrifugation at 100,000 x g for 10 min at 4°C to remove denatured proteins.
Immunopurification of VASH1-SVBP complex
VASH1–SVBP complex was immunopurified using the PA-tag purification system [26]. VASH1–SVBP knock-in HeLa cells were cultured on a 150 mm dish in the presence of 2 μg/ml doxycycline for 3 to 4 days. Cells were harvested by trypsinization and rinsed with DPBS twice. The cell pellet was resuspended in 400 μl of lysis buffer (100 mM Tris, 150 mM NaCl, 1 mM EDTA, 1 mM EGTA, 0.1% triton X-100, protease inhibitor cocktail [Complete mini EDTA free; Roche], 0.2 mM PMSF, 1% each phosphatase inhibitors [Sigma-Aldrich], pH 8.0), sonicated and centrifuged at 15,000 x g for 15 min at 4°C. Lysate was mixed with pre-equilibrated 25 μl PA-tag resin (FUJIFILM Wako Pure Chemical, Cat# 012-25841) and gently agitated for 2 hours at 4°C. Beads were washed with 500 μl of wash buffer (100 mM Tris, 150 mM NaCl, 1 mM EDTA, 1 mM EGTA, phosphatase inhibitors, pH 8.0) five times. VASH1–SVBP complex was eluted from the beads with 100 μl of elution buffer (10 mM Tris pH 7.5, 150 mM NaCl, 0.2 mg/ml PA-tag peptide [FUJIFILM Wako Pure Chemical, Cat# 167-25501]) following gentle agitation for 30 min at 4°C. Protein concentration was determined by measuring A280 with an extinction coefficient of 60,530 M−1cm−1 which was calculated from the theoretical molecular weight of the complex assuming that VASH1 and SVBP form a 1:1 complex [42]. Purified VASH1–SVBP complex was used immediately in the in vitro tubulin detyrosination assay.
In vitro tubulin detyrosination assay
Purified HeLa tubulin (1 μM) and VASH1–SVBP complex (1 μM) was mixed in a total of 30 μl of BRB80 with 1% DMSO, PTL (10, 20 or 40 μM) or epoY (1, 5 or 25 μM) and incubated at 37°C for 3 hours. Reactions were stopped by adding SDS-PAGE sample buffer and boiling for 3 min. Samples were kept at −20°C until SDS-PAGE was carried out. For the CPA treatment, VASH1–SVBP was replaced with 10 μg/ml of CPA (Sigma-Aldrich, Cat# C9268) and the incubation was performed on ice for 30 min.
Iμl of elution buffer (10 mM Tris pH 7.5, 150 mM NaCl, 0.2 mg/ml PA-tag peptideubulin microtubules
For PTL treatment of tubulin, 1 μM HeLa tubulin and 1% DMSO or 20 μM PTL were mixed in BRB80 and incubated at 37°C. Samples were prepared at 0, 1 and 3 h forSDS-PAGE as described above. For negative stain electron microscopy, 1 μM of bovine brain tubulin was incubated with 1% DMSO or 20 μM PTL in BRB80 for 60 min at 37°C. Formvar, carbon-coated copper grids were glow discharged with a PELCO easiGlow™ for 30 seconds at 5 mA. Tubulin samples were diluted in BRB80 buffer at a 1:5 dilution before application to the carbon face of the grid for one minute. The grid was then incubated, face down, in ~30 uL of 0.075% uranyl formate solution three times for 15 seconds each time. The grid was then wicked with filter paper and allowed to dry. Grids were visualized at 14,000x & 22,000x magnification using a Morgagni (FEI), transmission electron microscope and imaged with a CCD camera (2.1 Å/pixel @ 22,000x).
For PTL treatment of microtubules, microtubules were assembled from 10 μM HeLa tubulin and 1 μM Alexa 594-labeled bovine brain tubulin in BRB80, 1 mM GTP and 1% DMSO (vehicle control) or 20 μM PTL. After incubation for 30–60 min at 37°C, samples were mounted and immediately observed with a DeltaVision microscope. Raw images at single focal planes were processed with ImageJ. For the sedimentation assay, 10 μM HeLa tubulin was incubated in BRB80, 1 mM GTP and 1% DMSO or various concentrations of PTL (0.8, 4 or 20 μM) for 45 min at 37°C and pelleted by ultracentrifugation at 100,000 x g for 30 min at 37°C. SDS-PAGE sample buffer was added to the supernatant and pellet. For a Coomassie-stained gel, total tubulin amount in the pellet and supernatant was 3 μg for each condition. For gels for immunoblot analysis, total tubulin amount (pellet + supernatant) was reduced to 200 ng.
Gel electrophoresis and immunoblot analysis
Cell lysates were prepared as previously described [51]. SDS-PAGE was performed with 8 or 10% acrylamide gels except for a precast gradient gel (4–20%) used in Figure 2A (Thermo Fisher, Cat# XP04205BOX). Protein bands were transferred onto nitrocellulose membranes and stained with ponceau S. After blocking with 3–5% skim milk in PBS or TBS supplemented with 0.05% Tween-20 (PBST or TBST) for 30–60 min at temperature, membranes were incubated with primary antibodies overnight at 4°C: anti-tyrosinated α-tubulin (rat, YL1/2, Accurate Chemical and Scientific, Cat# YSRTMCA77G; 1:2,000); anti-detyrosinated α-tubulin (rabbit, abcam, Cat# ab48389, 1:500; or alternatively, generated by the R. Ohi lab in collaboration with Covance, rabbit, 1:2,000); anti-α-tubulin (mouse, clone DM1α, Novus Biological, Cat# NB100-690, 1:1,000); anti-β-tubulin (mouse, clone KMX-1, Millipore Sigma, Cat# MAB3408, 1:1,000 [Figures 2 and S2] or mouse, clone E7, DSHB, [Figure 4]), anti-GFP antibodies (rabbit, Invitrogen, Cat# A6455, 1:2,000). After washing with PBST or TBST, membranes were incubated with secondary antibodies: Goat anti-rat Alexa 680 (Invitrogen, Cat# A-21096); Goat anti-mouse Alexa 700 (Invitrogen, Cat# A-21036); Goat anti-rabbit Alexa 700 (Invitrogen, Cat# A-21038); Goat anti-mouse DyLight 800 (Invitrogen, Cat# SA5-10176); Goat anti-rabbit IRDye 800CW (LI-COR, Cat# 926-32211); Goat anti-rabbit IgG (whole molecule)-peroxidase (Sigma-Aldrich, Cat# A4914); Goat anti-mouse IgG (whole molecule)-peroxidase (Sigma-Aldrich, Cat# A4416); each at 1:10,000. Fluorescent signals were detected with a fluorescent detector (Azure C600, Azure Biosystems). For the HRP secondary antibodies, Pierce ECL was used and signal was detected with film.
Mass Spectrometry
For MS analysis of tubulin, 1 μM of purified HeLa tubulin was incubated with 1% DMSO or 20 μM in BRB80 for 3 h at 37°C. For MS analysis of lysates, HeLa Kyoto cells were treated with DMSO, 20 or 100 μM PTL for 1 h and lysates were prepared using EasyPep Mini MS sample Prep Kit (Thermo Fisher, Cat# A40006). Samples were reduced by adding 50 μl of 10 mM DTT and incubating at 45°C for 30 min, then alkylated with 65 Mm 2-chloroacetamide for 30 min at room temperature in the dark. Samples were diluted to a final concentration of ~1 M urea, then 1 ug sequencing-grade modified trypsin was added for overnight digestion 37° C. Digestion was stopped by acidification and peptides were desalted using SepPak C18 cartridges according to the manufacturer’s protocol (Waters). Samples were completely dried using vacufuge.
Peptides were resuspended in 9 μl of 0.1% formic acid/2% acetonitrile solution, and 2 μl of this solution was injected onto a nano-capillary reverse phase column (Acclaim PepMap C18, 2 micron, 50 cm, Thermo Scientific) using a 0.1% formic acid in acetonitrile gradient at 300 nl/min over 180 min. Eluent was introduced into a Q Exactive HF mass spectrometer (Thermo Scientific, San Jose CA) using an EasySpray source. MS1 scans were acquired at 60K resolution (AGC target=3x10⁶; max IT=50 ms). Data-dependent collision induced dissociation MS/MS spectra were acquired on the 20 most abundant ions following each MS1 scan (NCE ~28%; AGC target 1x10⁵; max IT 45 ms).
Spectral files were searched with MSFragger [52] [53](v2.4) and filtered with Philosopher [54] (v3.2.3) through FragPipe (v12.2, https://fragpipe.nesvilab.org/) against a protein sequence database of reviewed Human proteins from UniProt accessed 01/22/2020 and 115 common contaminants, using reversed sequences as decoys. Precursor and fragment tolerances were both set to 20 ppm, isotope error to 0/1, and mass calibration and parameter optimization were enabled. As initial settings, the top 150 most intense peaks in each spectrum were used, and a minimum of 15 peaks was required to search a spectrum. Tryptic cleavage specificity was specified with two missed cleavages allowed, along with variable PTL modification (248.14124 Da) on cysteine and histidine, variable cysteine carbamidomethylation, variable methionine oxidation, and variable protein N-terminal acetylation. Peptide length and mass ranges were set to 7-50 residues and 500-5000 Da, respectively. Sequential FDR filtering was performed with Philosopher, resulting in PSM (peptide-spectrum match)-level FDRs below 0.09% for all samples. PDV 1.6.0 [55] was used to view identified MS/MS spectra.
Sites of PTL labeling were required to have at least two supporting PSMs with hyperscore greater than 20 and probability above 0.75. Raw LC/MS data and result tables are available through ProteomeXchange [56] with identifier PXD020113.
Quantitative and Statistical Analysis
Peptide identification probabilities from LC-MS/MS analyses were performed using previously described methods [57].
Supplementary Material
Data S1. PTL-modified sites in purified tubulin and lysate samples identified by LC-MS/MS, related to Figure 2.
Video S1. HeLa cell stably expressing GFP-α-tubulin (green) and H2B-mCherry (magenta) treated with DMSO, related to Figure 1. Shown are maximum intensity projections of 6 images taken at 2 μm intervals. Z-stacks were acquired every 2 min for a total period of 1 hour.
Video S2. HeLa cell stably expressing GFP-α-tubulin (green) and H2B-mCherry (magenta) treated with 25 μμμμM PTL, related to Figure 1. Shown are maximum intensity projections of 6 images taken at 2 μm intervals. Z-stacks were acquired every 2 min for a total period of 1 hour.
KEY RESOURCES TABLE
| REAGENT or RESOURCE | SOURCE | IDENTIFIER |
| Antibodies | ||
| Mouse monoclonal anti-α-tubulin, DM1α conjugated with FITC | Sigma-Aldrich | Cat# F2168 |
| Mouse monoclonal anti-α-tubulin, DM1α | Novus Biological | Cat# NB100-690 |
| Rat monoclonal anti-tyrosinated α-tubulin, YL1/2 | Accurate Chemical and Scientific | Cat# YSRTMCA77G |
| Rabbit polyclonal anti-detyrosinated α-tubulin | abcam | Cat# ab48389 |
| Rabbit polyclonal anti-detyrosinated α-tubulin | This study | N/A |
| Mouse monoclonal anti-β-tubulin, KMX-1 | Millipore Sigma | Cat# MAB3408 |
| Mouse monoclonal anti-β-tubulin, E7 | Developmental Studies Hybridoma Bank (DSHB) | Cat# E7 |
| Rabbit polyclonal anti-centrin | [46] | N/A |
| Rabbit polyclonal anti-GFP | Invitrogen | Cat# A6455 |
| Goat anti-rabbit Alexa 594 | Invitrogen | Cat# A11012 |
| Goat anti-rat Alexa 680 | Invitrogen | Cat# A-21096 |
| Goat anti-mouse Alexa 700 | Invitrogen | Cat# A-21036 |
| Goat anti-rabbit Alexa 700 | Invitrogen | Cat# A-21038 |
| Goat anti-mouse DyLight 800 | Invitrogen | Cat# SA5-10176 |
| Goat anti-rabbit IRDye 800CW | LI-COR | Cat# 926-32211 |
| Goat anti-rabbit IgG (whole molecule)-peroxidase | Sigma-Aldrich | Cat# A4914 |
| Goat anti-mouse IgG (whole molecule)-peroxidase | Sigma-Aldrich | Cat# A4416 |
| Bacterial and Virus Strains | ||
| XL1-Blue | Agilent | Cat# 200236 |
| Chemicals, Peptides, and Recombinant Proteins | ||
| Parthenolide, ≥98% | Sigma-Aldrich | Cat# P0667 |
| Parthenolide, ≥98% | Cayman Chemical | Cat# 70080 |
| Parthenolide, ≥97% | Enzo Life Sciences | Cat# BML-T113-0050 |
| EpoY | Vahlteich Medicinal Chemistry Core at University of Michigan | N/A |
| N-Ethylmaleimide, ≥99.0% | Sigma-Aldrich | Cat# 04259 |
| Diethyl pyrocarbonate, 99% | Sigma-Aldrich | Cat# 40718 |
| HeLa tubulin | This study | N/A |
| Bovine brain tubulin | This study | N/A |
| Alexa 594-labeled bovine brain tubulin | This study | N/A |
| GST-TOG1/2 protein | [47], [48], [49] | N/A |
| NHS-activated Sepharose 4 Fast Flow resin | GE Healthcare | Cat# 17090601 |
| PA-VASH1-EGFP | This study | N/A |
| SVBP-1xFLAG | This study | N/A |
| DMEM, high glucose | Thermo Fisher Scientific | Cat# 11965118 |
| Fetal bovine serum | Atlanta Biologicals | Cat# S11150 |
| Penicillin and streptomycin | Thermo Fisher Scientific | Cat# 15140122 |
| Puromycin | Sigma-Aldrich | Cat# P8833 |
| Doxycycline hydrochloride | Thermo Fisher Scientific | Cat# BP26531 |
| L-15 medium | Thermo Fisher Scientific | Cat# 21083027 |
| HEPES | Sigma-Aldrich | Cat# H3375 |
| DMSO | Sigma-Aldrich | Cat# D8418 |
| DPBS | Thermo Fisher Scientific | Cat# 14190144 |
| Methanol | Sigma-Aldrich | Cat# 179337 |
| BSA | Sigma-Aldrich | Cat# A7906 |
| Tris base | Sigma-Aldrich | Cat# T1503 |
| Triton X-100 | Sigma-Aldrich | Cat# X100 |
| Hoechst 33342 | Sigma-Aldrich | Cat# B2261 |
| ProLong™ Diamond | Thermo Fisher Scientific | Cat# P36961 |
| PIPES | Sigma-Aldrich | Cat# P6757 |
| EGTA | Sigma-Aldrich | Cat# E3889 |
| MgCl2 | Sigma-Aldrich | Cat# M2393 |
| DTT | Sigma-Aldrich | Cat# D9779 |
| cOmplete™, EDTA-free Protease Inhibitor Cocktail | Roche | Cat# 04693159001 |
| PMSF | Sigma-Aldrich | Cat# 78830 |
| Phosphatase Inhibitor Cocktail 2 | Sigma-Aldrich | Cat# P5726 |
| Phosphatase Inhibitor Cocktail 3 | Sigma-Aldrich | Cat# P0044 |
| (NH4)2SO4 | Sigma-Aldrich | Cat# A4915 |
| GTP | Sigma-Aldrich | Cat# G8877 |
| PrimeSTAR max DNA polymerase | Takara Bio. | Cat# R045B |
| Lipofectamine 2000 | Invitrogen | Cat# 11668030 |
| NaCl | Sigma-Aldrich | Cat# S3014 |
| EDTA | Sigma-Aldrich | Cat# E6758 |
| PA-tag resin | FUJIFILM Wako Pure Chemical | Cat# 012-25841 |
| PA-tag peptide | FUJIFILM Wako Pure Chemical | Cat# 167-25501 |
| Carboxypeptidase A from bovine pancreas | Sigma-Aldrich | Cat# C9268 |
| Uranyl formate | Thermo Fisher Scientific | Cat# NC0782276 |
| Ponceau S | Sigma-Aldrich | Cat# P7170 |
| 2-chloroacetamide | Thermo Fisher Scientific | Cat# A15238 |
| Urea | GE Healthcare | Cat# 17-1319-01 |
| Sequencing-grade modified Trypsin/Lys-C mix | Promega | Cat# V5073 |
| Formic acid | ProteoChem | Cat# LC6201 |
| Acetonitrile | Fisher Scientific | Cat# A955 |
| Critical Commercial Assays | ||
| PD-10 desalting columns | GE Healthcare | Cat# 17085101 |
| Amicon Ultra-4 10K | Merck Millipore | Cat# UFC801024D |
| Glass coverslip dishes coated with poly-L-lysine | MatTek | Cat# P35GC- 1.5-14-C |
| EasyPep Mini MS sample Prep Kit | Thermo Fisher Scientific | Cat# A40006 |
| Deposited Data | ||
| Raw LC/MS data and search result tables | ProteomeXchange repository | PXD020113 |
| Experimental Models: Cell Lines | ||
| HeLa Kyoto | Shuh Narumiya | RRID: CVCL_19 22 |
| HeLa stably expressing GFP-α-tubulin and H2B-mCherry | Dan Gerlich | RRID: CVCL_L8 02 |
| Knock-in HeLa Kyoto cell line co-expressing PA-VASH1- GFP and SVBP-FLAG | This study | N/A |
| CHL-1 | Thijn Brummelkamp | RRID: CVCL_1122 |
| U2OS | Susan R. Wente | RRID: CVCL_0042 |
| Oligonucleotides | ||
| Forward primer for IRES-SVBP-FLAG gcatggacgagctgtacaagTAACCCCCCCCTAACGTTACTG G | This study | N/A |
| Reverse primer for Forward primer for IRES-SVBP-FLAG gatctagagtcgcggccgctTCACTTGTCGTCATCGTCCTTGT AG | This study | N/A |
| Forward primer for pmEGFP-N1 AGCGGCCGCGACTCTAGATCATAATC | This study | N/A |
| Reverse primer for pmEGFP-N1 CTTGTACAGCTCGTCCATGCCGAGAG | This study | N/A |
| Forward primer for PA-VASH1-GGGGSx3 linker gggatccaccggtcgccaccATGGGCGTTGCCATGCCAGGTG C | This study | N/A |
| Reverse primer for PA-VASH1-GGGGSx3 linker tcctcgcccttgctcaccatCGATCCGCCACCGCCAGAGCCAC | This study | N/A |
| Forward primer for pmEGFP-N1-IRES-SVBP ATGGTGAGCAAGGGCGAGGAGCTG | This study | N/A |
| Reverse primer for pmEGFP-N1-IRES-SVBP GGTGGCGACCGGTGGATCCCGGG | This study | N/A |
| Forward primer for PA-VASH1-EGFP-IRES-SVBP (pEM791 cloning) ccgcgggcccgggatccaccggtATGGGCGTTGCCATGCCAG Gtg | This study | N/A |
| Reverse primer for PA-VASH1-EGFP-IRES-SVBP (pEM791 cloning) gcacctgagtgtttacttgtacaTCACTTGTCGTCATCGTCCTTG TAGTC | This study | N/A |
| Recombinant DNA | ||
| VASH1 cDNA | Horizon Discovery | 5170122 |
| pEGFP-N1 | Clontech | N/A |
| pmEGFP-N1 | This study | N/A |
| pEM791 | Eugene Makeyev, [44] | N/A |
| pmEGFP-N1-VASH1-IRES-SVBP | This study | N/A |
| pEM791-VASH1-IRES-SVBP | This study | N/A |
| Software and Algorithms | ||
| ImageJ, version 2.1.0/1.53c | NIH image, https://imagej.nih.gov/ij/ |
RRID: SCR_003070 |
| MSFragger, version 2.4 |
http://msfragger.nesvilab.org/ [52], [53] |
N/A |
| Philosopher, version 3.2.3 |
https://philosopher.nesvilab.org/ [54] |
N/A |
| FragPipe, version 12.2 | https://fragpipe.nesvilab.org/ | N/A |
| PDV, version 1.6.0 |
http://pdv.zhang-lab.org/ [55] |
N/A |
Highlights.
Parthenolide destabilizes microtubules during mitosis
Parthenolide forms covalent linkages with histidine and cysteine residues in α,β tubulin.
Parthenolide causes tubulin to aggregate and blocks microtubule assembly in vitro
EpoY, but not parthenolide, blocks VASH1-SVBP activity in vitro
ACKNOWLEDGEMENTS
The authors thank Dr. Venkatesha Basrur and Kevin Conlon of the Proteomics Resource Facility at the University of Michigan Medical School for providing technical expertise in mass spectrometry. E.L.E. was supported by the Cellular and Molecular Biology training grant NIH T32 GM007315. Work in the laboratories of K.J.V. and A.I.N. are supported by NIH grants R35 GM131744 and R01 GM094231, respectively. Work in the laboratory of R.O. was supported by start-up funds at the University of Michigan, a Research Stimulus grant awarded to R.O., D.S. and A.I.N. by the University of Michigan, and an Accelerating Synergy grant to R.O., A.I.N and K.V funded by UL1TR002240 awarded to the Michigan Institute for Clinical & Health Research (MICHR).
Footnotes
Publisher's Disclaimer: This is a PDF file of an unedited manuscript that has been accepted for publication. As a service to our customers we are providing this early version of the manuscript. The manuscript will undergo copyediting, typesetting, and review of the resulting proof before it is published in its final form. Please note that during the production process errors may be discovered which could affect the content, and all legal disclaimers that apply to the journal pertain.
DECLARATION OF INTERESTS
The authors declare no competing interests.
REFERENCES
- [1].Nieuwenhuis J, Brummelkamp TR. The Tubulin Detyrosination Cycle: Function and Enzymes. Trends in Cell Biology 2019;29:80–92. doi: 10.1016/j.tcb.2018.08.003. [DOI] [PubMed] [Google Scholar]
- [2].Raybin D, Flavin M. An enzyme tyrosylating alpha-tubulin and its role in microtubule assembly. Biochemical and Biophysical Research Communications 1975;65:1088–95. doi: 10.1016/s0006-291x(75)80497-9. [DOI] [PubMed] [Google Scholar]
- [3].Raybin D, Flavin M. Enzyme which specifically adds tyrosine to the alpha chain of tubulin. Biochemistry 1977;16:2189–94. doi: 10.1021/bi00629a023. [DOI] [PubMed] [Google Scholar]
- [4].Raybin D, Flavin M. Modification of tubulin by tyrosylation in cells and extracts and its effect on assembly in vitro. The Journal of Cell Biology 1977;73:492–504. doi: 10.1083/jcb.73.2.492. [DOI] [PMC free article] [PubMed] [Google Scholar]
- [5].Hallak ME, Rodríguez JA, Barra HS, Caputto R. Release of tyrosine from tyrosinated tubulin. Some common factors that affect this process and the assembly of tubulin. FEBS Letters 1977;73:147–50. doi: 10.1016/0014-5793(77)80968-x. [DOI] [PubMed] [Google Scholar]
- [6].Rodríguez JA, Arce CA, Barra HS, Caputto R. Release of tyrosine incorporated as a single unit into rat brain protein. Biochemical and Biophysical Research Communications 1973;54:335–40. doi: 10.1016/0006-291x(73)90927-3. [DOI] [PubMed] [Google Scholar]
- [7].Barra HS, Arce CA, Rodríguez JA, Caputto R. Some common properties of the protein that incorporates tyrosine as a single unit and the microtubule proteins. Biochemical and Biophysical Research Communications 1974;60:1384–90. doi: 10.1016/0006-291x(74)90351-9. [DOI] [PubMed] [Google Scholar]
- [8].Nieuwenhuis J, Adamopoulos A, Bleijerveld OB, Mazouzi A, Stickel E, Celie P, et al. Vasohibins encode tubulin detyrosinating activity. Science 2017;358:1453–6. doi: 10.1126/science.aao5676. [DOI] [PubMed] [Google Scholar]
- [9].Aillaud C, Bosc C, Peris L, Bosson A, Heemeryck P, van Dijk J, et al. Vasohibins/SVBP are tubulin carboxypeptidases (TCPs) that regulate neuron differentiation. Science 2017;358:1448–53. doi: 10.1126/science.aao4165. [DOI] [PubMed] [Google Scholar]
- [10].Freund RRA, Gobrecht P, Fischer D, Arndt H-D. Advances in chemistry and bioactivity of parthenolide. Nat Prod Rep 2020;37:541–65. doi: 10.1039/c9np00049f. [DOI] [PubMed] [Google Scholar]
- [11].Ghantous A, Gali-Muhtasib H, Vuorela H, Saliba NA, Darwiche N. What made sesquiterpene lactones reach cancer clinical trials? Drug Discov Today 2010; 15:668–78. doi: 10.1016/j.drudis.2010.06.002. [DOI] [PubMed] [Google Scholar]
- [12].Kreuger MRO, Grootjans S, Biavatti MW, Vandenabeele P, D’Herde K. Sesquiterpene lactones as drugs with multiple targets in cancer treatment: focus on parthenolide. Anticancer Drugs 2012;23:883–96. doi: 10.1097/CAD.0b013e328356cad9. [DOI] [PubMed] [Google Scholar]
- [13].Jackson PA, Widen JC, Harki DA, Brummond KM. Covalent Modifiers: A Chemical Perspective on the Reactivity of α,β-Unsaturated Carbonyls with Thiols via Hetero-Michael Addition Reactions. J Med Chem 2017;60:839–85. doi: 10.1021/acs.jmedchem.6b00788. [DOI] [PMC free article] [PubMed] [Google Scholar]
- [14].Ghantous A, Sinjab A, Herceg Z, Darwiche N. Parthenolide: from plant shoots to cancer roots. Drug Discov Today 2013;18:894–905. doi: 10.1016/j.drudis.2013.05.005. [DOI] [PubMed] [Google Scholar]
- [15].Kwok BH, Koh B, Ndubuisi MI, Elofsson M, Crews CM. The anti-inflammatory natural product parthenolide from the medicinal herb Feverfew directly binds to and inhibits IkappaB kinase. Chem Biol 2001;8:759–66. doi: 10.1016/s1074-5521(01)00049-7. [DOI] [PubMed] [Google Scholar]
- [16].Shin M, McGowan A, DiNatale GJ, Chiramanewong T, Cai T, Connor RE. Hsp72 Is an Intracellular Target of the α,β-Unsaturated Sesquiterpene Lactone, Parthenolide. ACS Omega 2017;2:7267–74. doi: 10.1021/acsomega.7b00954. [DOI] [PMC free article] [PubMed] [Google Scholar]
- [17].Liu M, Xiao C, Sun M, Tan M, Hu L, Yu Q. Parthenolide Inhibits STAT3 Signaling by Covalently Targeting Janus Kinases. Molecules 2018;23:1478. doi: 10.3390/molecules23061478. [DOI] [PMC free article] [PubMed] [Google Scholar]
- [18].Berdan CA, Ho R, Lehtola HS, To M, Hu X, Huffman TR, et al. Parthenolide Covalently Targets and Inhibits Focal Adhesion Kinase in Breast Cancer Cells. Cell Chem Biol 2019;26:1027–1035.e22. doi: 10.1016/j.chembiol.2019.03.016. [DOI] [PMC free article] [PubMed] [Google Scholar]
- [19].Fonrose X, Ausseil F, Soleilhac E, Masson V, David B, Pouny I, et al. Parthenolide Inhibits Tubulin Carboxypeptidase Activity. Cancer Research 2007;67:3371–8. doi: 10.1158/0008-5472.CAN-06-3732. [DOI] [PubMed] [Google Scholar]
- [20].Barisic M, Silva e Sousa R, Tripathy SK, Magiera MM, Zaytsev AV, Pereira AL, et al. Mitosis. Microtubule detyrosination guides chromosomes during mitosis. Science 2015;348:799–803. doi: 10.1126/science.aaa5175. [DOI] [PMC free article] [PubMed] [Google Scholar]
- [21].Gobrecht P, Andreadaki A, Diekmann H, Heskamp A, Leibinger M, Fischer D. Promotion of Functional Nerve Regeneration by Inhibition of Microtubule Detyrosination. J Neurosci 2016;36:3890–902. doi: 10.1523/JNEUROSCI.4486-15.2016. [DOI] [PMC free article] [PubMed] [Google Scholar]
- [22].Mohan N, Sorokina EM, Verdeny IV, Alvarez AS, Lakadamyali M. Detyrosinated microtubules spatially constrain lysosomes facilitating lysosome-autophagosome fusion. The Journal of Cell Biology 2019;218:632–43. doi: 10.1083/jcb.201807124. [DOI] [PMC free article] [PubMed] [Google Scholar]
- [23].Robison P, Caporizzo MA, Ahmadzadeh H, Bogush AI, Chen CY, Margulies KB, et al. Detyrosinated microtubules buckle and bear load in contracting cardiomyocytes. Science 2016;352:aaf0659–9. doi: 10.1126/science.aaf0659. [DOI] [PMC free article] [PubMed] [Google Scholar]
- [24].Schneider N, Ludwig H, Nick P. Suppression of tubulin detyrosination by parthenolide recruits the plant-specific kinesin KCH to cortical microtubules. Journal of Experimental Botany 2015;66:2001–11. doi: 10.1093/jxb/erv012. [DOI] [PMC free article] [PubMed] [Google Scholar]
- [25].Chen CY, Caporizzo MA, Bedi K, Vite A, Bogush AI, Robison P, et al. Suppression of detyrosinated microtubules improves cardiomyocyte function in human heart failure. Nat Med 2018;24:1225–33. doi: 10.1038/s41591-018-0046-2. [DOI] [PMC free article] [PubMed] [Google Scholar]
- [26].Fujii Y, Kaneko M, Neyazaki M, Nogi T, Kato Y, Takagi J. Protein Expression and Purification. Protein Expression and Purification 2014;95:240–7. doi: 10.1016/j.pep.2014.01.009. [DOI] [PubMed] [Google Scholar]
- [27].Li X, Kong L, Yang Q, Duan A, Ju X, Cai B, et al. Parthenolide inhibits ubiquitin-specific peptidase 7 (USP7), Wnt signaling, and colorectal cancer cell growth. J Biol Chem 2020;295:3576–89. doi: 10.1074/jbc.RA119.011396. [DOI] [PMC free article] [PubMed] [Google Scholar]
- [28].Liao G, Gundersen GG. Kinesin is a candidate for cross-bridging microtubules and intermediate filaments. Selective binding of kinesin to detyrosinated tubulin and vimentin. J Biol Chem 1998;273:9797–803. doi: 10.1074/jbc.273.16.9797. [DOI] [PubMed] [Google Scholar]
- [29].Kreitzer G, Liao G, Gundersen GG. Detyrosination of tubulin regulates the interaction of intermediate filaments with microtubules in vivo via a kinesin-dependent mechanism. Mol Biol Cell 1999;10:1105–18. doi: 10.1091/mbc.10.4.1105. [DOI] [PMC free article] [PubMed] [Google Scholar]
- [30].Peris L, Théry M, Fauré J, Saoudi Y, Lafanechère L, Chilton JK, et al. Tubulin tyrosination is a major factor affecting the recruitment of CAP-Gly proteins at microtubule plus ends. The Journal of Cell Biology 2006;174:839–49. doi: 10.1083/jcb.200512058. [DOI] [PMC free article] [PubMed] [Google Scholar]
- [31].Peris L, Wagenbach M, Lafanechère L, Brocard J, Moore AT, Kozielski F, et al. Motor-dependent microtubule disassembly driven by tubulin tyrosination. The Journal of Cell Biology 2009;185:1159–66. doi: 10.1083/jcb.200902142. [DOI] [PMC free article] [PubMed] [Google Scholar]
- [32].Dunn S, Morrison EE, Liverpool TB, Molina-París C, Cross RA, Alonso MC, et al. Differential trafficking of Kif5c on tyrosinated and detyrosinated microtubules in live cells. Journal of Cell Science 2008;121:1085–95. doi: 10.1242/jcs.026492. [DOI] [PubMed] [Google Scholar]
- [33].Cai D, McEwen DP, Martens JR, Meyhofer E, Verhey KJ. Single molecule imaging reveals differences in microtubule track selection between Kinesin motors. PLoS Biol 2009;7:e1000216. doi: 10.1371/journal.pbio.1000216. [DOI] [PMC free article] [PubMed] [Google Scholar]
- [34].Konishi Y, Setou M. Tubulin tyrosination navigates the kinesin-1 motor domain to axons. Nat Neurosci 2009;12:559–67. doi: 10.1038/nn.2314. [DOI] [PubMed] [Google Scholar]
- [35].Kaul N, Soppina V, Verhey KJ. Effects of α-tubulin K40 acetylation and detyrosination on kinesin-1 motility in a purified system. Biophys J 2014;106:2636–43. doi: 10.1016/j.bpj.2014.05.008. [DOI] [PMC free article] [PubMed] [Google Scholar]
- [36].Sirajuddin M, Rice LM, Vale RD. Regulation of microtubule motors by tubulin isotypes and post-translational modifications. Nat Cell Biol 2014;16:335–44. doi: 10.1038/ncb2920. [DOI] [PMC free article] [PubMed] [Google Scholar]
- [37].McKenney RJ, Huynh W, Vale RD, Sirajuddin M. Tyrosination of α-tubulin controls the initiation of processive dynein-dynactin motility. The EMBO Journal 2016;35:1175–85. doi: 10.15252/embj.201593071. [DOI] [PMC free article] [PubMed] [Google Scholar]
- [38].Barbosa DJ, Duro J, Prevo B, Cheerambathur DK, Carvalho AX, Gassmann R. Dynactin binding to tyrosinated microtubules promotes centrosome centration in C. elegans by enhancing dynein-mediated organelle transport. PLoS Genet 2017; 13:e1006941. doi: 10.1371/journal.pgen.1006941. [DOI] [PMC free article] [PubMed] [Google Scholar]
- [39].Luduena RF, Roach MC. Tubulin sulfhydryl groups as probes and targets for antimitotic and antimicrotubule agents. Pharmacol Ther 1991;49:133–52. doi: 10.1016/0163-7258(91)90027-j. [DOI] [PubMed] [Google Scholar]
- [40].Levison BS, Wiemels J, Szasz J, Sternlicht H. Ethoxyformylation of tubulin with [3H]diethyl pyrocarbonate: a reexamination of the mechanism of assembly inhibition. Biochemistry 1989;28:8877–84. doi: 10.1021/bi00448a029. [DOI] [PubMed] [Google Scholar]
- [41].Szasz J, Yaffe MB, Elzinga M, Blank GS, Sternlicht H. Microtubule assembly is dependent on a cluster of basic residues in alpha-tubulin. Biochemistry 1986;25:4572–82. doi: 10.1021/bi00364a018. [DOI] [PubMed] [Google Scholar]
- [42].Li F, Hu Y, Qi S, Luo X, Yu H. Structural basis of tubulin detyrosination by vasohibins. Nat Struct Mol Biol 2019;26:583–91. doi: 10.1038/s41594-019-0242-x. [DOI] [PMC free article] [PubMed] [Google Scholar]
- [43].Sanchez-Pulido L, Bioinformatics CP. Vasohibins: new transglutaminase-like cysteine proteases possessing a non-canonical Cys-His-Ser catalytic triad. Bioinfomatics 2016;32:1441–5. doi: 10.1093/bioinformatics/btv761/-/DC1. [DOI] [PMC free article] [PubMed] [Google Scholar]
- [44].Khandelia P, Yap K, Makeyev EV. Streamlined platform for short hairpin RNA interference and transgenesis in cultured mammalian cells. Proceedings of the National Academy of Sciences 2011; 108:12799–804. doi: 10.1073/pnas.1103532108. [DOI] [PMC free article] [PubMed] [Google Scholar]
- [45].Sturgill EG, Norris SR, Guo Y, Ohi R. Kinesin-5 inhibitor resistance is driven by kinesin-12. The Journal of Cell Biology 2016;213:213–27. doi: 10.1083/jcb.201507036. [DOI] [PMC free article] [PubMed] [Google Scholar]
- [46].Gayek AS, Ohi R. Kinetochore-microtubule stability governs the metaphase requirement for Eg5. Mol Biol Cell 2014;25:2051–60. doi: 10.1091/mbc.E14-03-0785. [DOI] [PMC free article] [PubMed] [Google Scholar]
- [47].Widlund PO, Podolski M, Reber S, Alper J, Storch M, Hyman AA, et al. One-step purification of assembly-competent tubulin from diverse eukaryotic sources. Mol Biol Cell 2012;23:4393–401. doi: 10.1091/mbc.E12-06-0444. [DOI] [PMC free article] [PubMed] [Google Scholar]
- [48].Hotta T, Fujita S, Uchimura S, Noguchi M, Demura T, Muto E, et al. Affinity Purification and Characterization of Functional Tubulin from Cell Suspension Cultures of Arabidopsis and Tobacco. Plant Physiology 2016;170:1189–205. doi: 10.1104/pp.15.01173. [DOI] [PMC free article] [PubMed] [Google Scholar]
- [49].Lessard DV, Zinder OJ, Hotta T, Verhey KJ, Ohi R, Berger CL. Polyglutamylation of tubulin’s C-terminal tail controls pausing and motility of kinesin-3 family member KIF1A. J Biol Chem 2019;294:6353–63. doi: 10.1074/jbc.RA118.005765. [DOI] [PMC free article] [PubMed] [Google Scholar]
- [50].Castoldi M, Popov AV. Purification of brain tubulin through two cycles of polymerization-depolymerization in a high-molarity buffer. Protein Expression and Purification 2003;32:83–8. doi: 10.1016/S1046-5928(03)00218-3. [DOI] [PubMed] [Google Scholar]
- [51].Yue Y, Blasius TL, Zhang S, Jariwala S, Walker B, Grant BJ, et al. Altered chemomechanical coupling causes impaired motility of the kinesin-4 motors KIF27 and KIF7. The Journal of Cell Biology 2018;217:1319–34. doi: 10.1083/jcb.201708179. [DOI] [PMC free article] [PubMed] [Google Scholar]
- [52].Kong AT, Leprevost FV, Avtonomov DM, Mellacheruvu D, Nesvizhskii AI. MSFragger: ultrafast and comprehensive peptide identification in mass spectrometry-based proteomics. Nat Meth 2017;14:513–20. doi: 10.1038/nmeth.4256. [DOI] [PMC free article] [PubMed] [Google Scholar]
- [53].Yu F, Teo GC, Kong AT, Haynes SE, Avtonomov DM, Geiszler DJ, et al. Identification of modified peptides using localization-aware open search. Nature Communications 2020; 11:4065–9. doi: 10.1038/s41467-020-17921-y. [DOI] [PMC free article] [PubMed] [Google Scholar]
- [54].da Veiga Leprevost F, Haynes SE, Avtonomov DM, Chang H-Y, Shanmugam AK, Mellacheruvu D, et al. Philosopher: a versatile toolkit for shotgun proteomics data analysis. Nat Meth 2020;10:1150–2. doi: 10.1038/s41592-020-0912-y. [DOI] [PMC free article] [PubMed] [Google Scholar]
- [55].Li K, Vaudel M, Zhang B, Ren Y, Wen B. PDV: an integrative proteomics data viewer. Bioinformatics 2019;35:1249–51. doi: 10.1093/bioinformatics/bty770. [DOI] [PMC free article] [PubMed] [Google Scholar]
- [56].Vizcaíno JA, Deutsch EW, Wang R, Csordas A, Reisinger F, Ríos D, et al. ProteomeXchange provides globally coordinated proteomics data submission and dissemination. Nat Biotechnol 2014;32:223–6. doi: 10.1038/nbt.2839. [DOI] [PMC free article] [PubMed] [Google Scholar]
- [57].Keller A, Nesvizhskii AI, Kolker E, Aebersold R. Empirical statistical model to estimate the accuracy of peptide identifications made by MS/MS and database search. Anal Chem 2002;74:5383–92. doi: 10.1021/ac025747h. [DOI] [PubMed] [Google Scholar]
Associated Data
This section collects any data citations, data availability statements, or supplementary materials included in this article.
Supplementary Materials
Data S1. PTL-modified sites in purified tubulin and lysate samples identified by LC-MS/MS, related to Figure 2.
Video S1. HeLa cell stably expressing GFP-α-tubulin (green) and H2B-mCherry (magenta) treated with DMSO, related to Figure 1. Shown are maximum intensity projections of 6 images taken at 2 μm intervals. Z-stacks were acquired every 2 min for a total period of 1 hour.
Video S2. HeLa cell stably expressing GFP-α-tubulin (green) and H2B-mCherry (magenta) treated with 25 μμμμM PTL, related to Figure 1. Shown are maximum intensity projections of 6 images taken at 2 μm intervals. Z-stacks were acquired every 2 min for a total period of 1 hour.
Data Availability Statement
The mass spectrometry proteomics data generated in this study have been deposited in the ProteomeXchange Consortium via the PRIDE partner repository with the dataset identifier PXD020113.