Abstract
Calculation of the absolute free energy of binding (ΔGbind) for a complex in solution is challenging owing to the need for adequate configurational sampling and an accurate energetic description, typically with a force field (FF). In this study, Monte Carlo (MC) simulations with improved side-chain and backbone sampling are used to assess ΔGbind for the complex of a drug-like inhibitor (MIF180) with the protein macrophage migration inhibitory factor (MIF) using free energy perturbation (FEP) calculations. For comparison, molecular dynamics (MD) simulations were employed as an alternative sampling method for the same system. With the OPLS-AA/M FF and CM5 atomic charges for the inhibitor, the ΔGbind results from the MC/FEP and MD/FEP simulations, −8.80 ± 0.74 and −8.46 ± 0.85 kcal/mol, agree well with each other and with the experimental value of −8.98 ± 0.28 kcal/mol. The convergence of the results and analysis of the trajectories indicate that sufficient sampling was achieved for both approaches. Repeating the MD/FEP calculations using current versions of the CHARMM and AMBER FFs led to a 6-kcal/mol range of computed ΔGbind. These results show that calculation of accurate ΔGbind for large ligands is both feasible and numerically equivalent, within error limits, using either methodology.
Graphical Abstract
INTRODUCTION
Alchemical binding free energy calculations have been rapidly developing and are now being widely applied in structure-based drug design (SBDD).1–6 Different statistical mechanics approaches have been explored to try to achieve accurate binding affinity predictions.1,7 Perturbative free energy methods such as thermodynamic integration (TI), free-energy perturbation (FEP) and Bennett’s acceptance ratio (BAR) are based on the assumption that the configurational space of two different states is similar enough to obtain valid evaluations of the difference in free energies. To ensure this condition, the stratification technique splits the transformation path into a number of intermediate steps or “λ-windows” that yield adequate overlap of the configurational spaces. Relative binding free energy (ΔΔGbind) calculations, where the initial and final molecules are very similar, have been dominant in structure-based drug design (SBDD) studies.5,6 In contrast, absolute binding free energy calculations decouple energetically the ligand entirely from its environment, either the surrounding solvent molecules or a protein binding site.8,9 As the removal of the entire ligand molecule is performed, such calculations are computationally demanding and potentially sensitive to sampling and numerous setup issues for the protein. On the other hand, they do address the fundamental thermodynamic gauge of molecular recognition and the results can be directly compared to experimental binding data, after corrections for standard states are introduced.10–12 The calculations when performed in a prospective manner provide a rigorous test of current methodologies and force fields.13 However, such calculations are still far from routine and, as considered here, further examination of methodological issues and the impact of alternative force fields is needed.
Much work in the area has been done with molecular dynamics (MD) methods using software packages such as GROMACS,14 AMBER,15 NAMD,16 CHARMM,17 and OpenMM.18 Much less work has used Monte Carlo statistical mechanics (MC), though it can be very efficient compared to MD for liquid simulations.19 Unlike MD, where a new configuration is generated by integrating equations of motion for all atoms, MC explores the configurational space by localized random moves of solvent and solute molecules.19 It also permits enhanced sampling of conformational changes and of local regions of interest, e. g., near the protein binding pocket. Moreover, NVT and NPT ensembles are readily implemented through the Metropolis sampling without the need to apply thermostats and barostats. Recent improvements in the MC-based software package MCPRO have resulted in enhanced sampling of protein side chains and backbone atoms.20 Similar sampling and absolute free energies of binding were obtained for complexes of benzene and analogs with T4 lysozyme L99A using MD or MC.20 It is of interest, then, to extend this study to a more drug-relevant biomolecular system and further assess the sampling performance of MC and MD. For a common force field, MC and MD are expected to converge to the same ΔGbind results, once sufficient configurational sampling is achieved.
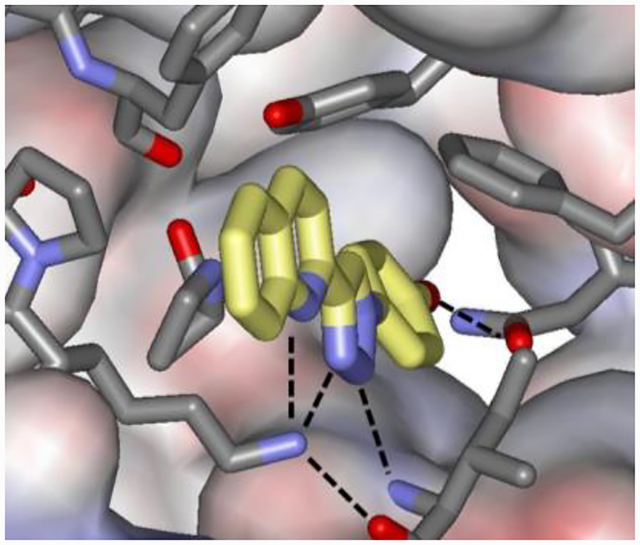
Macrophage migration inhibitory factor (MIF) is both a keto-enol tautomerase and a cytokine associated with inflammatory diseases and cancer.21,22 It was selected as the subject of this study since it has many characteristics that make it a suitable benchmark system: (1) the trimeric protein has moderate size with 342 residues; (2) multiple high-resolution crystal structures of complexes of MIF with tautomerase inhibitors are available; (3) the crystal structures for many inhibitors show modest conformational changes for binding-site residues; and, (4) experimental binding data, Ki and Kd values, are available from inhibition and fluorescence polarization assays. In particular, for this work, we have chosen to study the complex of the inhibitor MIF180 with human MIF, as illustrated in Figure 1 from the crystal structure obtained in our laboratory.22 As indicated, the complex features a combination of hydrogen bonding, van der Waals, and aryl-aryl interactions, which is typical for protein-drug complexes. In contrast, the widely used L99A T4-lysozyme system binds benzene analogs primarily through the hydrophobic effect.20
Figure 1.
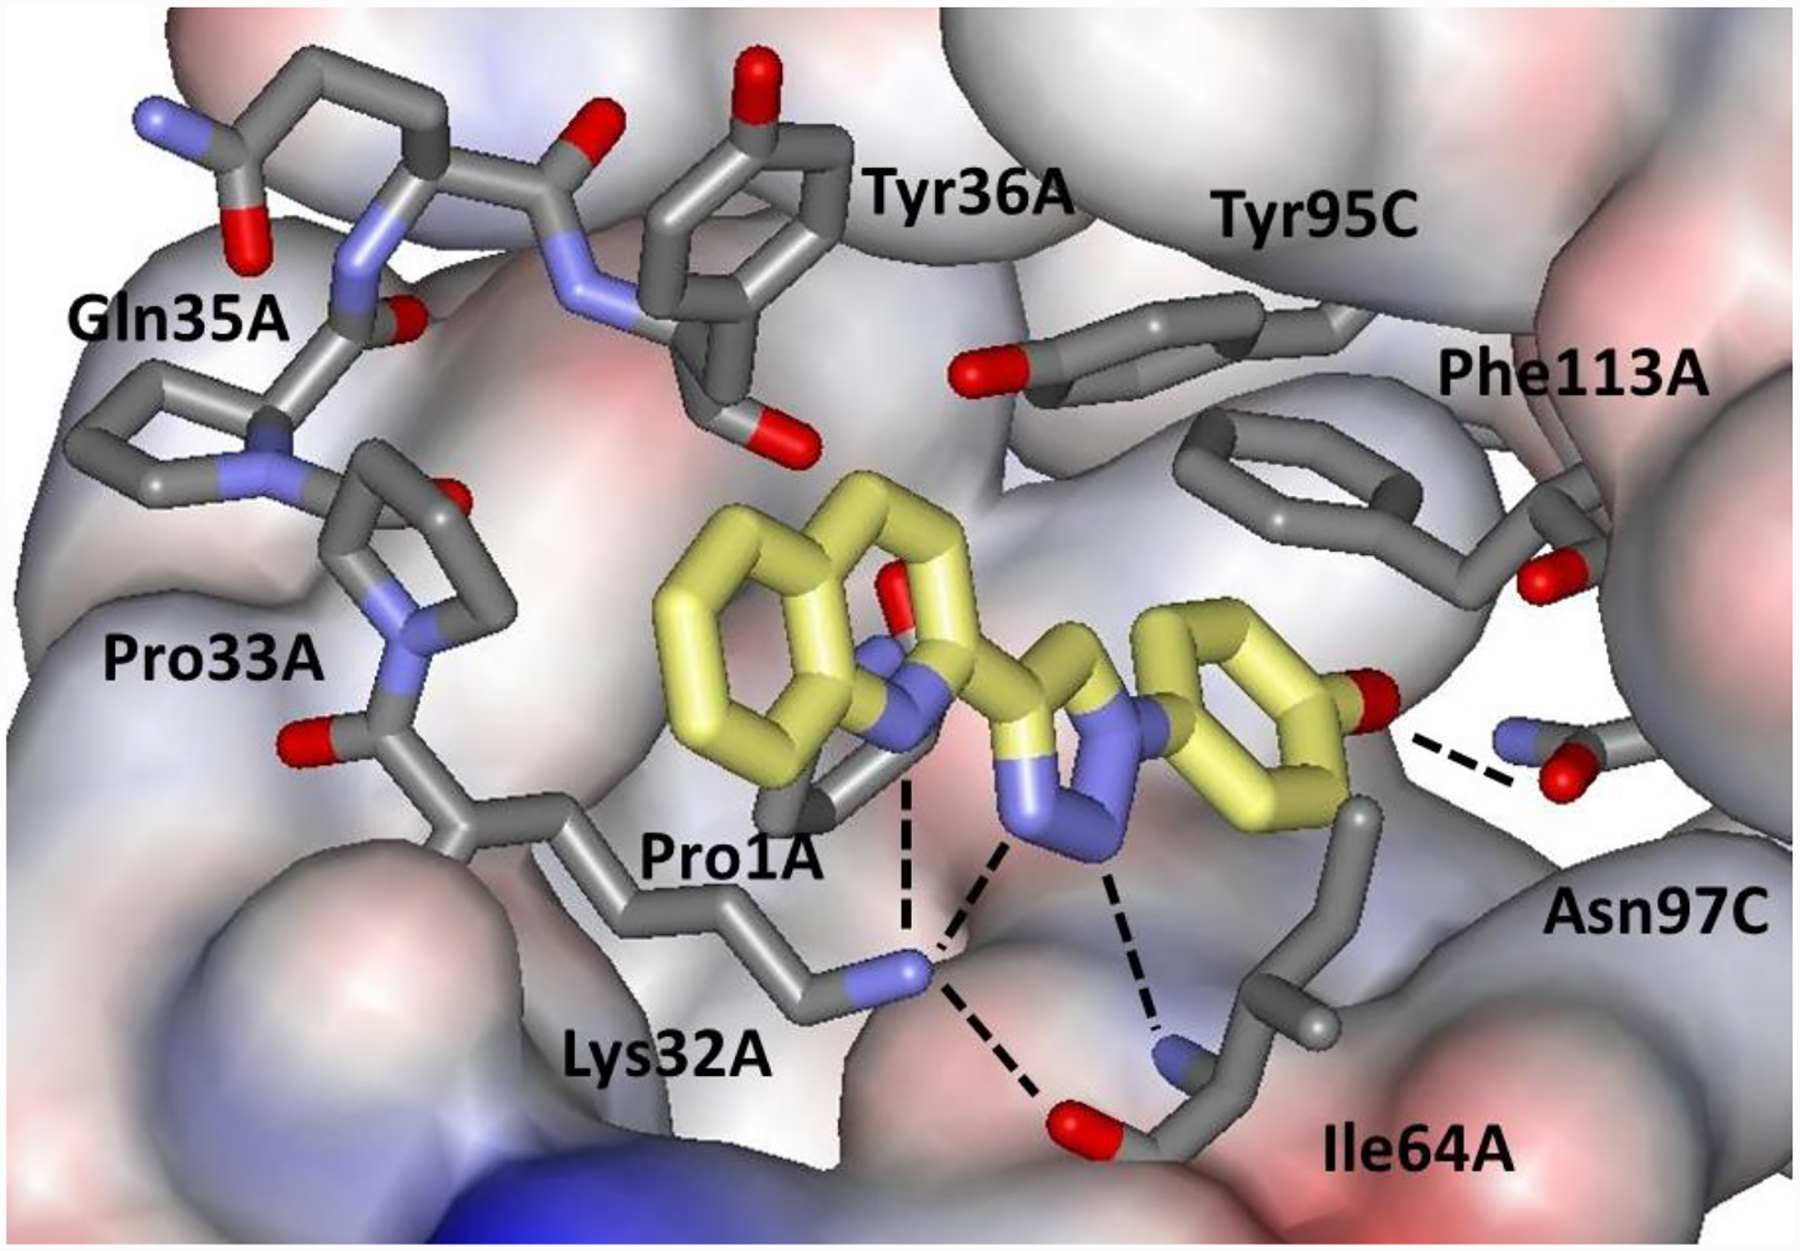
Rendering from the crystal structure of MIF180 bound to human MIF (PDB ID: 4WR8).22 Hydrogen bonds are indicated with dashed lines.
Once adequate sampling is achieved, the effects of the accuracy of the force field and other methodological factors can be evaluated for the benchmark system via ΔGbind calculations. In our laboratory, much effort has been devoted to steady improvements of the OPLS force fields. Recently, the OPLS-AA force field for proteins and nucleic acids has been improved through extensive reoptimization of the torsional parameters using high-level quantum mechanical calculations and MC and MD simulations of series of peptides, proteins, nucleotides and polynucleotides to yield OPLS-AA/M.23,24 In addition, OPLS parameters for general small-molecule ligands are now available with atomic charges from QM calculations, after optimization through studies of properties of pure liquids and free energies of hydration.25 CHARMM26 and AMBER27 are two other popular force fields initially parameterized for proteins and later extended to nucleic acids, lipids, and small molecules (CGenFF28 and GAFF29). In the present work, four combinations of protein-ligand force fields are utilized, namely OPLS-AA/M with OPLS-AA/CM5, OPLS-AA/M with OPLS-AA/CM1A, CHARMM 36 with CGenFF, and AMBER ff14sb with GAFF. These will be referred to as OPLS/CM5, OPLS/CM1A, CHARMM/CGenFF, and AMBER/GAFF.
In this work, ΔGbind results for the MIF180/MIF complex have been obtained from Monte Carlo free energy perturbation (MC/FEP) and MD/FEP calculations using the OPLS/CM5 force field for comparison with each other and with the Kd measurement from a florescence polarization assay (ΔGbind = RT ln Kd).30 Six-degree-of-freedom (6DoF) restraints were adopted for all simulations of the complex.12,13,31 In addition, the remaining force field combinations, OPLS/CM1A, CHARMM/CGenFF and AMBER/GAFF, have been applied using the same MD/FEP protocol to evaluate the sensitivity of the ΔGbind results to these alternative choices.
METHODS
Absolute Binding Free Energy Calculations.
Absolute binding free energy calculations were conducted via the double decoupling method (DDM) following the thermodynamic cycle depicted in Figure 2 and using eqs 1 and 2.8–12 The difference between the two sides of the cycle, which effectively transfers the ligand from aqueous solution to the binding site, represents the binding affinity of the protein-ligand complex. The ligand intermolecular interactions are turned off (decoupled) from the water solvent in the unbound simulation to yield ΔGunbound. All calculations of ΔGbound and ΔGunbound were done in two stages with scaling of the atomic charges
| (1) |
| (2) |
to zero followed by removal of the intermolecular Lennard-Jones interactions. In the bound simulations, the decoupling from the solvent and the protein is done with the use of geometric restraints. They are introduced to keep the disappearing ligand in the observed position and orientation in the binding site (Figure 1) yielding ΔGvb, and their effect on the free energy is corrected analytically via ΔGrestr. The latter term is calculated using eq 14 from the paper by Boresh et al.13 The equation is reproduced here as eq 2 and reflects imposition of restraints for six degrees of freedom (6DoF) that keep the ligand translationally and rotationally stable in the binding site.32–34 The specific algorithm from Wang et al.35 is implemented in the colvars module of the utilized MD program NAMD36 to control the six variables.31,37 The same algorithm is also used in our MC program, MCPRO. In the MC implementation, the restraints are turned on simultaneously with the removal of the atomic charges so ΔGvb is included in the electrostatic portion of ΔGbound, but it requires a separate simulation in the MD calculations using NAMD.
Figure 2.
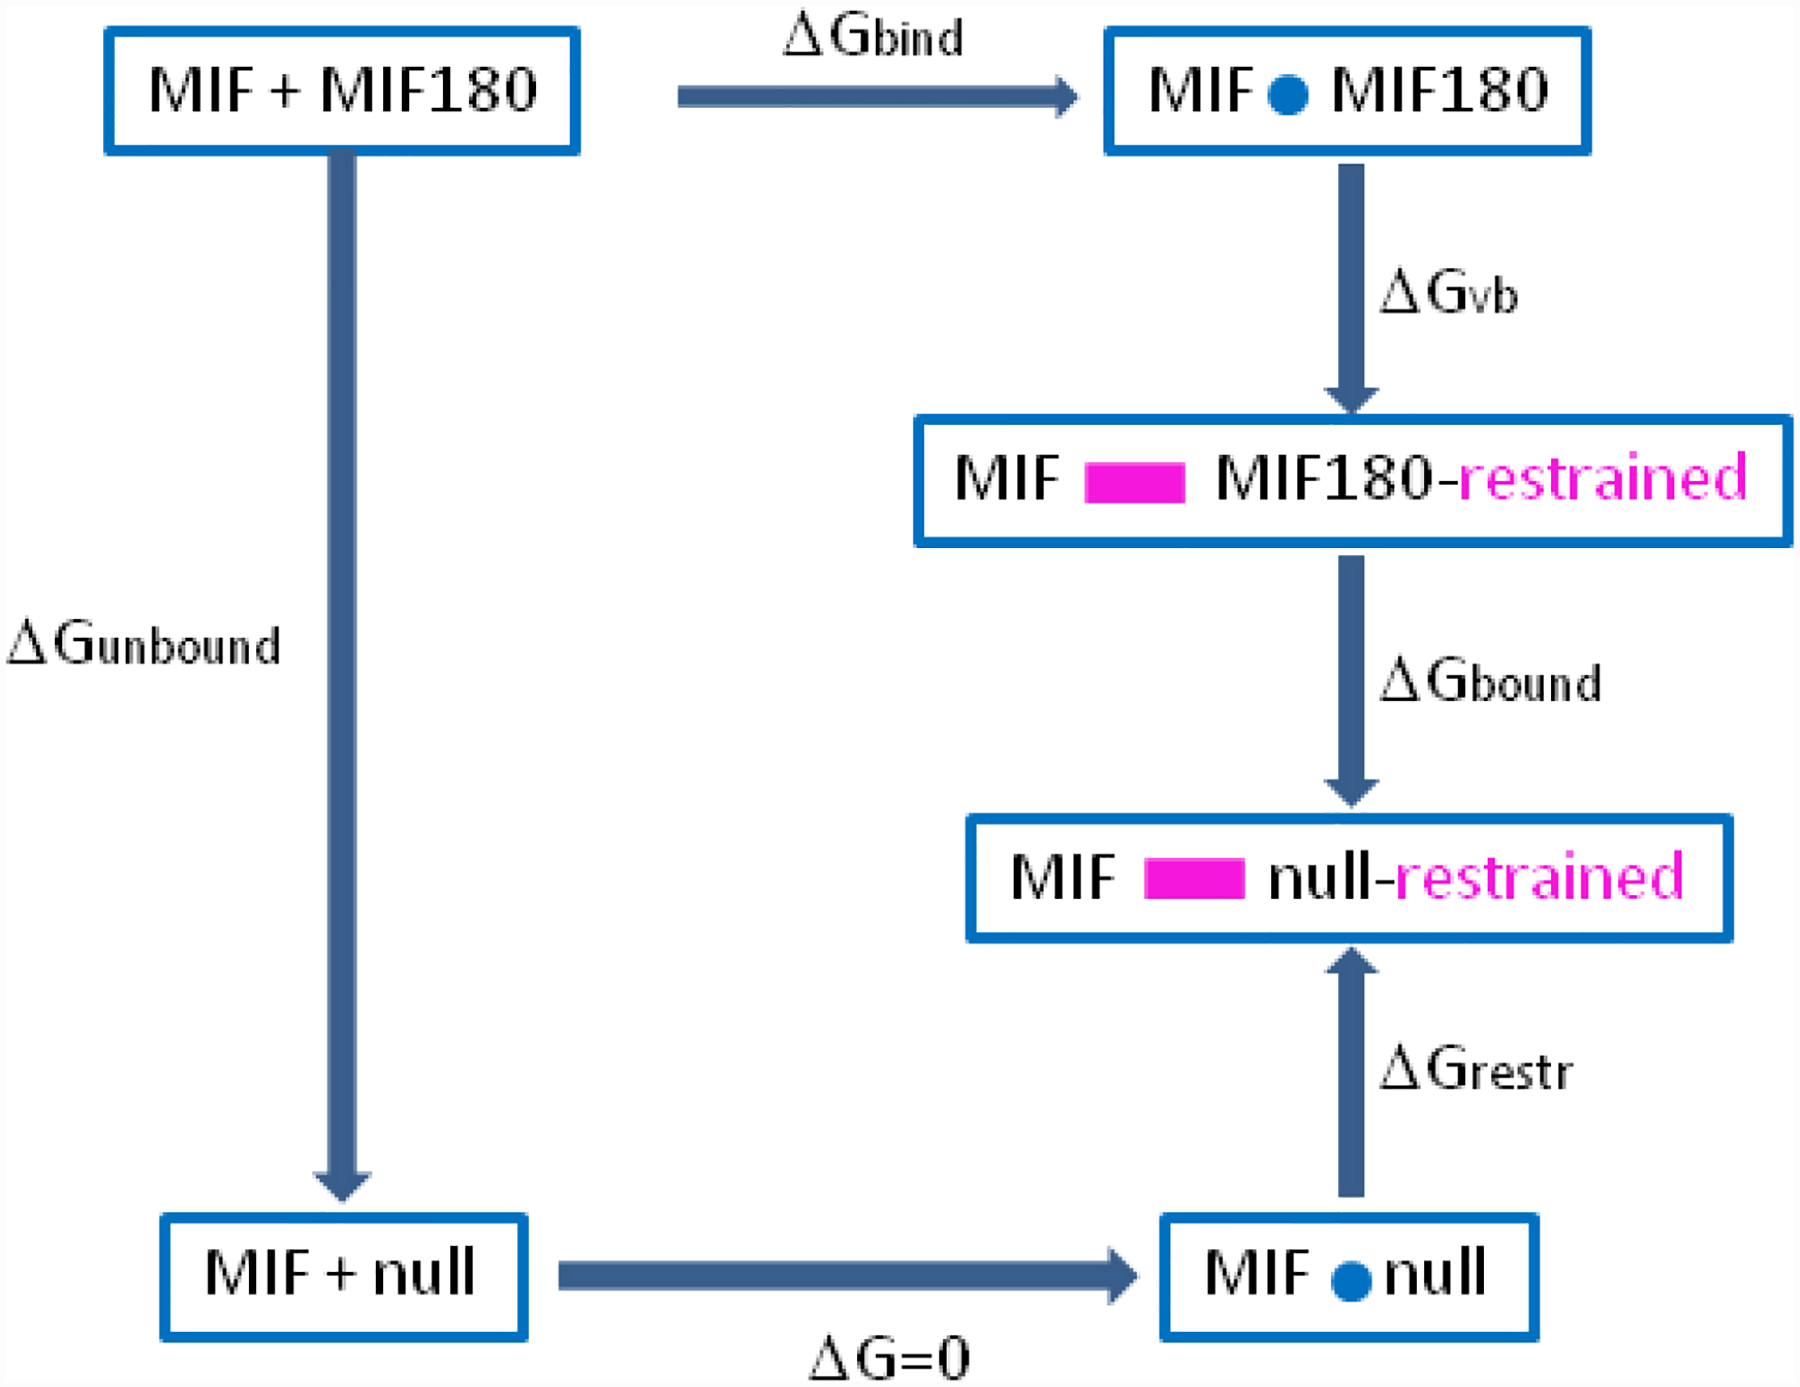
Thermodynamic cycle for computing ΔGbind.
The sum of terms in eq 1 is sufficient to calculate ΔGbind of most ligands that are either conformationally rigid or freely interconverting. The ligand in this study, MIF180, occurs in two different, non-interconverting conformations during the simulations bound in the protein and in the unbound aqueous phase. Therefore a correction term, ΔGconf, needs to be added to the result of eq 1 as a penalty for conversion of the ligand from the most stable conformation in aqueous solution or in the gas phase with the triazole and quinoline nitrogen atoms anti to the syn conformer observed in the complex (Scheme 1). This term was estimated via potential of mean force (PMF) calculations for rotation about the bond connecting the rings. The decoupling was only for interactions with the environment; intramolecular energy terms did not contribute to the FEP results, so the conformational change required separate assessment.
Scheme 1.

Two different conformations of MIF180.
System Preparation.
All structures were initially built starting from crystal structures of the complexes for MIF180 and a close analog (PDB IDs: 4WR8 and 4WRB)22 using the MCPRO clu utility. The full structure with 342 residues was retained and relaxed via a conjugate-gradient optimization using MCPRO with a dielectric constant of 2.0. For the ligand, two different OPLS-AA charge models, OPLS-AA/CM1A and OPLS-AA/CM5 were considered with the usual scaling factors for neutral-molecule partial charges of 1.14 for CM1A and 1.20 for CM5.38 In addition, CHARMM general force field (CGenFF) parameters were obtained from its webserver.28 It should be noted that the output included warnings about low quality for torsional parameters for several dihedral angles. Similarly, the ligand parameters were assigned for the general AMBER force field (GAFF)29 with the Antechamber package including AM1-BCC atomic charges.39 The protonation states for the protein residues were determined by H++40,41 and PropKa3.42,43 In both cases, the N-terminal proline was predicted to be neutral. Pro1 is the putative catalytic base for the tautomerase reaction.21 However, no neutral N-terminal proline parameters were available for the CHARMM3626 and the AMBER ff14SB27 force fields. In order to obtain the necessary parameters, the C-terminal-capped PRO-MET dipeptide was processed using CGenFF and GAFF. The parameters thus obtained were then mapped into the CHARMM and AMBER protein force fields for the neutral terminal proline. Complexes for MIF with both the neutral and protonated Pro1 were prepared for all four force field combinations.
Monte Carlo Simulations.
The OPLS-AA/M force field23 was used for the MIF protein, while OPLS-AA with the 1.20*CM5 charge model38 was used to represent the inhibitor, MIF180. The calculations of absolute free energies were carried out following the double-decoupling scheme (Figure 2). The ligand electrostatic and Lennard-Jones (LJ) interactions were decoupled consecutively with simple overlap sampling (SOS).44 The charges were first scaled to zero linearly with the λ parameter, then the intermolecular LJ interactions were turned off using 1-1-6 softcore potentials.45 The charge and LJ removals were split into 15 and 18 windows for the unbound state and 15 and 41 windows in for the bound state respectively. Each window comprised 80 million (80M) configurations of equilibration and 180M configurations of averaging (80M/180M) for the unbound state; the bound-state calculations used 80M/240M configurations for the electrostatic and 320M/240M for the LJ calculations. The PMF calculations for the rotation around the bond connecting the triazole and quinoline rings were conducted using the same system as prepared for the unbound simulations using 1M configurations of equilibration and 5M averaging at 10° intervals.
During the bound state annihilation, the ligand was restrained to its initial position relative to the protein using the six degree-of-freedom (6DoF) restraints.13,33 The required coordinate system was constructed by choosing three sites from the ligand and three from nearby protein residues. Specifically, the hydroxyl oxygen atom, the midpoint of N2 and N3 in the triazole ring, and the quinoline N atom were selected as the three groups on the ligand; and the geometric center of the heavy atoms for the Tyr36C side-chain, the Ile64A backbone and the Lys32A side-chain were used for the protein. Analytical corrections for the restraints to the fully interacting ligand and standard state were included to obtain the absolute binding free energy.13,35,46,47 The force constants for the six restraints were 10 kcal/mol-Å2 and 0.1 kcal/mol-deg2 for distances and angles, respectively. All restraint terms were gradually increased starting from zero during the electrostatic decoupling and then kept constant.
For MC/FEP simulations, the unbound ligand was solvated in a 40-Å periodic cube containing 2100 TIP4P water molecules. For the complexes, a 25-Å radius cap with ca. 2000 TIP4P water molecules centered on the ligand was used. In all cases, a residue-based cutoff of 10 Å was applied to maintain consistency with the MD simulations.
Molecular Dynamics Simulations.
All molecular dynamics (MD) simulations were performed using the NAMD program version 2.11.16 The ligand was solvated in a 40-Å periodic cube of TIP3P water,48 the default model for NAMD, and the complex was solvated in TIP3P water with 12-Å padding in all dimensions. The systems with unprotonated Pro1 were electrically neutral, and the ones with the three copies of the proline protonated were neutralized by addition of three chloride ions.
Langevin dynamics49 was applied to enforce a temperature of 300 K and a pressure of 1 atm. The time step was set at 2 fs using the SHAKE algorithm50 to constrain all bonds to hydrogen atoms. Coulombic interactions were truncated at 10 Å, and the Particle-Mesh-Ewald (PME) method was used to include long-range electrostatic interactions.51,52 The LJ interactions were smoothly switched off between 8 and 10 Å. For all of the MD simulations, the equilibration protocol consisted of 50,000 steps of conjugate-gradient minimization, followed by 2 ns of isothermal-isobaric dynamics for equilibration. The free energy rotational profiles were calculated from the unbound ligand setup using 1 ns equilibration and 5 ns averaging at 1° intervals.
The production FEP calculations were performed bi-directionally using 43 lambda windows. Each λ-window featured another 1 ns of equilibration and 5 ns of averaging for both the unbound and bound state, for a total 215 ns in each direction. The 6DoF restraints were applied to the ligand in binding site in the same manner as with MCPRO. The calculations of the absolute free energy of binding with protonated Pro1 using the AMBER/GAFF force field required an additional conformational restraint to maintain the bound syn conformation. All of the MD simulations were run in triplicate with small initial changes to generate independent trajectories.
RESULTS AND DISCUSSION
Absolute Free Energy of Binding with MC
Calculations for the Unbound Ligand; Comparison of Water Models.
Since the MC simulations used TIP4P water, while the MD simulations used TIP3P, the effect of the choice was first examined for the unbound state by evaluating free energies of hydration (ΔGhyd) of the ligand. For this purpose, full annihilations of the ligand in aqueous solution and in the gas phase were carried out with sequential removal of the Coulombic and LJ interactions. The net MC results for ΔGhyd were similar, specifically, −14.92 ± 0.10 kcal/mol for TIP4P and −14.23 ± 0.05 kcal/mol for TIP3P water. The results for the aqueous FEP calculations were taken as ΔGunbound.
Calculations for the Complex.
Bound-state MC/FEP calculations were carried out following similar protocols as in the lysozyme study.20 However, a few methodological adjustments were necessary due to the larger size and asymmetry of the MIF180 ligand. First, the hard wall (HW) restraint was replaced by the 6DoF restraints. While the HW restraint was sufficient for benzene and analogs as ligands, it resulted in very slow convergence and large numerical fluctuations in initial studies with MIF180. With the 6DoF restraints, the bound-state results showed good numerical stability.
Next, 41 λ-windows were used to ensure sufficient configuration-space overlap for the FEP calculations. Simple overlap sampling (SOS) was used, where the midpoint of the window λM is the end-point for each perturbation. The bound-state free energy changes for each window and the corresponding fluctuations are plotted in Figures 3 and 4 from the 80M/240M run lengths. While the electrostatic free-energy fluctuations were all below 0.13 kcal/mol, the LJ free-energy changes exhibit two behaviors. Low fluctuations are exhibited in the first two-thirds of the calculations, up to window 26 (0.00 ≤ λ ≤ 0.67), and then higher fluctuations occurred for the remaining windows (0.67 ≤ λ ≤ 1.00). In the latter region, all the electrostatic interactions and a large portion of the Lennard-Jones ones have been eliminated. Thus, the protein backbone and side chains should be free to relax, and water molecules migrate into the emptying binding site. These changes can be expected to be accompanied by larger energy fluctuations. As a result, increase of the equilibration stage for the LJ decoupling was explored yielding the results in Figures 5 and 6. The electrostatic decoupling reached convergence after the 80M configurations of equilibration and ca. 200M of averaging (Figure 5A). The LJ decoupling, however, still showed a slight downward drift after 240M MC steps of averaging following the 80M equilibration (Figure 6A); the corresponding total free-energy change for 80M/240M is shown in Figure 6B. Restarting the averaging at this point corresponds to an equilibration of 320M configurations. This was done and followed by another 240M configurations of averaging to yield the results in Figure 6C, which show good convergence after ca. 100M configurations of averaging. The total free-energy change as a function of λ for the LJ component is then shown in Figure 6D for the 320M/240M run lengths and reflects a change of about 2 kcal/mol from Figure 6B. All the LJ windows are well converged with the 320M/240M protocol, as shown in Supplementary Figure S4.
Figure 3:
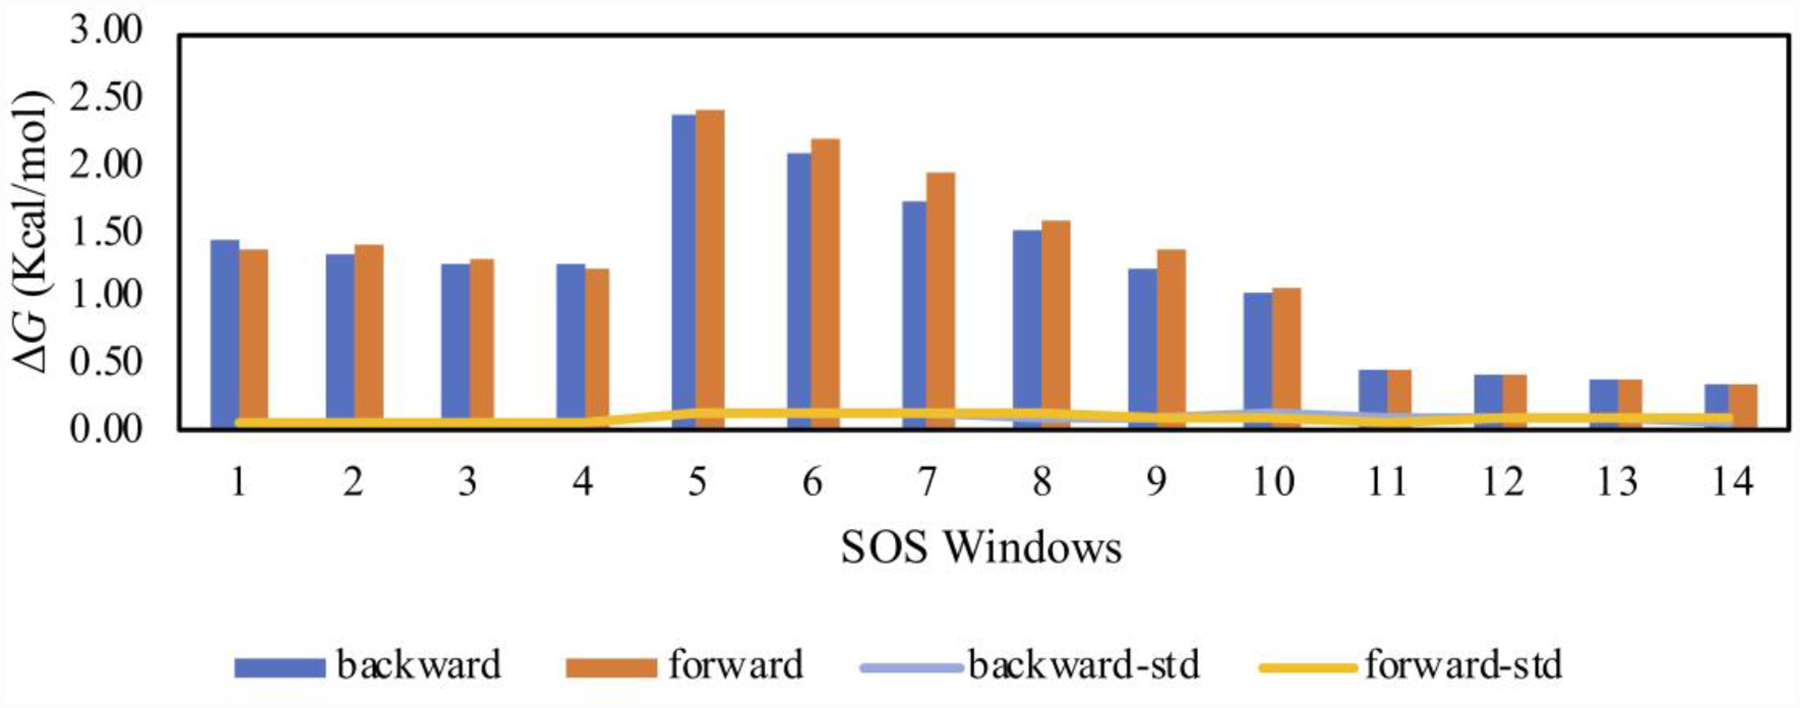
Bound-state free energy changes and fluctuations for each λ-window of the electrostatic decoupling. Bar plots: free energy change in each SOS window with forward referring to λ1 to λM and backward λ2 to λM, where λM refers to the intermediate point between each λ1 and λ2 pairs. Line plots: Standard deviation (1σ) with 80M/240M MC configurations.
Figure 4:

Bound-state free-energy changes and fluctuations for each λ-window of the LJ decoupling as in Figure 3.
Figure 5.
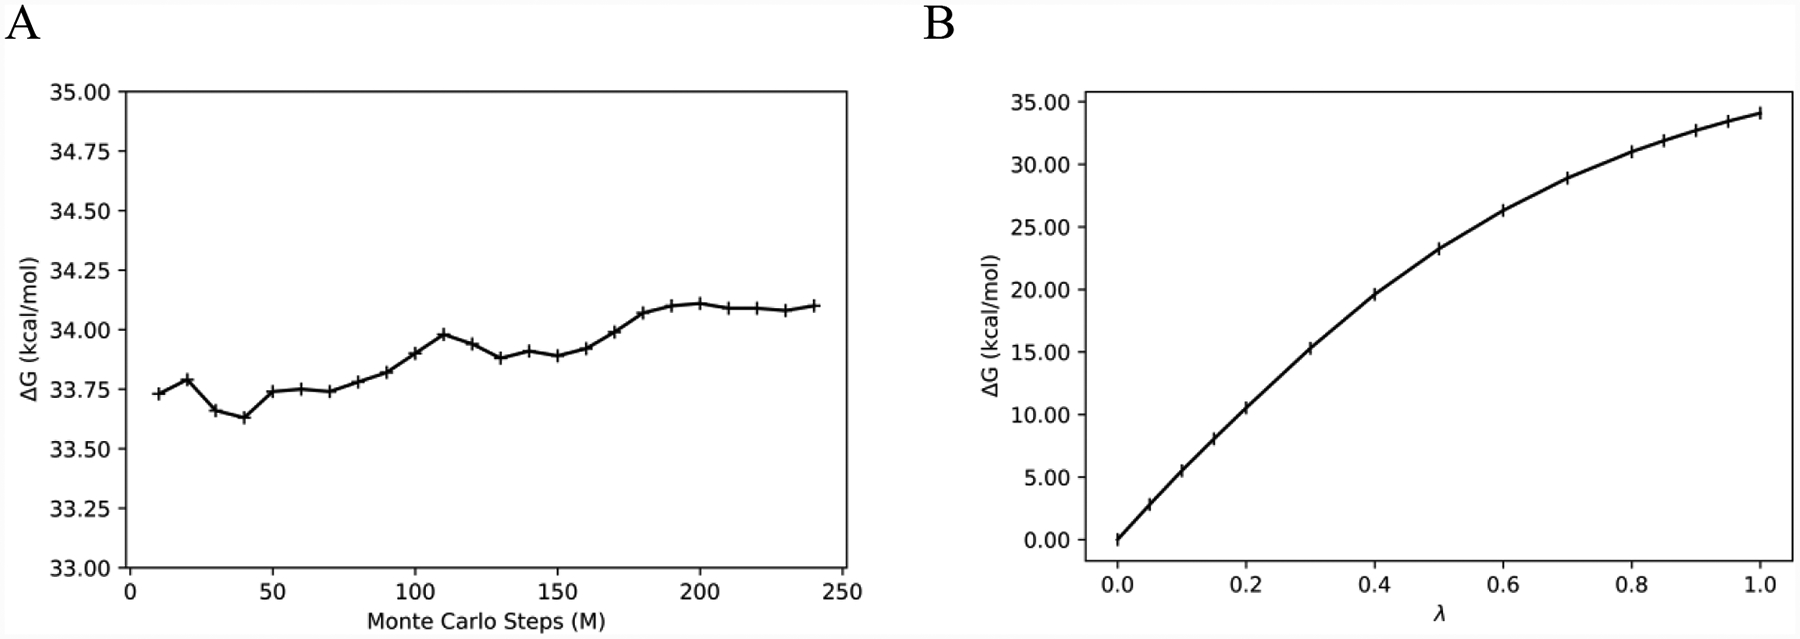
Electrostatic decoupling for the bound state after 80M configurations of equilibration. (A) Evolution of the free energy change with simulation length. (B) Total free energy change as a function of λ.
Figure 6.
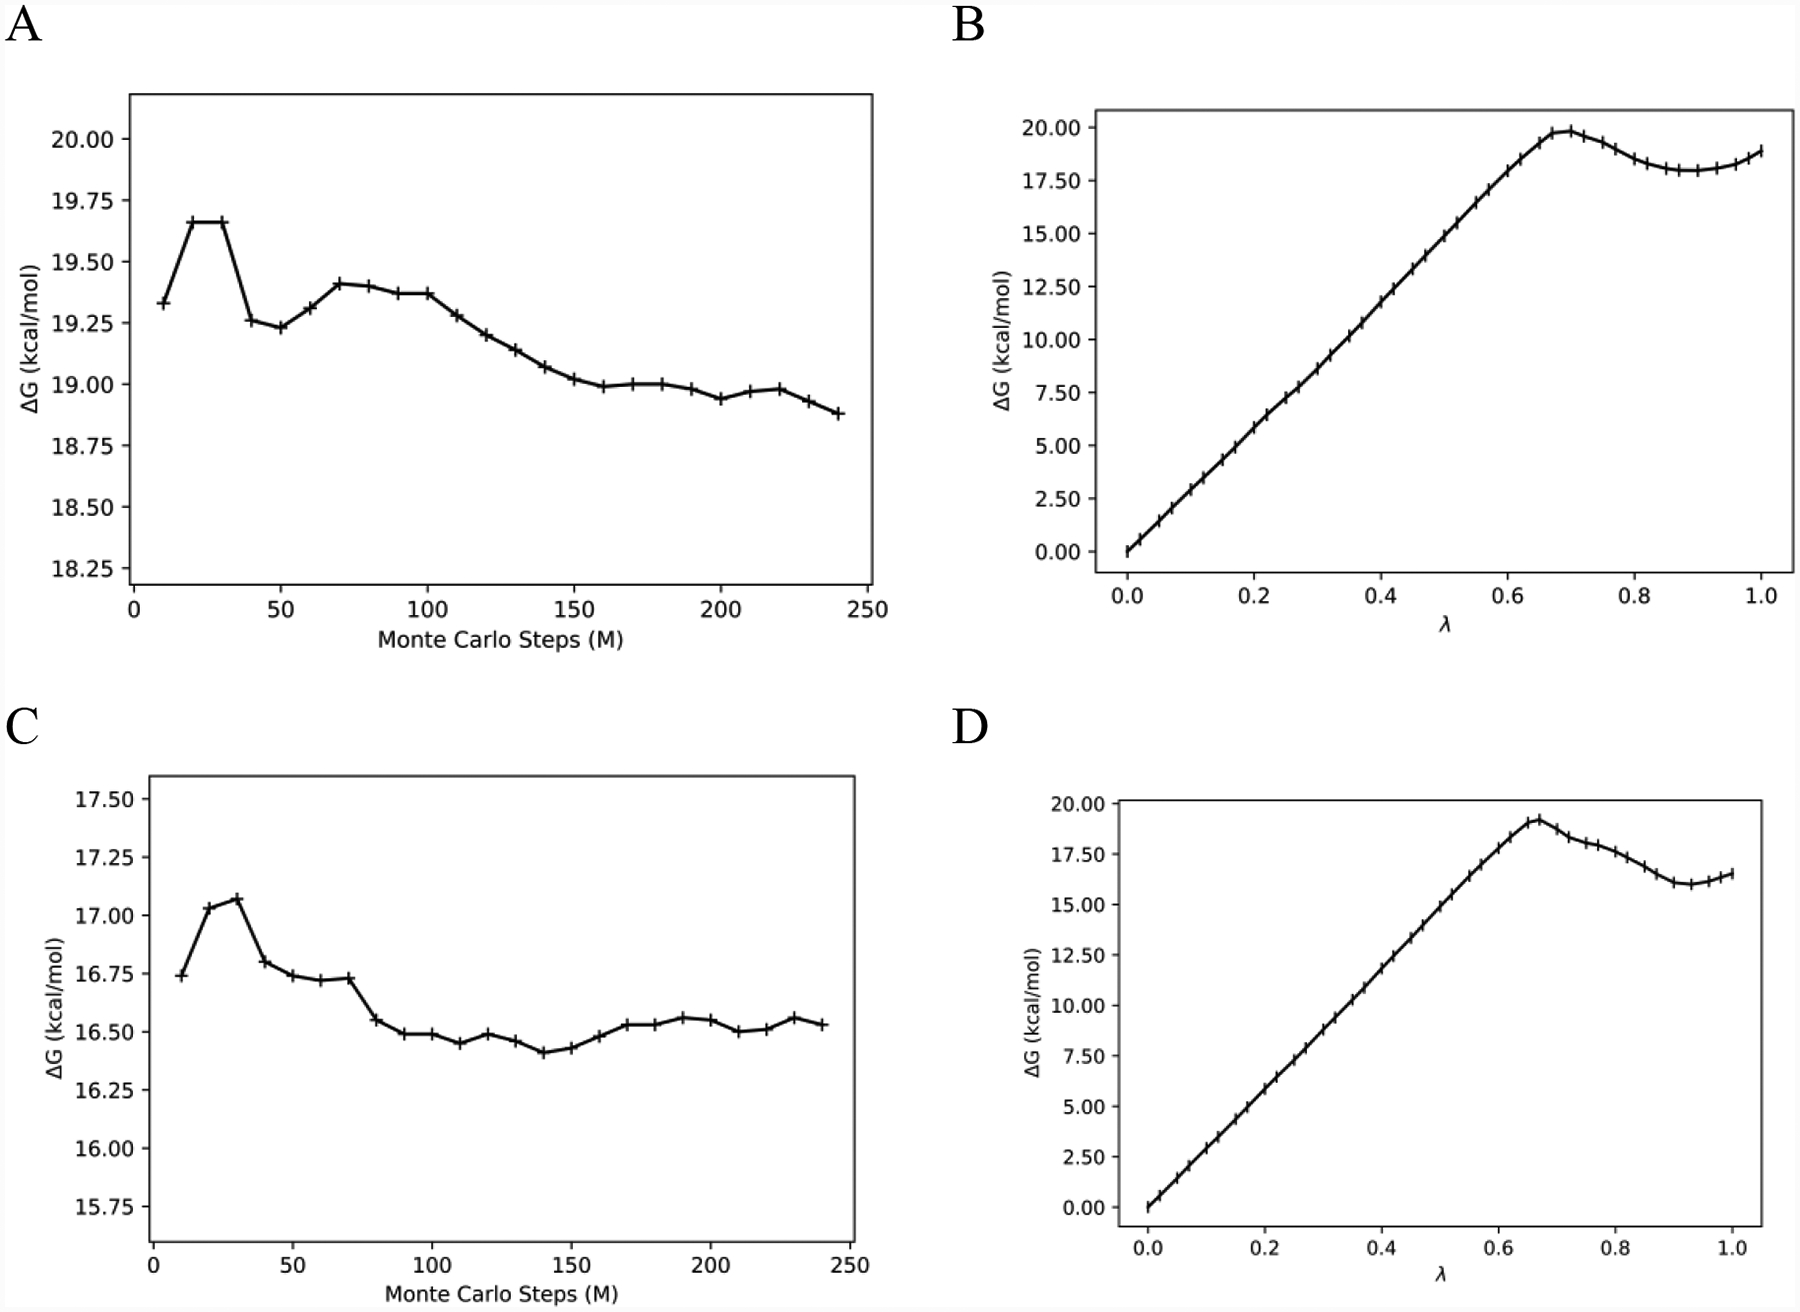
LJ decoupling for the bound state. (A) Evolution of the free energy change with simulation length after 80M configurations of averaging; (B) Free-energy change as a function of λ with 80M/240M; (C) Evolution of the free-energy change with simulation length after 320M configurations of equilibration; (D) Free energy change as a function of λ with 320M/240M.
The free energy changes for the unbound inhibitor were 27.56 ± 0.03 kcal/mol for the Coulombic term and 1.59 ± 0.10 kcal/mol for the LJ term, while the corresponding values for the bound state were 34.09 ± 0.44 kcal/mol and 16.53 ± 0.60 kcal/mol with 320M/240M. The 6DoF restraints correction, ΔGrestr, was 12.01 kcal/mol and the free energy penalty for the ligand conformational change in TIP4P water was 0.66 kcal/mol (see below). Thus, the absolute free energy of binding for the MIF180 complex via eq 1 is −8.80 ± 0.74 kcal/mol. The statistical uncertainty mainly arises from the bound-state calculations and places significant limits on the precision. The accord with the experimental value of −8.98 ± 0.28 kcal/mol30 is notable; it is in the 1-kcal/mol error range reported for relative free-energy results.6,53 However, many more examples are needed with different ligands and methodological variations before general conclusions can be reached. The following results provide some insights along these lines.
Absolute Free Energy of Binding with MD
MD Calculations for the Unbound Ligand; Comparison of Small-Molecule Force Fields.
It is informative to compare results with the small-molecule force fields for computation of the absolute free energy of hydration of the MIF180 ligand. MD simulations in the CHARMM version of TIP3P water and in gas phase were used to calculate ΔGhyd with the OPLS-AA/CM5, OPLS-AA/CM1A, CGenFF and GAFF force fields using NAMD. The resulting values for the electrostatic (ΔGQ) and van der Waals (ΔGLJ) components of the free energy of hydration are listed in Table 1. The aqueous-phase results were also used to calculate ΔGbind. From Table 1, the predictions for ΔGhyd range over 2.7 kcal/mol, with ranges of 1.1 and 3.4 kcal/mol for the LJ and Coulombic components, respectively. Thus, the major differences likely arise from variations in the partial charges for the ligand. This is documented for the atoms with the largest differences in Figure 7 and Table 2. It can be seen that the largest variations are concentrated in the central quinolinyltriazole fragment, especially for the nitrogen atoms and C2 of the quinoline ring (C0I). The differences are substantial and show that current fixed-charge force fields are far from agreement on this important item, which has obvious implications for interactions with any surrounding water or biomolecules. In the present case, N2 and N3 of the triazole and the quinoline nitrogen all participate in hydrogen bonds with MIF (Figure 1). The magnitudes of the partial charges with CGenFF are particularly large, though this does not translate into a lower ΔGhyd in Table 1. The complete list of atomic charges for the four force fields can be found in Supplementary Table S1 as well as a graphical representation of the electrostatic potentials in figure S5.
Table 1:
Free Energies of Hydration (kcal/mol) for MIF180 from MD Simulations
| 1.20*CM5 | 1.14*CM1A | CGenFF | GAFF | |
|---|---|---|---|---|
| ΔGQ | −13.58±0.08 | −14.34±0.04 | −12.33±0.38 | −15.76±0.08 |
| ΔGLJ | 0.30±0.16 | 0.34±0.10 | −0.78±0.27 | −0.05±0.01 |
| ΔGhyd | −13.28±0.18 | −14.00±0.11 | −13.11 ±0.46 | −15.81 ±0.08 |
Figure 7.
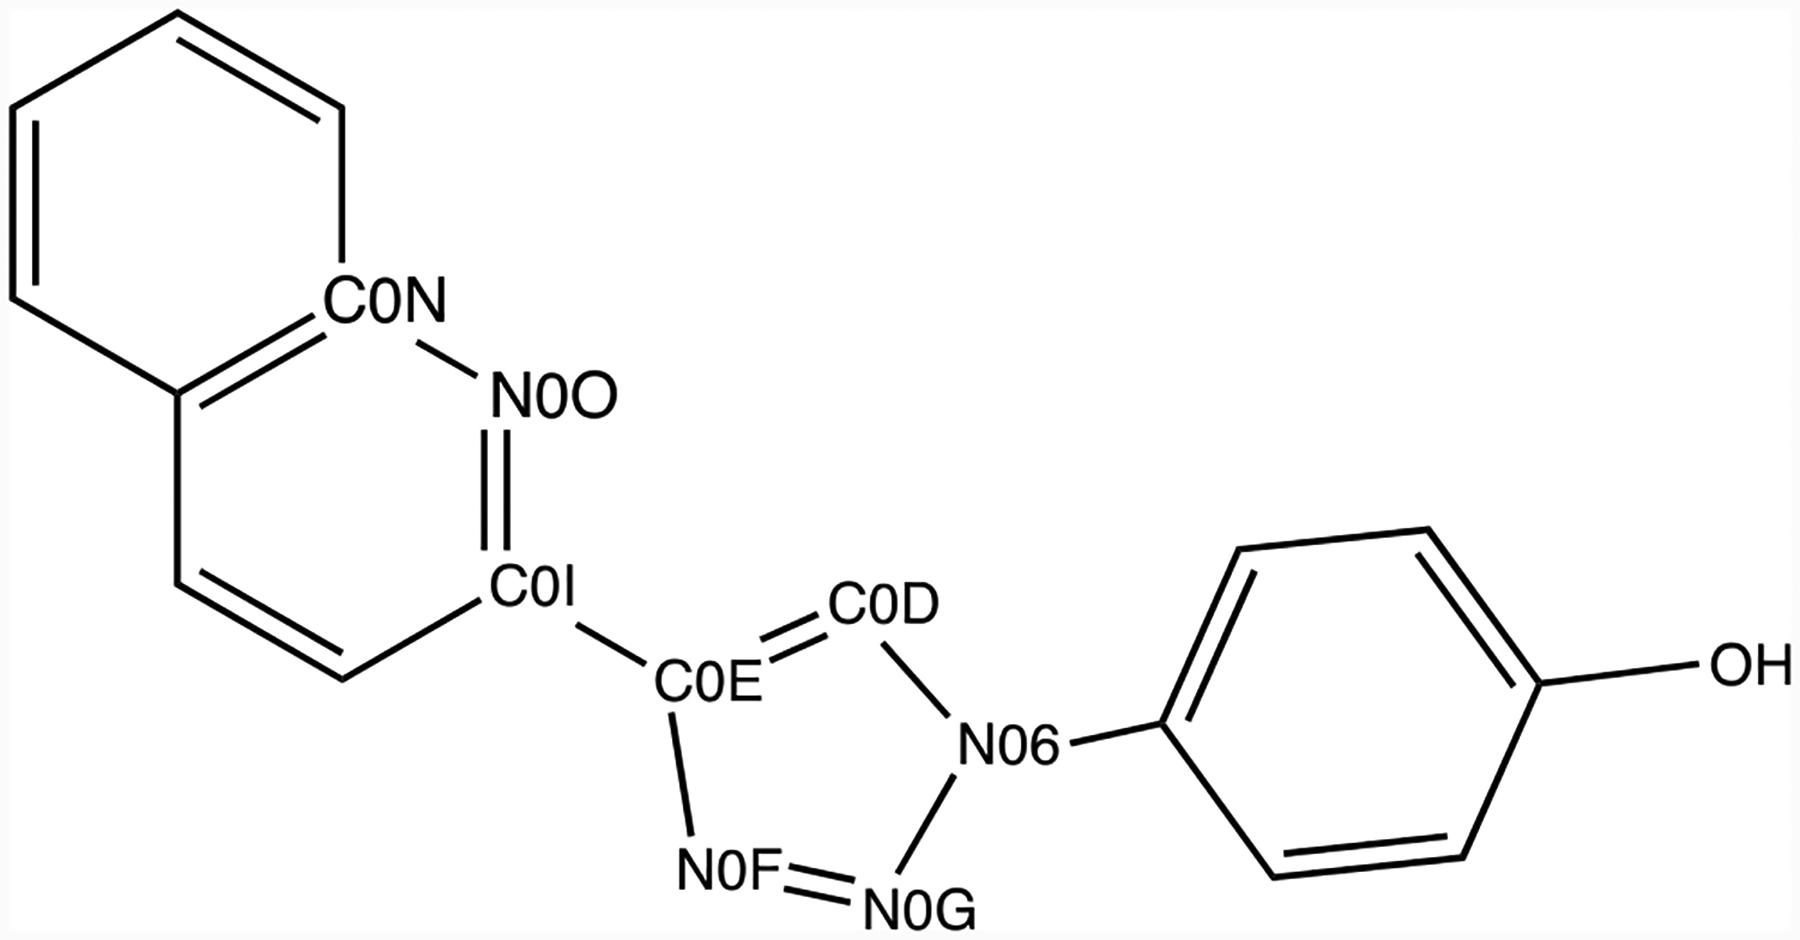
Atoms with the largest partial charge differences in MIF180.
Table 2:
Atomic Charge Comparison for Selected Atoms
| Atom Name | 1.20*CM5 | 1.14*CM1A | CGenFF | GAFF |
|---|---|---|---|---|
| N06 | −0.181 | −0.293 | 0.499 | 0.117 |
| C0D | 0.032 | −0.065 | −0.443 | −0.160 |
| C0E | 0.118 | −0.106 | 0.095 | 0.185 |
| N0F | −0.248 | −0.113 | −0.408 | −0.338 |
| N0G | −0.110 | 0.092 | −0.332 | −0.158 |
| C0I | 0.165 | 0.157 | 0.519 | 0.419 |
| C0N | 0.141 | 0.064 | 0.345 | 0.404 |
| N0O | −0.418 | −0.248 | −0.625 | −0.676 |
Conformation of the Unbound Ligand.
To calculate the ΔGbind with the present decoupling methodology, it is necessary to include a penalty for the conformational change of the ligand from anti in water to syn upon binding as reflected in Scheme 1. Thus, potential of mean force (PMF) calculations were run with NAMD using TIP3P water for each force field; the dihedral angle for the bond connecting the quinoline and triazole rings (N0F-C0E-C0I-N0O) was driven from 0° in the syn conformation to 180° in the anti conformation in both the aqueous and gas phases. The calculated PMFs are depicted in Figure 8.
Figure 8.
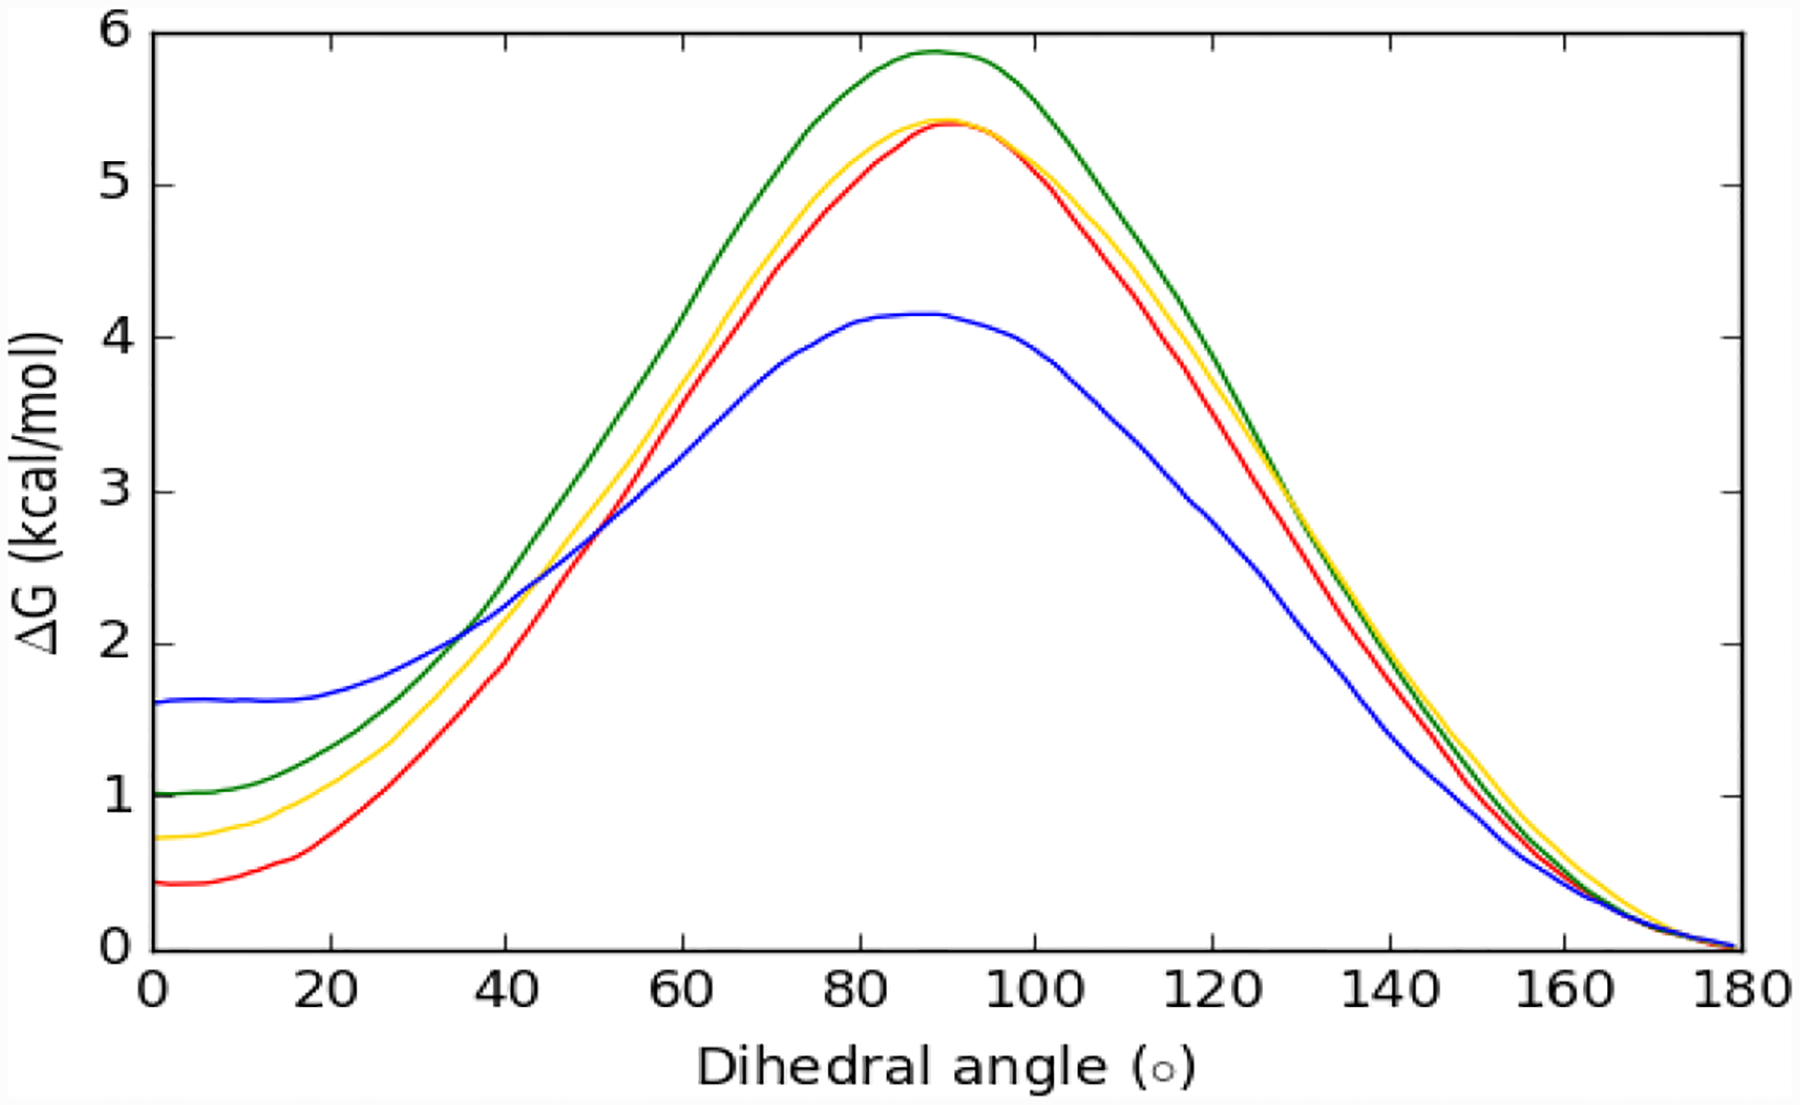
Free-energy profiles for the syn to anti conversion of MIF180 in TIP3P water: OPLS/CM5 (red curve), OPLS/CM1A (green), CHARMM/CGenFF (yellow) and AMBER/GAFF (blue).
In TIP3P water, the OPLS/CM5 force field gives the smallest free energy difference from anti to syn with a ΔGconf of 0.44 kcal/mol. While OPLS/CM1A (1.00 kcal/mol) and CGenFF (0.71 kcal/mol) gave similar free-energy curves, GAFF showed a stronger preference for the anti conformer, 1.60 kcal/mol. An analogous MC/PMF calculation was done for MIF180 in TIP4P water with the OPLS/CM5 force field, which yielded a ΔGconf of 0.66 kcal/mol. It may also be noted in Figure 8 that the GAFF force field gives a significantly lower syn to anti barrier. A consequence seemed to arise in the case with protonated Pro1 for which the syn conformation was not maintained in the protein binding site during initial MD runs using the GAFF force field. So, in this case, an additional restraint was applied to fix the syn preference for the complex.
MD Results for the Bound Complex with the OPLS/CM5 Force Field.
As noted above, the simulations for the bound complex were run in triplicate using 43 lambda windows and averaging for 5 ns. With Pro1 unprotonated, the absolute free energies of binding (ΔGbind) from the three runs were −8.35, −7.49 and −9.55 kcal/mol, to give an average of −8.46 ± 0.85 kcal/mol. The ΔGbind obtained by MD/FEP matches well with the MC/FEP result, −8.80 ± 0.74 kcal/mol, and the experimental value at −8.98 ± 0.28 kcal/mol,30 given the range of the uncertainties and the methodological differences. The bound MC/FEP simulations used a TIP4P water cap without electrostatic long-range corrections, whereas the MD/FEP runs used TIP3P water in a periodic truncated octahedron with Ewald corrections for long-range electrostatic interactions. Both simulation methods demonstrated a statistical uncertainty near 1 kcal/mol, which is in line with their difference of 0.34 kcal/mol. The evolutions of the free energies of binding are compared for MD/FEP and MC/FEP in Figure 9. On this basis, the results for both methods appear to be converged to within ca. 0.3 kcal/mol using the 240M configurations of averaging with MC and 3 × 5 = 15 ns of averaging per window with MD.
Figure 9.
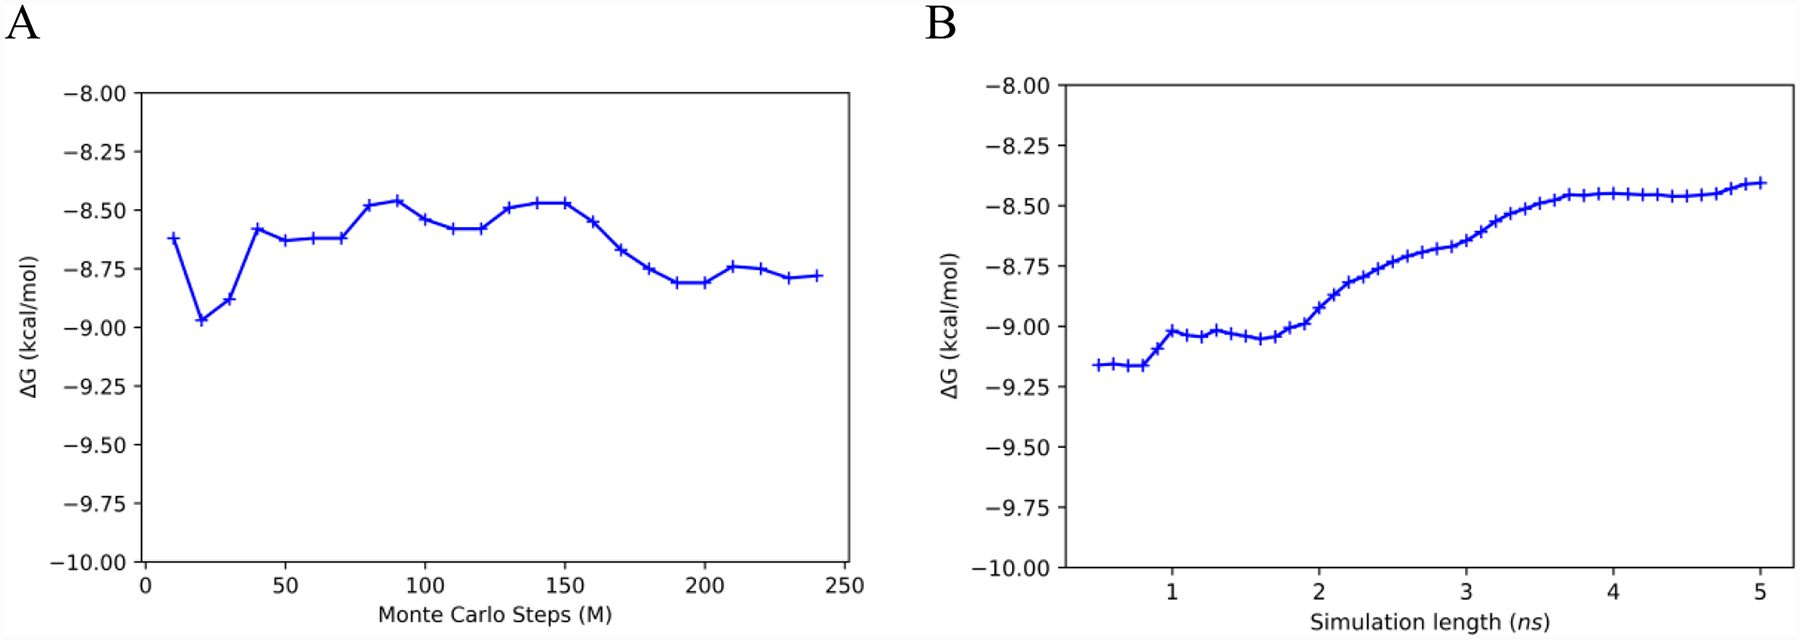
Evolution of the free energy of binding with simulation length in each window for MIF180: (A) MC/FEP and (B) MD/FEP.
The simulations described here were designed to probe the convergence of each sampling method and are therefore longer than typical production runs would be. Hence, the comparison of timings and efficiency between these methods is at best qualitative at this point, and should be used as such. In the bound calculations, a single MC run of 100M configurations required 120 core-hrs in a Xeon E5–2660 as compared to 375 core-hrs for 5 ns of MD. Since NAMD is well parallelized, the wall-clock timing of a MD run can be easily reduced by using multiple cores. A single complete calculation for the bound MIF-MIF180 complex utilized 33,300 and 38,700 cpu-hrs in MC and MD simulations, respectively.
Concerning the migration of water into the binding site as the ligand disappears, Figure 10 shows the final configuration of the last λ window in the forward direction of the MD/FEP calculation. Only water molecules within 5 Å of the ghost of the ligand are shown. It is clear that water molecules penetrated well into the binding pocket during the decoupling of the bound ligand. The average numbers of water molecules within 8 Å of N06 at the center of the ligand were 3 and 18 and the beginning and end of the MC/FEP simulations, and 6 and 11 for MD/FEP.
Figure 10.
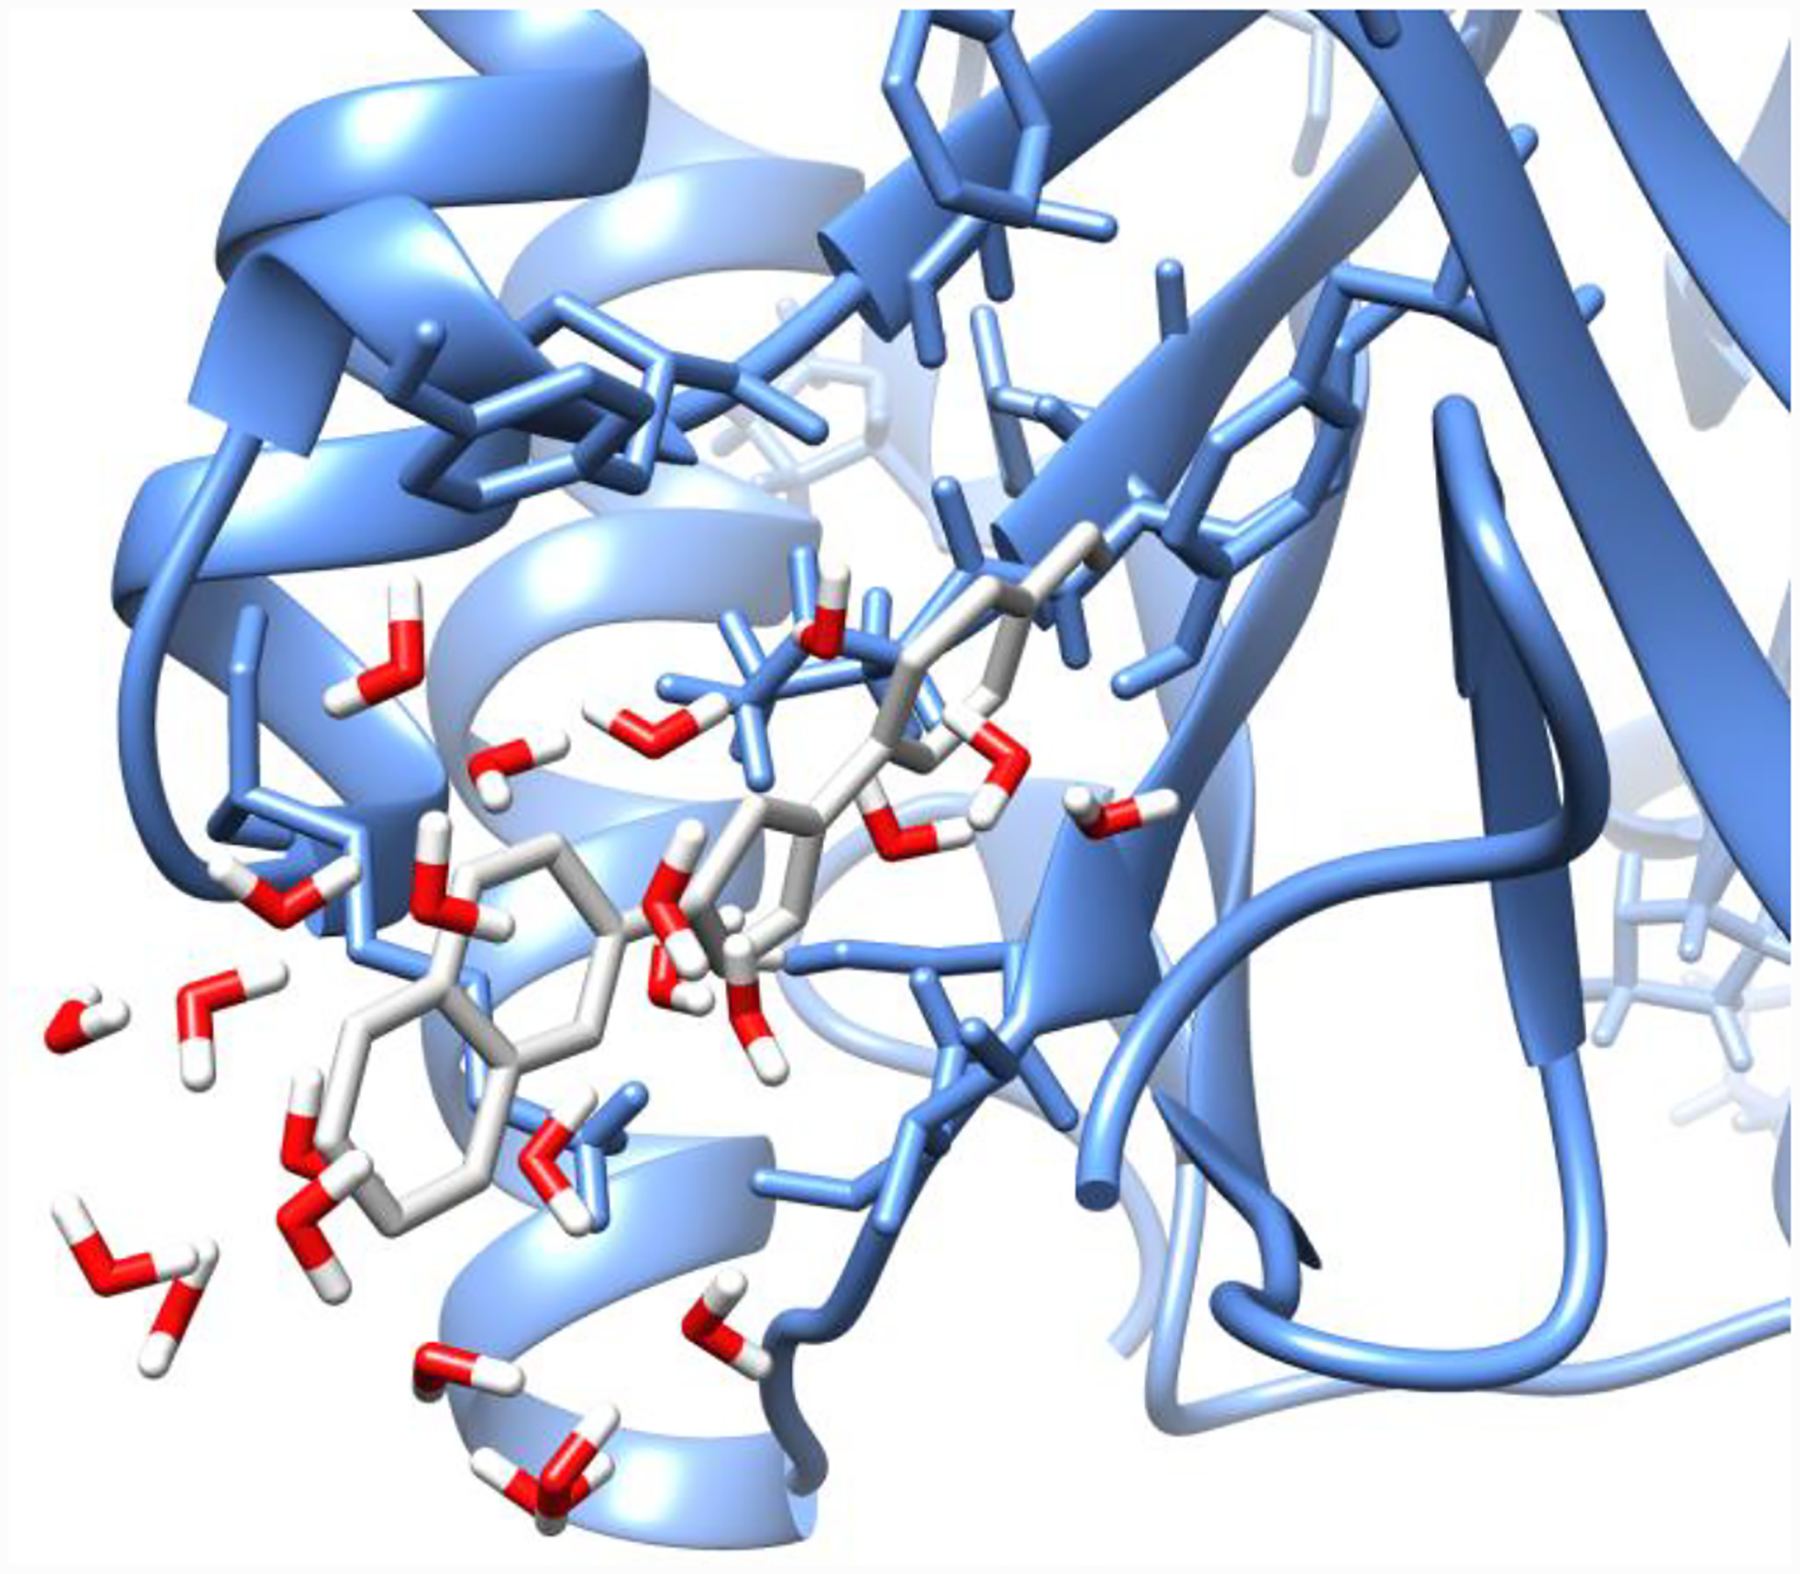
Water in binding site at the end of the MD simulation. Ghost of the ligand is in grey.
MD Results for the Four Force Fields and the Protonation State for Proline 1.
The MD simulations for ΔGb were performed in the same way with the other three force fields. Furthermore, in order to investigate the preferred protonation state for Pro1 of MIF in the complex, the FEP calculations were also performed with Pro1 protonated in all three MIF monomers. The results of the ΔGb calculations with the four force fields are summarized in Table 3 for MIF180/MIF with and without the protonated N-terminal proline. As mentioned above, additional conformational restraint of the ligand to the syn conformation was needed for the simulations with Pro1 protonated using the AMBER/GAFF force field. The results for ΔGbind are clearly very sensitive to both the choice of force field and protonation state for Pro1. In all cases, ΔGbind is more favorable with neutral Pro1 and closer to the experimental result of −8.98 ± 0.28 kcal/mol.30 The OPLS/CM5, OPLS/CM1A, and AMBER/GAFF results strongly support the assignment of Pro1 as neutral. The 2.3-kcal/mol spread of ΔGbind results with neutral Pro1 from these three alternative force fields is probably a reasonable reflection of the current state of the art. Expecting 1 kcal/mol accuracy from any given fixed-charge force field on a specific complex of a protein with a drug-like ligand is overly optimistic. The results with CHARMM/CGenFF are an outlier. It is difficult to trace the origin of the problem, but it may reflect the strong variation in partial atomic charges shown in Table 2 or uncertainties about the quality of some of the torsional parameters noted by the on-line server.28 In any event, it would be premature to draw general conclusions about the force fields. For the OPLS force fields, there is no particular reason to favor the use of 1.20*CM5 over 1.14*CM1A charges based on results for pure organic liquids and free energies of hydration,38 so the results with CM5 may just be fortunate and unique in this case.
Table 3.
MD Results for Absolute Free Energies of Binding (ΔGbind, kcal/mol) with Pro1 Neutral or Protonated
| OPLS/CM5 | OPLS/CM1A | CHARMM/CGenFF | AMBER/GAFF | |
|---|---|---|---|---|
| Neutral | −8.46 ± 0.85 | −6.20 ± 0.41 | −2.37 ± 1.27 | −7.47 ± 0.99 |
| Protonated | −3.53 ± 0.76 | −0.17 ± 1.22 | −2.04 ± 1.04 | −2.92 ± 0.26 |
Structural Analyses.
The crystal structure of the complex features multiple aryl-aryl interactions and hydrogen bonds as indicated in Figures 1 and 11. The phenolic hydroxyl group is hydrogen bonded with Asn97C (r(OO) = 2.52 Å), and the triazole N2 with Ile64A (r(NN) = 2.90 Å). Also, the quinoline N, triazole N3 and backbone O of Ile64A (r(NN) = 3.33 Å, r(NN) = 2.95 Å, r(NO) = 2.81 Å) are hydrogen-bonded to the ammonium nitrogen of Lys32A.22 For comparison with the MD results in TIP3P water, the five hydrogen-bond distances were averaged over the final 10 ns of the MD trajectories for the fully formed complexes. The average intermolecular hydrogen-bond distances designated in Figure 11 are compared in Table 4 from the simulations with Pro1 unprotonated. Histograms for the hydrogen-bond distances showing the sampled ranges with the four force fields are provided in Supplementary Figure S2.
Figure 11.
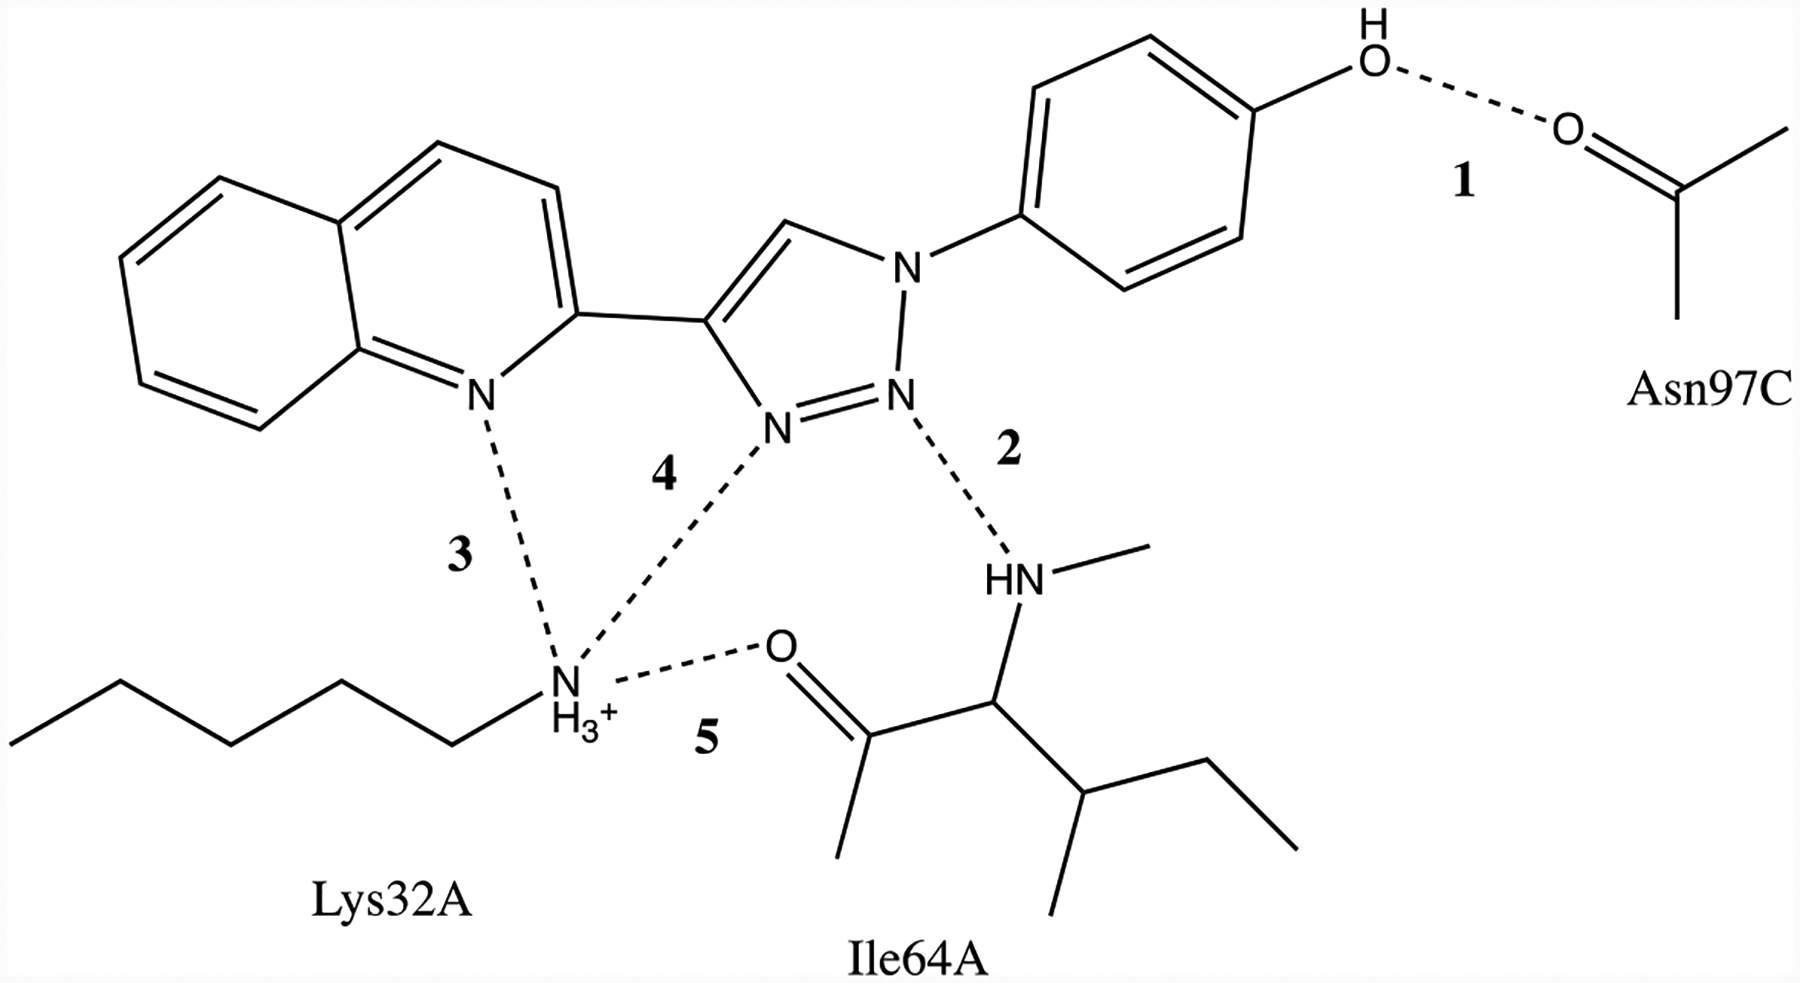
Intermolecular hydrogen bonds in the MIF-180 complex.
Table 4.
Average Hydrogen-Bond Distances Computed Using Different Force Fields (Å)
| Crystala | OPLS/CM5 | OPLS/CM1A | CHARMM/CGenFF | AMBER/GAFF | |
|---|---|---|---|---|---|
| 1-r(OO) | 2.52 | 2.72 | 2.81 | 2.84 | 2.69 |
| 2-r(NN) | 2.90 | 3.12 | 4.88 | 4.56 | 3.06 |
| 3-r(NN) | 3.33 | 4.61 | 5.02 | 7.02 | 3.50 |
| 4-r(NN) | 2.95 | 4.47 | 4.67 | 5.83 | 3.47 |
| 5-r(NO) | 2.81 | 3.02 | 3.34 | 4.02 | 2.92 |
Ref. 22.
The shortest average protein-ligand contacts are found for OPLS/CM5 and AMBER/GAFF, which is consistent with their most favorable ΔGbind results (Table 3). All of the force fields yield a hydrogen bond between the phenolic hydroxyl group and Asn97C, and a short contact for the Lys32A ammonium group and the oxygen atom of Ile64A, in agreement with the crystal structure. However, the predictions for the three N…N hydrogen bonds are varied. While AMBER/GAFF retains the three hydrogen bonds, the other three force fields do not to different degrees. The most separated structure is found for CHARMM/GenFF, which is consistent with its overly weak ΔGbind in Table 3. OPLS/CM5 retains the hydrogen bond between the triazole N2 and the backbone NH of Ile64A, while the coordination of the Lys32A ammonium group with N3 of the triazole and the quinoline nitrogen atom is weakened. This may be reasonable since Lys32A is at the entrance to the binding site and is largely solvent-exposed. There are also interprotein contacts in this region in the crystal structures,22 which provide for some exclusion of water and may lead to differences in structure for the crystal and dilute aqueous solution.
The corresponding results with Pro1 protonated are provided in Supplementary Table S3 and Figure S2. In this case, the ligand is much more separated from the protein. Basically, all of the hydrogen bonds are broken except for the one with the phenolic oxygen atom with OPLS/CM1A, CHARMM/CGenFF, and AMBER/GAFF.
CONCLUSION
Computation of the absolute free energy of binding (ΔGbind) for the complex of a drug-like ligand, MIF180, and human MIF has been investigated with both Monte Carlo statistical mechanics and molecular dynamics using double decoupling and four current fixed-charge force fields. Both MC and MD protocols were devised that yielded well converged ΔGbind values, though more efficient protocols using fewer λ-windows may be possible.54 The MC/FEP protocol with improved sampling techniques20 and the OPLS/CM5 force field performed well and gave an accurate estimate for ΔGbind in comparison to the experimental data. It was confirmed that a very similar result is obtained using the same force field in molecular dynamics simulations with the NAMD program. The MD/FEP calculations were then carried out for three additional force fields OPLS/CM1A, CHARMM 36 with CGenFF, and AMBER ff14sb with GAFF. The results for ΔGbind notably cover a 6 kcal/mol range, though three of the results are within 2.2 kcal/mol (Table 3). Significant differences in the computed structures for the complexes are also found with the general observation that shorter average protein-ligand contacts do correlate with more negative ΔGbind values. Many additional studies of this type are needed to make such computations more routine, to identify optimal protocols, and to reveal unambiguously any problematic issues for current force fields and sampling methods. It is proposed that human MIF is a good test system for such work owing to its moderate size and to the availability of multiple high-resolution crystal structures as well as accurate binding data for numerous, diverse inhibitors.21,22,30
Supplementary Material
Acknowledgements
This work was supported by the National Institutes of Health (GM32136). Computational resources were provided by the Yale University Faculty of Arts and Sciences High-Performance Computing Center.
Footnotes
Supporting Information. This information is available free of charge on the ACS Publications website at http://pubs.acs.org. It consists of a pdf file showing the atom label assignments for MIF180, averages and histograms of hydrogen-bond distances for the complexes, free energy evolution of the LJ MC windows, and full comparison of ligand atomic charges. In addition, a zip archive containing the pdb, psf, and prm files needed to run the ligand MD calculations with all four force fields is provided.
The authors declare no competing financial interest.
REFERENCES:
- 1.Chodera JD; Mobley DL; Shirts MR; Dixon RW; Branson K; Pande VS Alchemical Free Energy Methods for Drug Discovery: Progress and Challenges. Curr. Opin. Struct. Biol 2011, 21, 150–160. [DOI] [PMC free article] [PubMed] [Google Scholar]
- 2.Jorgensen WL Computer-Aided Discovery of Anti-HIV Agents. Bioorg. Med. Chem 2016, 24, 4768–4788. [DOI] [PMC free article] [PubMed] [Google Scholar]
- 3.Mobley DL; Gilson MK Predicting Binding Free Energies: Frontiers and Benchmarks. Ann. Rev. Biophys 2017, 46, 531–558. [DOI] [PMC free article] [PubMed] [Google Scholar]
- 4.Abel R; Wang L; Mobley DL; Friesner RA A Critical Review of Validation, Blind Testing, and Real-World Use of Alchemical Protein-Ligand Binding Free Energy Calculations. Curr. Top. Med. Chem 2017, 17, 1–9. [DOI] [PubMed] [Google Scholar]
- 5.Cournia Z; Allen B; Sherman W Relative Binding Free Energy Calculations in Drug Discovery: Recent Advances and Practical Considerations. J. Chem. Inf. Model 2017, 57, 2911–2937. [DOI] [PubMed] [Google Scholar]
- 6.Wang L; Wu Y; Deng Y; Kim B; Pierce L; Krilov G; Lupyan D; Robinson S; Dahlgren MK; Greenwood J; et al. Accurate and Reliable Prediction of Relative Protein-Ligand Binding Affinities via Free Energy Calculations: Validation in Prospective Drug Discovery. J. Am. Chem. Soc 2015, 137, 2695–2703. [DOI] [PubMed] [Google Scholar]
- 7.Sliwoski G; Kothiwale S; Meiler J; Lowe EW Jr Computational Methods in Drug Discovery. Pharmacol. Rev 2014, 66, 334–395. [DOI] [PMC free article] [PubMed] [Google Scholar]
- 8.Jorgensen WL; Buckner JK; Boudon S; Tirado‐Rives J Efficient Computation of Absolute Free Energies of Binding by Computer Simulations. Application to the Methane Dimer in Water. J. Chem. Phys 1988, 89, 3742–3746. [Google Scholar]
- 9.Cieplak P; Kollman PA Calculation of the Free Energy of Association of Nucleic Acid Bases in Vacuo and Water Solution. J. Am. Chem. Soc 1988, 110, 3734–3739. [Google Scholar]
- 10.Gilson MK; Given JA; Bush BL; McCammon JA The Statistical-Thermodynamic Basis for Computation of Binding Affinities: A Critical Review. Biophys. J 1997, 72, 1047–1069. [DOI] [PMC free article] [PubMed] [Google Scholar]
- 11.Deng Y; Roux B Calculation of Standard Binding Free Energies: Aromatic Molecules in the T4 Lysozyme L99A Mutant. J. Chem. Theory Comput 2006, 2, 1255–1273. [DOI] [PubMed] [Google Scholar]
- 12.Boresch S; Tettinger F; Leitgeb M; Karplus M Absolute Binding Free Energies: A Quantitative Approach for Their Calculation. J. Phys. Chem. B 2003, 107, 9535–9551. [Google Scholar]
- 13.Gaieb Z; Liu S; Gathiaka S; Chiu M; Yang H; Shao C; Feher VA; Walters WP; Kuhn B; Rudolph MG; et al. D3R Grand Challenge 2: Blind Prediction of Protein-Ligand Poses, Affinity Rankings, and Relative binding free energies. J. Comput. Aided Mol. Design 2018, 32, 1–20. [DOI] [PMC free article] [PubMed] [Google Scholar]
- 14.Abraham MJ; Murtola T; Schulz R; Páll S; Smith JC; Hess B; Lindah E Gromacs: High Performance Molecular Simulations through Multi-Level Parallelism from Laptops to Supercomputers. SoftwareX 2015, 1–2, 19–25. [Google Scholar]
- 15.Case DA; Cheatham TE; Darden T; Gohlke H; Luo R; Merz KM; Onufriev A; Simmerling C; Wang B; Woods RJ The Amber Biomolecular Simulation Programs. J. Comput. Chem 2005, 26, 1668–1688. [DOI] [PMC free article] [PubMed] [Google Scholar]
- 16.Phillips JC; Braun R; Wang W; Gumbart J; Tajkhorshid E; Villa E; Chipot C; Skeel RD; Kale L; Schulten K Scalable Molecular Dynamics with NAMD. J. Comput. Chem 2005, 26, 1781–1802. [DOI] [PMC free article] [PubMed] [Google Scholar]
- 17.Brooks BR; Brooks CL III; Mackerell AD Jr.; Nilsson L; Petrella RJ; Roux B; Won Y; Archontis G; Bartels C; Boresch S; et al. CHARMM: The Biomolecular Simulation Program B. J. Comput. Chem 2009, 30, 1545–1614. [DOI] [PMC free article] [PubMed] [Google Scholar]
- 18.Eastman P; Friedrichs MS; Chodera JD; Radmer RJ; Bruns CM; Ku JP; Beauchamp KA; Lane TJ; Wang LP; Shukla D; et al. OpenMM 4: A Reusable, Extensible, Hardware Independent Library for High Performance Molecular Simulation. J. Chem. Theory Comput 2013, 9, 461–469. [DOI] [PMC free article] [PubMed] [Google Scholar]
- 19.Jorgensen WL; Tirado-Rives J Monte Carlo vs Molecular Dynamics for Conformational Sampling. J. Phys. Chem 1996, 100, 14508–14513. [Google Scholar]
- 20.Cabeza de Vaca I; Qian Y; Vilseck JZ; Tirado-Rives J; Jorgensen WL Enhanced Monte Carlo Methods for Modeling Proteins Including Computation of Absolute Free Energies of Binding. J. Chem. Theory Comput 2018, 14, 3279–3288. [DOI] [PMC free article] [PubMed] [Google Scholar]
- 21.Trivedi-Parmar V; Robertson MJ; Cisneros JA; Krimmer SG; Jorgensen WL Optimization of Pyrazoles as Phenol Surrogates to Yield Potent Inhibitors of Macrophage Migration Inhibitory Factor. Chem. Med. Chem 2018, 13, 1092–1097. [DOI] [PMC free article] [PubMed] [Google Scholar]
- 22.Dziedzic P; Cisneros JA; Robertson MJ; Hare AA; Danford NE; Baxter RHG; Jorgensen WL; Nadia E; Baxter RHG; Jorgensen WL Design, Synthesis, and Protein Crystallography of Biaryltriazoles as Potent Tautomerase Inhibitors of Macrophage Migration Inhibitory Factor. J. Am. Chem. Soc 2015, 137, 2996–3003. [DOI] [PMC free article] [PubMed] [Google Scholar]
- 23.Robertson MJ; Tirado-Rives J; Jorgensen WL Improved Peptide and Protein Torsional Energetics with the OPLS-AA Force Field. J. Chem. Theory Comput 2015, 11, 3499–3509. [DOI] [PMC free article] [PubMed] [Google Scholar]
- 24.Robertson MJ; Qian Y; Robinson MC; Tirado-Rives J; Jorgensen WL Development and Testing of the OPLS-AA/M Force Field for RNA. J. Chem. Theory Comput 2019, 15, 2734–2742. [DOI] [PMC free article] [PubMed] [Google Scholar]
- 25.Dodda LS; Cabeza de Vaca I; Tirado-Rives J; Jorgensen WL LigParGen Web Server: An Automatic OPLS-AA Parameter Generator for Organic Molecules. Nucl. Acids Res 2017, 45, W331–W336. [DOI] [PMC free article] [PubMed] [Google Scholar]
- 26.Best RB; Xiao Zhu X; Shim J; Lopes P; Mittal J; Feig M; MacKerell AD Jr.;Optimization of the Additive CHARMM All-Atom Protein Force Field Targeting Improved Sampling of the Backbone Phi, Psi, and Side Chain Chi1 and Chi2 Dihedral Angles. J. Chem. Theory Comput 2012, 8, 3257–3273. [DOI] [PMC free article] [PubMed] [Google Scholar]
- 27.Maier JA; Martinez C; Kasavajhala K; Wickstrom L; Hauser KE; Simmerling C Ff14SB: Improving the Accuracy of Protein Side Chain and Backbone Parameters from Ff99SB. J. Chem. Theory Comput 2015, 11, 3696–3713. [DOI] [PMC free article] [PubMed] [Google Scholar]
- 28.Vanommeslaeghe K; Hatcher E; Acharya C; Kundu S; Zhong S; Shim J; Darian E; Guvench O; Lopes P; Vorobyov I; et al. CHARMM General Force Field: A Force Field for Drug-like Molecules Compatible with the CHARMM All-Atom Additive Biological Force Fields. J. Comput. Chem 2009, 31, 671–690. [DOI] [PMC free article] [PubMed] [Google Scholar]
- 29.Wang J; Wolf RM; Caldwell JW; Kollman PA; Case DA Development and Testing of a General Amber Force Field. J Comput Chem 2004, 25, 1157–1174. [DOI] [PubMed] [Google Scholar]
- 30.Cisneros JA; Robertson MJ; Valhondo M; Jorgensen WL A Fluorescence Polarization Assay for Binding to Macrophage Migration Inhibitory Factor and Crystal Structures for Complexes of Two Potent Inhibitors. J. Am. Chem. Soc 2016, 138, 8630–8638. [DOI] [PMC free article] [PubMed] [Google Scholar]
- 31.Fu H; Cai W; Hénin J; Roux B; Chipot C New Coarse Variables for the Accurate Determination of Standard Binding Free Energies. J. Chem. Theory Comput 2017, 13, 5173–5178. [DOI] [PubMed] [Google Scholar]
- 32.Woo HH-J; Roux B Calculation of Absolute Protein-Ligand Binding Free Energy from Computer Simulations. Proc. Natl. Acad. Sci 2005, 102, 6825–6830. [DOI] [PMC free article] [PubMed] [Google Scholar]
- 33.Gumbart JC; Roux B; Chipot C Standard Binding Free Energies from Computer Simulations: What Is the Best Strategy? J. Chem. Theory Comput 2013, 9, 794–802. [DOI] [PMC free article] [PubMed] [Google Scholar]
- 34.Gumbart JC; Roux B; Chipot C Efficient Determination of Protein–Protein Standard Binding Free Energies from First Principles. J. Chem. Theory Comput 2013, 9, 3789–3798. [DOI] [PMC free article] [PubMed] [Google Scholar]
- 35.Wang J; Deng Y; Roux B Absolute Binding Free Energy Calculations Using Molecular Dynamics Simulations with Restraining Potentials. Biophys J 2006, 91, 2798–2814. [DOI] [PMC free article] [PubMed] [Google Scholar]
- 36.Fiorin G; Klein ML; Hénin J Using Collective Variables to Drive Molecular Dynamics Simulations. Mol. Phys 2013, 111, 3345–3362. [Google Scholar]
- 37.Fu H; Gumbart JC; Chen H; Shao X; Cai W; Chipot C BFEE: A User-Friendly Graphical Interface Facilitating Absolute Binding Free-Energy Calculations. J. Chem. Inf. Model 2018, 58, 556–560. [DOI] [PMC free article] [PubMed] [Google Scholar]
- 38.Dodda LS; Vilseck JZ; Cutrona KJ; Jorgensen WL Evaluation of CM5 Charges for Nonaqueous Condensed-Phase Modeling. J. Chem. Theory Comput 2015, 11, 42734282. [DOI] [PMC free article] [PubMed] [Google Scholar]
- 39.Wang J; Wang W; Kollman PA; Case DA Automatic Atom Type and Bond Type Perception in Molecular Mechanical Calculations. J. Mol. Graph. Model 2006, 25, 247–260. [DOI] [PubMed] [Google Scholar]
- 40.Gordon JC; Myers JB; Folta T; Shoja V; Heath LS; Onufriev A H++: A Server for Estimating pKas and Adding Missing Hydrogens to Macromolecules. Nucleic Acids Res. 2005, 33, W368–W371. [DOI] [PMC free article] [PubMed] [Google Scholar]
- 41.Anandakrishnan R; Aguilar B; Onufriev AV H++ 3.0: Automating pK Prediction and the Preparation of Biomolecular Structures for Atomistic Molecular Modeling and Simulations. Nucleic Acids Res. 2012, 40, W537–W541. [DOI] [PMC free article] [PubMed] [Google Scholar]
- 42.Søndergaard CR; Olsson MHM; Rostkowski M; Jensen JH Improved Treatment of Ligands and Coupling Effects in Empirical Calculation and Rationalization of p K a Values. J. Chem. Theory Comput 2011, 7, 2284–2295. [DOI] [PubMed] [Google Scholar]
- 43.Olsson MHM; Søndergaard CR; Rostkowski M; Jensen JH PROPKA3: Consistent Treatment of Internal and Surface Residues in Empirical p K a Predictions. J. Chem. Theory Comput 2011, 7, 525–537. [DOI] [PubMed] [Google Scholar]
- 44.Jorgensen WL; Thomas LL Perspective on Free-Energy Perturbation Calculations for Chemical Equilibria. J. Chem. Theory Comput 2008, 4, 869–876. [DOI] [PMC free article] [PubMed] [Google Scholar]
- 45.Steinbrecher T; Mobley DL; Case DA Nonlinear Scaling Schemes for Lennard-Jones Interactions in Free Energy Calculations. J. Chem. Phys 2007, 127, 214108. [DOI] [PubMed] [Google Scholar]
- 46.Mobley DL; Chodera JD; Dill KA On the Use of Orientational Restraints and Symmetry Corrections in Alchemical Free Energy Calculations. J. Chem. Phys 2006, 125, 084902. [DOI] [PMC free article] [PubMed] [Google Scholar]
- 47.Deng Y; Roux B Computations of Standard Binding Free Energies with Molecular Dynamics Simulations. J. Phys. Chem. B 2009, 113, 2234–2246. [DOI] [PMC free article] [PubMed] [Google Scholar]
- 48.Jorgensen WL; Chandrasekhar J; Madura JD; Impey RW; Klein ML Comparison of Simple Potential Functions for Simulating Liquid Water. J. Chem. Phys 1983, 79, 926–935. [Google Scholar]
- 49.van Gunsteren WF; Berendsen HJC A Leap-Frog Algorithm for Stochastic Dynamics. Mol. Simul 1988, 1, 173–185. [Google Scholar]
- 50.Ryckaert JP; Ciccotti G; Berendsen HJC Numerical Integration of the Cartesian Equations of Motion of a System with Constraints: Molecular Dynamics of n-Alkanes. J. Comput. Phys 1977, 23, 327–341. [Google Scholar]
- 51.Darden T; York D; Pedersen L Particle Mesh Ewald: An N ·log N. Method for Ewald Sums in Large Systems. J. Chem. Phys 1993, 98, 10089–10092. [Google Scholar]
- 52.Essmann U; Perera L; Berkowitz ML; Darden T; Lee H; Pedersen LG A Smooth Particle Mesh Ewald Method. J. Chem. Phys 1995, 103, 8577–8593. [Google Scholar]
- 53.Perez A; Morrone JA; Simmerling C; Dill KA Advances in Free-Energy-Based Simulations of Protein Folding and Ligand Binding. Curr. Opin. Struct. Biol 2016, 36, 25–31. [DOI] [PMC free article] [PubMed] [Google Scholar]
- 54.Cabeza de Vaca I; Zarzuela R; Tirado-Rives J; Jorgensen WL Robust FEP Protocols for Creating Molecules in Solution. J. Chem. Theory Comput 2019, 15, 3941–3948. [DOI] [PMC free article] [PubMed] [Google Scholar]
Associated Data
This section collects any data citations, data availability statements, or supplementary materials included in this article.


