

Abstract
Gene expression is an inherently stochastic process 1,2; however, organismal development and homeostasis require that cells spatiotemporally coordinate the expression of large sets of genes. Coexpressed gene pairs in metazoans often reside in the same chromosomal neighborhood, with gene pairs representing 10% - 50% of all genes depending on species 3–6. As shared upstream regulators can ensure correlated gene expression, the selective advantage of maintaining adjacent gene pairs remains unknown 6. Here, using two linked zebrafish segmentation clock genes, her1 and her7, and combining single-cell transcript counting, genetic engineering, real-time imaging and computational modeling, we reveal that gene pairing boosts correlated transcription and provides phenotypic robustness for developmental pattern formation. Our results demonstrate that disrupting gene pairing disrupts oscillations and segmentation, identifying the selective pressure retaining correlated transcription to sustain a robust and rapid developmental clock. We anticipate that these findings will inspire investigating advantages of gene pairing in other systems and engineering precise synthetic clocks in embryos and organoids.
The subdivision of the anterior-posterior axis into a fixed number of repeating units, known as somites, is a prime example of how coordinated gene expression patterns the vertebrate embryo. During somitogenesis, groups of cells sequentially and synchronously commit to segmentation in a remarkably short time-frame. The pace of segmentation is set by the period of an oscillator, the segmentation clock, which is active in cells of the unsegmented presomitic mesoderm (PSM; Fig. 1a). Oscillatory expression of the Hes/her clock genes is conserved in vertebrates; disruption in this oscillatory expression results in vertebral segmentation defects (e.g., congenital scoliosis in humans)7. At the conclusion of each clock cycle (~30 min in zebrafish), a cohort of ~200 cells bud from the unsegmented PSM to form a new somite (Fig. 1a). To form the full-length body axis, segmentation is carried out for a species-specific number of cycles (33 in zebrafish). The segmentation clock relies on a transcriptional negative feedback loop 8–12. In zebrafish, two paired clock genes (her1 and her7) are separated by a 12kb regulatory sequence (Fig. 1b). Her1 and Her7 function as hetero- or homo-dimers that repress their own transcription. her1 and her7 have similar transcriptional time delays 13 and RNA half-lives 9; therefore, transcription of her1 and her7 is chiefly concomitant in the PSM. To achieve the rapid tempo and reproducible precision of segmentation, transcription of her1 and her7 should be tightly coordinated.
Fig. 1 |. Negative feedback loop drives correlated transcription.
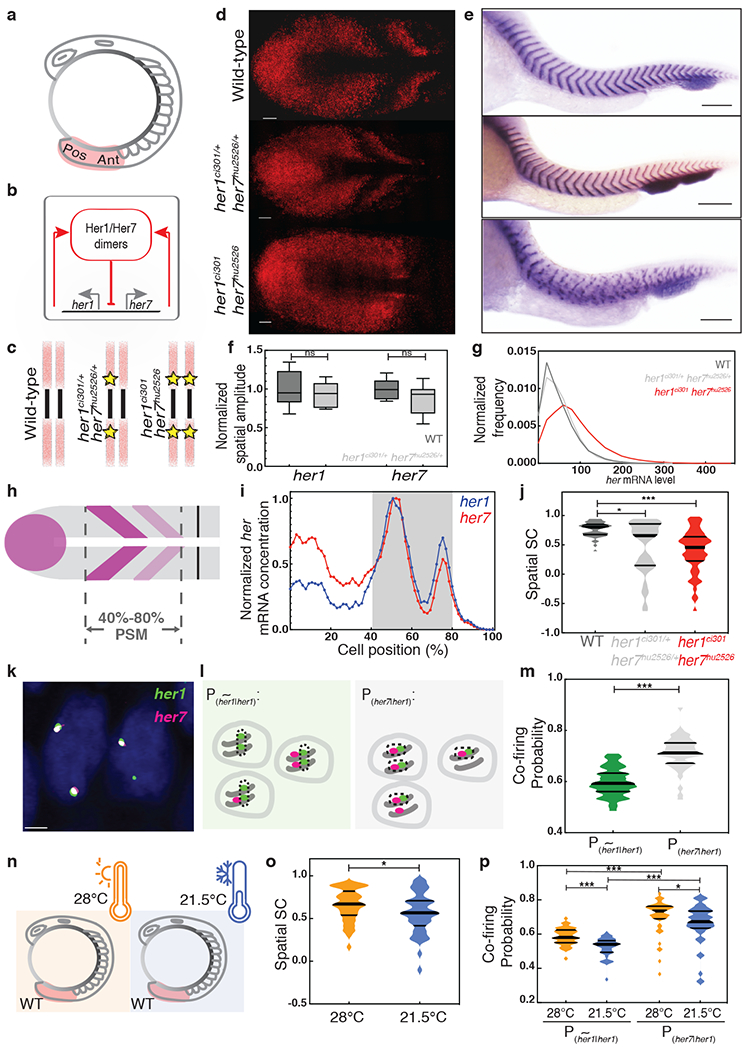
a, Posterior (Pos) and anterior (Ant) ends of the PSM (pink). b, The segmentation clock network. c, Yellow stars mark mutant genes. d, Transcription of her7 in three genotypes. Scale bar, 30 μm. e, xirp2a ISH staining marks segment boundaries. Scale bar, 100 μm. N=3. f, Spatial amplitudes of oscillations assessed by independent samples two-sided t-test with Bonferroni correction, her1 p = 0.98, her7 p = 0.24. The box spans the interquartile range, line labels median, the whiskers extend to maximal and minimal observations. g, Total her (her1+her7) RNA per cell. d, f, g, Wild-type (n=24, N=2), her1ci301/+ her7hu2526/+ (n=18, N=2) and her1ci301 her7hu2526 (n=28, N=2) embryos. h, her1/her7 waves in 40%-80% of PSM. i, Normalized profile of mean her1 (blue) and her7 (red) RNAs in a wild-type embryo. j, SSC scores of her1/her7 assessed by the two-sided Mann-Whitney U test with Bonferroni correction (wild-type, her1ci301/+ her7hu2526/+, p = 0.024; wild-type, her1ci301 her7hu2526, p = 1.127x10⁻⁸). k, Nascent transcription loci of her1 and her7 in cells located at the anterior stripe of a wild-type embryo. Scale bar, 2 μm. n=24, N=2. l, m, Black dashes circle loci contributing to quantification. and P(her7|her1) are compared by the two-sided Mann-Whitney U test. p =5.803x10⁻¹². n, o, SSC scores of her1/her7 in wild-type embryos raised at 21.5°C (blue) or 28°C (orange) as assessed by the two-sided Mann-Whitney U test. p=0.041. p, Probabilities assessed by the two-sided Mann-Whitney U test with Bonferroni correction. Median is thick line, and 25% and 75% are thin black lines. 21.5°C, 28°C , p = 1.745x10⁻⁶; 21.5°C, 28°C P(her7|her1), p = 0.048; 28°C , P(her7|her1), p = 2.489x10⁻⁹; 21.5°C , P(her7|her1), p = 7.458x10⁻¹⁰, *, p≤0.05; ***, p≤0.001, n is embryo number, N is independent experiment.
To quantify her1 and her7 transcripts in single cells, we performed high-resolution single-molecule fluorescence in situ hybridization (smFISH). Consistent with our previous findings 14, we affirmed that segmentation clock genes display very low transcriptional amplitude (46 ± 3 her1 and 57 ± 2 her7 RNA molecules, Extended Data Fig. 1a–f, Supplementary Table 1, Methods). As segmentation clock RNAs and proteins are short-lived (t1/2 = 3–5 min) 9,11, temporal averaging cannot be used to reduce gene expression variability, resulting in a highly variable (noisy) biological clock 14. To determine the degree of her1 and her7 coexpression in the PSM, we calculated the Spearman correlation (SC) and Pearson correlation (PC) scores of her1 and her7 transcription in the region where they display characteristic oscillatory kinematic waves (i.e., between 40%−80% of PSM, Fig. 1d,i). This analysis revealed that her1 and her7 have a high transcriptional correlation (mean SC=0.76, Extended Data Fig. 1g). These observations raise two important questions: (1) What mechanism drives the highly correlated transcription of the two clock genes? (2) Is the correlated transcription of two clock genes under selection pressure (i.e., beneficial for development)? In this study, we explicitly investigated the impact of two mechanisms on the correlated transcription of her1 and her7: (1) negative feedback by the Her1/Her7 repressors and (2) gene pairing (i.e., chromosomal adjacency/linkage of her1 and her7 genes).
As Her1/Her7 proteins autoinhibit their own transcription, one obvious source of correlated transcription of her1/her7 could be this shared upstream regulation. To test this hypothesis and discern the role of negative feedback loops in controlling correlated transcription, we used genome editing to generate a double her1ci301 her7 hu2526 homozygote mutant by deleting two base pairs of her1 coding sequence in the her7hu2526 mutant15 (Extended Data Fig. 1h). Whereas double heterozygous mutants successfully segment all somites, the oscillatory waves of clock transcription and segmentation are disrupted in mutant embryos; similar to previously published mutants16,17 (Fig. 1c–e, Extended Data Fig. 2a–c). As our smFISH probes do not distinguish between wild-type and mutant her1/her7 RNAs, we found that the transcriptional amplitude of oscillations (Fig. 1f, t(18)=0.7, p=0.98 for her1 and t(18)=1.7, p=0.24 for her7) and the distribution of RNA counts (Fig. 1g, mean = 49 vs. 51, Supplementary Table 1, 2) were similar in wild-type and double heterozygous mutants. These results suggest that in heterozygous mutants—even though approximately half of the RNAs are non-functional—a sufficient amount of Her1/Her7 proteins are translated to maintain clock oscillations and similar RNA levels to wild-type embryos. In contrast, the mean RNA level increased by 74% in double homozygous mutant embryos compared to wild-type embryos, reflecting the loss of negative feedback regulation (Fig. 1g, mean = 49 vs. 85, Supplementary Table 1, 3). By comparing the spatial SC scores, we assessed the changes in spatial coexpression of her1 and her7 among different genotypes (Fig. 1j). The spatial SC score significantly decreased in both double homozygous and heterozygous mutants as compared to wild-type embryos (Fig. 1j, U=440, z=−5.9, p=1.127x10⁻⁸ between wild-type and double homozygous mutants; U=570, z=−2.7, p=0.024 between wild-type and double heterozygous mutants; and U=855, z=−1.2, p=0.66 between double heterozygous and homozygous mutants, see also Extended Data Fig. 3a). We confirmed this result by using a chromosomal deletion mutant covering the entire her1/her7 locus 16. The wild-type had higher SC values than heterozygous her1b567/+ her7b567/+ mutants (Extended Data Fig. 2a–f, U=392.5, z=−3.0, p=0.003, Supplementary Table 4, 5, Extended Data Fig. 3b). In summary, Her1/Her7 participate in a cell-autonomous negative feedback loop, which increases correlated transcription of her1/her7 in the PSM.
Chromosomal adjacency was previously shown to cause correlated expression of synthetic reporters 18–20; thus, we hypothesized that adjacency of her1/her7 causes their transcription to co-fire on the same chromosome, resulting in highly correlated transcript levels in wild-type embryos (Fig. 1j). To test this hypothesis, we detected nascent transcription loci in the nucleus of single cells located in stripes in the anterior PSM and measured probabilities of transcriptional co-firing of a her1 gene with its linked her7 gene on one chromosome (P(her7|her1)) versus with the second her1 on its homologous chromosome (, Fig. 1k,l; see Methods) at a given time point. We found that the probability of transcriptional co-firing of paired her1/her7 genes is significantly higher than the unpaired genes on separate chromosomes (Fig. 1m, U=212.5, z=−6.9, p=5.803x10⁻¹²). This finding demonstrated that gene pairing boosts correlated transcription of the two clock genes by facilitating transcriptional co-firing.
Robustness of a system can be tested by perturbing the environment. Temperature fluctuations are a natural environmental noise source affecting fish embryos. Although wild-type embryos successfully segment somites over a large range of temperatures21, certain zebrafish morphants and mutants show a stronger segmentation phenotype when grown at colder temperatures 12,22, but there has been no explanation for this cold sensitivity. Therefore, we investigated the impact of temperature on the coordinated transcription of her1 and her7. We found that the spatial SC score of her1/her7 was significantly lower in wild-type embryos raised at 21.5°C than 28°C (Fig. 1o, U=796, z=−2.05, p=0.041, Extended Data Fig. 3c, Supplementary Table 6, 7). The probability of transcriptional co-firing was higher when genes are located on the same chromosome than when they are located on different chromosomes at both temperatures (Fig. 1p, U=266, z=−6.2, p=2.489x10⁻⁹ for 28°C and U=242, z=−6.4, p=7.458x10⁻¹⁰ for 21.5°C). We further found that both and P(her7|her1) decreased significantly in embryos raised at 21.5°C from those at 28°C (Fig. 1p, U=411, z=−5.1, p=1.745x10⁻⁶ and U=736.5, z=−2.5, p=0.048), indicating transcriptional co-firing is temperature-dependent.
We then hypothesized that co-firing of two paired clock genes is advantageous for somite segmentation as that would coordinate transcript levels. To test this, we generated a new her1ci302 mutant carrying the same mutation described above in an otherwise wild-type background (Extended Data Fig. 1h; see Methods). We subsequently mated her1ci302 fish with her7hu2526 fish to obtain double heterozygote embryos with unpaired functional her1 and her7 genes. These embryos carried a mutant her1 gene adjacent to a wild-type her7 gene on one chromosome and a mutant her7 gene adjacent to a wild-type her1 gene on the other chromosome. Hence, fish that are compound heterozygous for these alleles will have the same functional gene dose as the previously described double heterozygous embryos with paired her1/her7 genes (Fig. 2a,b). We next raised the gene-paired and -unpaired embryos at different temperatures. At 28°C, both groups successfully segmented all their somites (Supplementary Table 8). However, at 21.5°C, there was a significant increase in somite segmentation failure in gene-unpaired embryos as compared to gene-paired embryos (Fig. 2c–f). This defect could be quantified through an increase in both the percentage of embryos with defects (Fig. 2e, 77% for gene-unpaired and 30% for gene-paired, n>130, χ2(1) = 60.3, p=8.043x10⁻¹⁵) and the severity of defects (Fig. 2f, median = 4 for gene-unpaired and 2 for gene-paired, U=4837.5, z=−5.5, p=4.878x10⁻⁸). These results revealed that maintaining paired-genes in the genome is beneficial for successful pattern formation during embryonic development under environmental stress.
Fig. 2 |. Segmentation is robust against perturbations by chromosomal linkage of two clock genes.
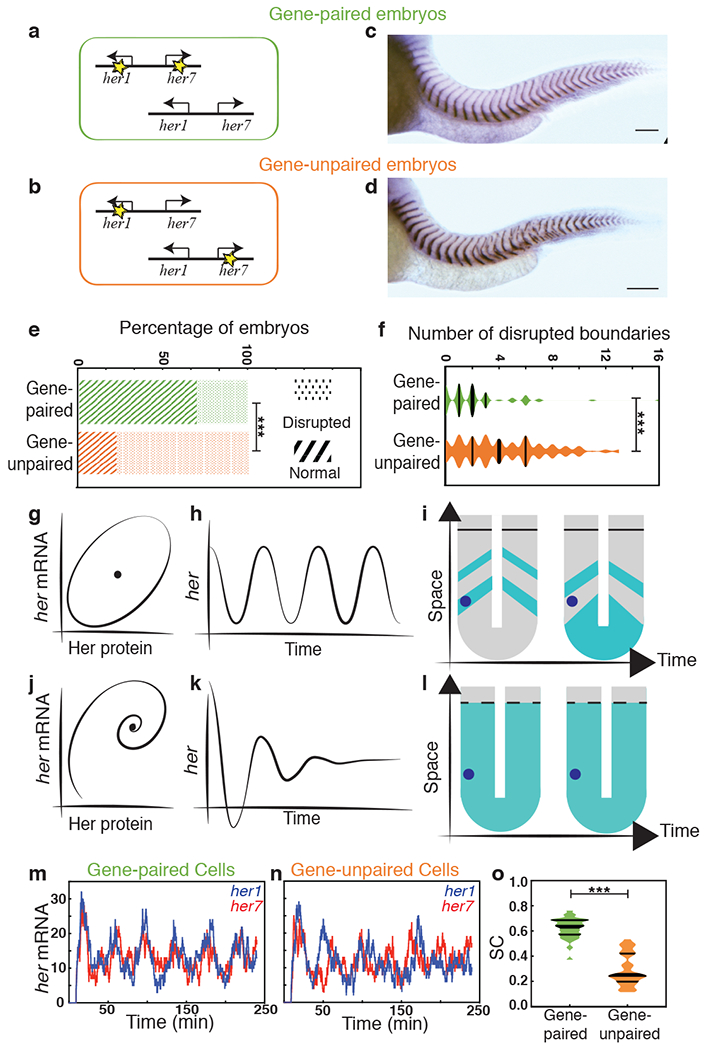
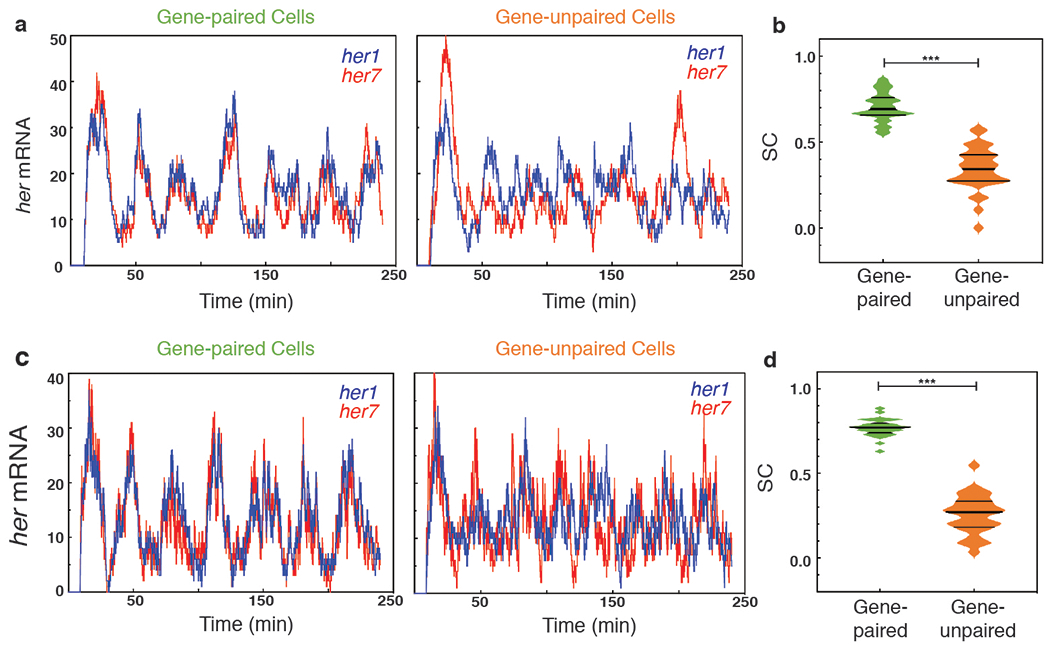
a, b, Design of gene-paired and gene-unpaired heterozygous clock mutants. Yellow stars mark mutant her1 and her7 genes. c, d, xirp2a ISH for gene-paired (c) and gene-unpaired embryos (d). Scale bar, 100 μm. N=3 e, The percentages of embryos displaying disrupted segment boundaries. Statistical significance is assessed by the two-sided chi-squared test, p = 8.043x10⁻¹⁵ f, For embryos with segmentation defects, the number of disrupted segment boundaries as assessed by the two-sided Mann-Whitney U test, p = 4.878x10⁻⁸. (e, f) n = 137 for gene-unpaired and n = 130 for gene-paired embryos. N=3 g-l, Cartoon description of sustained oscillations (g-i) versus damped oscillations (j-l), and the manifestation of them on the spatial expression profiles in the PSM. The blue dot represents a group of cells inside the PSM. m-n, Stochastic simulations of her1 (blue) and her7 (red) transcription in a single cell from gene-paired (m) or gene-unpaired embryo (n). o, SC score for temporal her1 and her7 transcription as assessed by the two-sided Mann-Whitney U test, p = 1.148x10⁻¹⁰. Median is thick line, and 25% and 75% are thin black lines; ***, p≤0.001. n is embryo number, N is independent experiment.
We next investigated the mechanism by which gene pairing is beneficial for somite segmentation. Regulatory networks containing negative-feedback loops are widespread among metazoans. However, negative-feedback loops usually do not give rise to oscillations, but instead act as a rheostat to tightly maintain the system output around a steady-state (a stable point in a phase diagram) 8,23. For a negative-feedback loop to generate oscillations, there are several important criteria to be satisfied. Experimental studies previously revealed the importance of time-delays and short RNA/protein half-lives to generate sustained oscillations7. However, there is one additional important criterion that should be satisfied to generate oscillations: overshooting the steady-state 8,23. The rate of mRNA synthesis needs to be high enough to push the system into an unstable steady-state with a periodic orbit, establishing a limit cycle in the phase diagram (Fig. 2g–i) 8,23. In this study, we found that when genes are paired on the same chromosome, co-transcription happens more frequently (Fig. 1p). We hypothesized that frequent co-firing of transcription results in a high RNA production rate, and thereby overshooting the limit-cycle threshold. When her1 and her7 are on different chromosomes, co-transcription is less frequent, which lowers the RNA accumulation rate, failing to overshoot the steady-state needed to establish a limit cycle (i.e., oscillations; Fig. 2j–l).
To test this hypothesis, we first developed a single-cell level stochastic model incorporating the negative feedback loop established by two different dimers (see Methods) 12,13,24. In this model, transcription of her1 and her7 only occur from genes free of repressor dimers. Transcription rates of her1 and her7 were kept equal to each other and between the two chromosomes. We used a random number generator to implement stochasticity in transcriptional firing. In the case of gene-paired embryos, transcription firing was determined simultaneously for both genes (in agreement with the experimental data, Fig. 1m). In contrast, for gene-unpaired embryos, transcription firing was determined separately for each gene. Alternatively, we simulated additional scenarios in which the transcriptional firing of two clock genes occurred at different rates (see Methods). Our minimal model recapitulated our observations. In all scenarios, simulations showed that correlated expression and thereby sustained oscillations of her1 and her7 occurred when two genes are paired, and less correlated expression and occasionally failed oscillations occurred when two genes are unpaired (Fig. 2m–o, U=14, z=−6.5, p=1.148x10⁻¹⁰; Extended Data Fig. 4).
To provide further experimental evidence for this mechanism, we performed smFISH experiments and found that transcription of two clock genes were less correlated in gene-unpaired than in gene-paired embryos raised at 21.5°C (Fig. 3a–c, U=993.0, z=−4.9, p=1.000x10⁻⁶, Supplementary Table 9, 10). These results agree with the computational modeling showing that less correlated expression of her1/her7 leads to defects in kinematic clock waves and indicate that the segmentation defects occurring in mutant embryos are due to the failure of sustained clock oscillations.
Fig. 3 |. Impaired oscillations of the segmentation clock underlie segmentation defects.
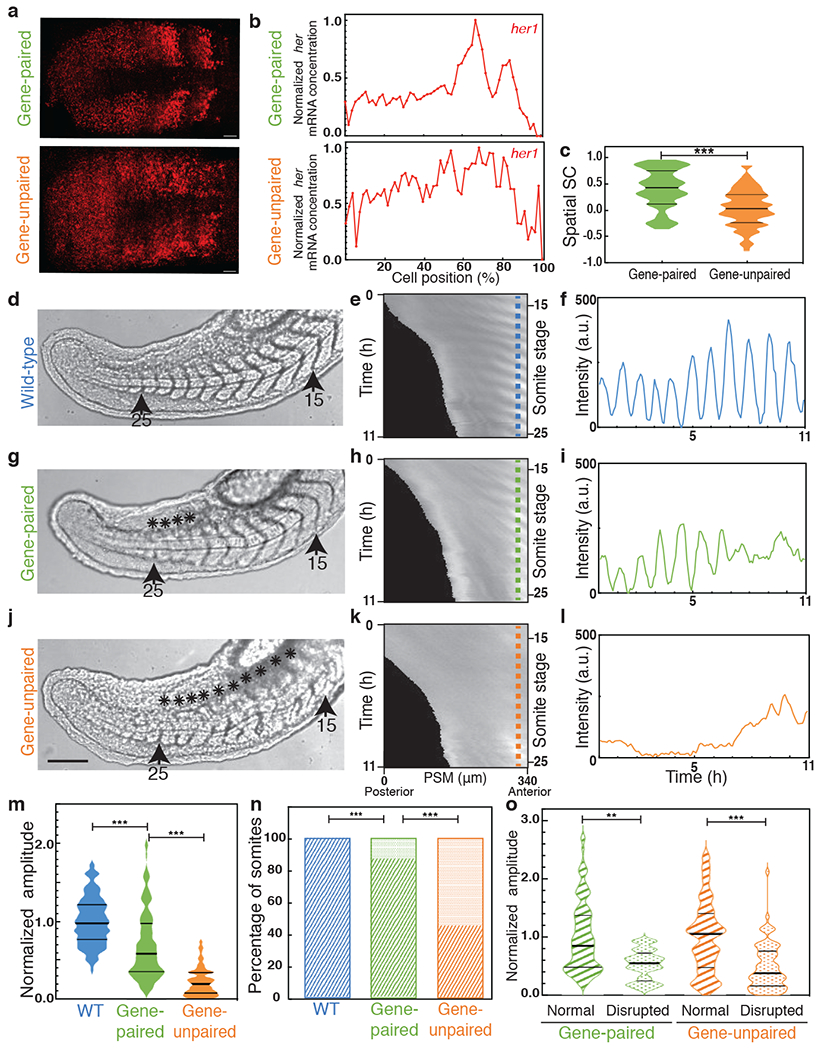
a, b, smFISH images (a) and spatial profile (b) of her1 in gene-paired (top, n=27) and gene-unpaired (bottom, n=37) embryos. Scale bar, 30 μm. N=2 c, SSC scores of her1/her7 in gene-paired and gene-unpaired embryos assessed by the two-sided Mann-Whitney U test, p = 1.000x10⁻⁶. d-l, Time-lapse imaging of wild-type (d-f), gene-paired (g-i) and gene-unpaired (j-l) embryos. Brightfield pictures of wild-type (d), gene-paired (g) and gene-unpaired (j) embryos displaying 15 to 25 somites (n=12, N=3). Scale bar, 100 μm. The asterisks mark disrupted boundaries. Her1-Venus kymographs of wild-type (e), gene-paired (h) and gene-unpaired (k) embryos from 14 to 25 somite stages (for 11 hours, y-axis) along the entire PSM (x-axis, posterior is left). Kymographs are aligned at S0 (prospective somite) at the right end. Intensity profiles at S0 (along the vertical blue, green and orange dashed lines in the kymographs) in the wild-type (f), gene-paired (i) and gene-unpaired (l) embryos. m, Average amplitude of oscillations in the wild-type (blue), gene-paired (green) and gene-unpaired (orange) embryos (normalized to wild-type amplitudes). Two-sided Mann-Whitney U test with Bonferroni correction (wild-type and gene-paired amplitude, p =9.426x10⁻¹²; gene-paired and gene-unpaired amplitude, p=5.189x10⁻²⁵) n, Percentages of normal (stripes) or defective (dots) boundaries assessed by two-sided chi-squared test with Bonferroni correction between gene-paired and unpaired embryos (p=1.606x10⁻¹²), by two-sided Fisher’s exact test with Bonferroni correction between wild-type and gene-paired, p=1.000x10⁻⁴. In total, 132 (12x11) somite boundaries are scored in each genotype. o, Average amplitude of oscillations in cycles preceding successful or defective boundaries. Median is the thick line, and 25% and 75% are thin black lines. Two-sided Mann-Whitney U test with Bonferroni correction, gene-paired group, p=2.748x10⁻³; gene-unpaired group, p=1.172x10⁻⁶, **,p≤0.01; ***, p≤0.001. n is embryo number, N is independent experiment.
To assess the function of gene pairing in the segmentation clock in real-time, we next used the Tg(her1:her1-Venus) transgenic animal in which the transcriptional regulatory regions, coding sequences, and UTRs of her1 were fused to Venus sequences then inserted into a different chromosome. This transgenic line leaves the endogenous locus intact and has been used as a reporter for the segmentation clock25. We imaged embryos carrying heterozygous her1-Venus reporter along the entire PSM from 14 to 25 somite stages (Fig. 3d, g, j; see Methods). From the kymographs, we quantified the amplitude of oscillations in the next presumptive somites at the anterior end of PSM for 11 somite cycles (n = 12 for each background; Fig. 3e,h,k). We found that the average amplitude was highest in otherwise wild-type embryos, was decreased in gene-paired embryos (60%, U=4423.5, z=−6.9, p=9.426x10⁻¹², compared to wild-type embryos), and was lowest in gene-unpaired embryos (20%, U=2264.5, z=−10.4, p=5.189x10⁻²⁵, compared to gene-paired embryos, Fig. 3f, i, l, m). We consistently found significantly more defective segment boundaries in live imaging of gene-unpaired embryos than of gene-paired embryos (n=72/132 vs. n=17/132, respectively, χ2(1)=51.3, p=1.606x10⁻¹², Fig. 3d, g, j, n). Within each genotype, the amplitudes of oscillations preceding disrupted boundaries were significantly lower than the ones preceding the successful ones (65% U=506.5, z=−3.2, p=2.748x10⁻³ in gene-paired and 36% U=1067, z=−5.0, p=1.172x10⁻⁶ in gene-unpaired embryos, Fig. 3o). In summary, gene pairing leads to transcriptional co-firing (Fig. 1p) and correlated transcription (Fig. 3c) of clock genes, which establishes a limit cycle (Fig. 2g–i) that drives oscillatory clock waves in the PSM and results in successful segmentation of somites. Unpaired functional clock genes co-transcribe less frequently, which occasionally lets the system fall into a steady-state with dampened oscillations (Fig. 2j–l), resulting in segmentation defects.
Although co-regulated gene pairs are frequently found in proximity to each other 3–6, the selective advantage of gene pairing has remained unknown. While many paired genes encode for housekeeping proteins, some encode for transcription factors and signaling regulators (such as MRF4/MYF5, MESP1/MESP2, SIX1/SIX4/SIX6, and CYP26A1/CYP26C1), whose transcription start sites are 9-516 kb apart. By combining single-cell transcript counting, genetic engineering, real-time imaging and computational modeling, we were able to illustrate that linkage of two segmentation clock genes causes their correlated expression, which is phenotypically beneficial for robust developmental patterning. We anticipate that gene pairing is similarly advantageous in other systems, and this advantage could enable engineering of precise synthetic clocks in embryos and organoids.
METHODS:
Generation of her1ci302 and her1ci301 her7hu2526 mutant zebrafish lines
The CRISPR/Cas9 editing in zebrafish was done as described previously 26. sgRNA was designed using CRISPRscan (http://www.crisprscan.org/); three sgRNA with zero off-target sites were chosen. Fill-in PCR was used to generate a DNA template for sgRNA in vitro transcription. AmpliScribe-T7-Flash transcription kit (Epicentre) was used to generate sgRNA for injection. Invitrogen mMESSAGE mMACHINE SP6 Transcription Kit was used to generate cas9 mRNA from pCS2-nCas9n (Addgene plasmid #47929; http://n2t.net/addgene:47929; RRID:Addgene_47929) 27. Injections containing 300 pg of cas9 mRNA and 20 pg of each sgRNA were injected into one-cell stage wild-type or her7hu2526 mutant embryos. her7hu2526 has a Lys-to-Stop mutation in the Helixl of the HLH-domain 15. DNA was isolated from fins or whole embryos. Primers used for genotyping are listed in Supplementary Table 11. Two base pairs (GC) were deleted in the second exon of her1 (deletion position corresponds to ENSDARG00000014722 1071-1072 bp) (Extended Data Fig. 1h). Mutant her1 mRNA translates into a 39 amino acid truncated polypeptide with 30 amino acid matching with Her1(328aa) and nine amino acid mismatches before a premature stop code in the bHLH-domain. Because this mutant allele of her1 was generated in both wild-type (her1ci302) and her7hu2526 (her1ci301) background, we used it for experiments. Mutant fish were outcrossed at least twice before using in final experiments.
Fish stocks
Tg(Ola.Actb:Hsa.HRAS-EGFP) 28 transgenic line expressing membrane-localized-GFP, Tg(her1:her1-Venus) 25 transgenic line, AB wild-type line and her7hu2526 15 and Df(Chr05:her1,her7,ndrg3a)b567 16 mutant lines were used. her1ci302 and her1ci301 her7hu2526 mutants are generated for this study, as described above. All of the fish experiments were performed under the ethical guideline of Cincinnati Children’s Hospital Medical Center; the animal protocol was reviewed and approved by Cincinnati Children’s Hospital Medical Center Animal Care and Use Committees (Protocol #2017-0048).
smFISH experiments
RNAscope Fluorescent Multiplex Detection kit (Advanced Cell Diagnostics 320851) was used as described previously 14. We adopted most of the protocol, with minor changes. Briefly, 300 pg of membrane-localized GFP RNA was injected into one-cell stage embryos. Embryos were incubated at 23°C unless specified otherwise. Embryos were fixed with 4% PFA the next day. After dehydration, embryos were stored at −20°C overnight. To reduce the background staining, we added a pre-hybridization step. After washing off the pretreatment solution, embryos were hybridized with pre-hybridization (4 M Urea, 0.1% Tween-20,5xSSC, 0.5 mg/ml tRNA, 0.05 mg/ml heparin salt, 0.0092 M Citric Acid) at 40°C for 2 h before probe hybridization overnight. The probes used for this study were listed in Supplementary Table 11. C3 probe was diluted with the C1 probe solution in a 1:50 ratio. Amp4 B was used to quantify her1 and her7 transcripts. Immunohistochemistry was used to amplify the membrane label after the RNAscope assay. Embryos were permeabilized with 1% PBSTX (1% Triton X-100 in PBS) at RT for 1 h, blocked with blocking buffer (1% Triton X-100, 2% BSA, 5% Goat Serum in PBS) at RT for 2 h, incubated with primary antibodies (Chicken IgY anti-GFP, Life Technologies, A10262, 1:200) diluted with blocking buffer at 4°C overnight. The next day, embryos were rinsed with 1% PBSTX for 30 min, blocked with blocking buffer for 10 min, incubated with secondary antibodies (Goat anti-Chicken IgY (H+L) Alexa Fluor 488, A11039, Life Technologies, 1:200) and Hoechst trihydrochloride (Invitrogen, 33342) 1:400 at 4°C overnight. Before imaging, embryos were washed with 0.2xSSCT (0.01% Tween-20 in 0.2xSSC) for 10 min on ice then stored in 4% PFA.
smFISH imaging
ProLong Gold antifade reagent (Life Technologies P36934) was used as mounting media. Imaging was performed by confocal microscopy on a Nikon A1R HD confocal on TiE microscope with a 100X NA 1.45 Plan Apo objective or 100X NA 1.49 TIRF Apo and resonant scanner, and sampled at Nyquist with a pinhole diameter of 75.35 μm and xy pixel size of 0.13 μm/px. Large tiled images were acquired to cover the whole PSM tissue of an embryo with 0.27 μm z-stack. Images were stitched with Nikon NIS-Elements software. In total, we imaged 24 wild-type, 18 her1ci301/+ her7hu2526/+, 28 her1ci301 her7hu2526, 24 her1b567/+ her7b567/+,14 wild-type sibling of her1b567/+ her7b567/+, 23 wild-type grown at 21.5°C, 23 wild-type grown at 28°C, 27 her1ci301/+ her7hu2526/+ gene-paired mutant (grown at 21.5°C), 37 her1ci302/+;her7+/hu2526 gene-unpaired mutant (grown at 21.5°C) embryos. Original microscopy image files are provided at the BioStudies Database 29.
In-situ hybridization
In-situ hybridization was performed according to standard protocols. xirp2a (cb1045) probe was used to label already formed somite 30. DIG-labeled RNA probes were prepared by in vitro transcription and anti-digoxygenin (DIG)-AP Fab fragments (Roche, 1093274) were used. Embryos were fixed with 4% PFA in PBS at RT for 2 hours. NBT/BCIP (Roche, 1168145100) stained in situ hybridization samples were imaged with a Nikon SMZ1500 stereomicroscope (HR Plan Apo 1X WD 54), Nikon DS-Ri1 digital camera with reflected light at 23°C room temperature. Fragmented (broken) or incomplete segment boundaries were scored as disrupted.
Counting transcripts in single cells
Imaris 9 Cell module was used for cell segmentation and RNA counting. The tissues adjacent to the PSM (skin, notochord, neural tube and lateral plate mesoderm) were masked using the Imaris surface tool as described previously 14. Manual surface creation tool was selected to mark the regions surrounding the PSM. The voxels inside the surface were set to zero in order to completely remove undesired tissues. To detect nuclei, nucleus smooth was enabled with filter width 0.3 μm, background subtraction was turned on with width 1.2 μm and split nuclei by seed point was enabled with 3.0 μm seed diameter. The number of voxels filter was used to select the seed points; the nucleus number of voxels was set between 8543.1 and 67759 to detect a single nucleus. For cell detection, cell smallest detail was set to 0.25 μm, and cell volume was set between 150 μm3 and 450 μm3. To detect single RNA molecules, a spots detection tool was used with a diameter 0.5 μm, background subtraction enabled, and quality score was used to pick up true mRNA signal. The RNA concentration is calculated by dividing RNA counts of each cell by its volume. The concentrations plotted in graphs correspond to mRNA counts per 4 pL, as described previously 14. The total number of analyzed cells and slices were (50819, 2832) in wild-type, (47973, 1990) in her1ci301/+ her7hu2526/+, (62952, 3956) in her1ci301 her7hu2526, (41921, 2743) in her1b567/+ her7b567/+, (20852, 1625) wild-type sibling of her1b567/+ her7b567/+, and (45283,2618) in wild-type embryos grown at 21.5°C, (42868,2630) in wild-type embryos grown at 28°C, (59674,3032) in same-chromosome mutant, (92255,4641) in different-chromosome mutant backgrounds. False RNA counts due to background-staining are measured separately for each gene and in each embryo. The background RNA counts for her1/her7 genes are measured by counting spots detected in >40 cells located in somites, where their expression is turned off. The image analysis pipeline performed in Python (see code availability statement) as previously described 14. Most of the cells have low RNA numbers (fewer than 100). Cytoplasmic RNAs are well separated even for cells with 100–200 total her (her1+her7) RNAs, the her1 and her7 RNAs were detected in two channels then summated together to obtain the total her RNA levels. As we reported before 14, total RNA numbers measured by qRT-PCR (with standards) and Imaris segmentation in the tissue matched to each other, suggesting there was no overcrowding.
Grouping cells in space based on oscillation phases
The oscillation period of segmentation clock genes increases incrementally from the posterior-to-anterior (tail-to-head) along the PSM 9,31. The slowdown of oscillations along the posterior-anterior axis causes a phase delay in cells located in the anterior PSM compared to those located in the posterior PSM. As a result, different phases of the oscillator cycle are observed in space along the PSM. Hence, two to three oscillatory waves of gene expression can be detected at any moment of an oscillation cycle (Extended Data Fig. 1a). Consequently, all cells located at the same posterior-anterior position in a two-dimensional, single-cell-wide cross-section are in the same phase of oscillations. Therefore, we quantified average transcript numbers among cells located in single-cell-wide cross-sections along the PSM. The position of each cell and the number of her1 and her7 RNA molecules in each cell were measured in each embryo. Each embryo was divided into left and right halves (Extended Data Fig. 1a). Within each half of PSM, cells were grouped (sliced) based on their oscillation phases along the axis 10. The slice width was set to 8 μm, which corresponds to the diameter of cells in the PSM. A cell was assigned to a slice when the center of the cell is located within a spatial slice. The angle of expression stripes of the segmentation clock gene changes incrementally in a posterior-anterior direction along the PSM. We first measured the changes in stripe angles along the axis, fitted an equation to the data, and applied to samples as described previously 14.
Calculating the amplitude of clock genes
All embryos were aligned from their posterior ends. mRNA data from slices corresponding to the same anterior-posterior positions were grouped (blue dotted line in Extended Data Fig. 1c). The spatial amplitudes of oscillations were measured by subtracting the lowest 10% mRNA mean from the highest 90% mRNA mean in slices corresponding to the same position (Extended Data Fig. 1d). The spatial amplitudes of total her (her1+her7) RNA were averaged over all positions in the PSM (Extended Data Fig. 1e).
Calculating spatial Spearman and Pearson correlation coefficients
40%-80% of PSM corresponds to where one can detect characteristic kinematic clock waves. We quantified how much transcription of her1 and her7 co-vary in space by Spearman rank and Pearson correlations of slice averages along 40%-80% of PSM.
Identification of the heterozygote her1b567/+ her7b567/+ embryos
Homozygous her1 b567 her7 b567 mutation is lethal due to large chromosomal deletion 16. her1b567/+ her7b567/+ fish were incrossed, embryos that do not have segmentation defects (containing a mixture of heterozygous and wild-type siblings) were selected to perform smFISH assay. The chromosomal junction covering the deficiency deletion has not been mapped 16. Thus, the heterozygous embryos cannot be easily separated from their wild-type siblings by PCR-based sequencing. We used the number of nascent transcription loci in smFISH images to sort out the two populations. Imaris 9 spot detection tool was used with a 1.0 μm diameter to identify bright transcription loci inside the nucleus. We selected spots detected jointly by the her1 and her7 channel that colocalize within 1 μm from each other; such spots should correspond to endogenous transcription loci due to adjacent positioning of the two genes. The closest spot-to-spot distance was calculated with Imaris XTensions. The histogram of spots-to-spots closest distance was plotted for each embryo. Wild-type embryos have a significantly higher number of cells containing two transcription loci than their heterozygote siblings. The histogram of distances peaks around 2-3 μm and 7-8 μm for wild-type and her1b567/+ her7b567/+ embryos, respectively (Extended Data Fig. 2g–i).
Detecting nascent transcription loci in single cells
We focus on the anterior PSM where we can see expression stripes of clock genes. Because her1 is three times longer than her7, its nascent transcription loci are larger than her7 loci and are more easily differentiated from cytoplasmic dots. Therefore, we first identified the her1 loci. The Imaris 9 Spots module was used to identify her1 transcription loci with diameters of 1.0 μm on xy-axis and 1.5 μm on the z-axis, background subtraction enabled, and quality score was used to pick up transcription loci signal. The same parameters were used to identify her7 transcription loci. Two loci on the same chromosome are colocalized. Therefore, Bitplane XTension Spots colocalize were used to identify her1 loci colocalize with her7 loci within 1 μm. To detect nuclei, the Imaris Surface module was used. Region growing was enabled, nucleus smooth was enabled with filter width 0.3 μm, background subtraction was turned on with 1.2 μm width and split nuclei by seed point was enabled with 3.0 μm seed diameter. BitplaneXTension Spots Split Into Surface Objects were used to split colocated loci into nuclei. The probabilities of co-firing of loci were calculated with the following equations:
Time-lapse imaging and image analysis
We outcross homozygous Tg(her1:her1Venus) with wild-type fish to generate heterozygous Tg(her1:her1Venus) as a control. her7hu2526;Tg(her1:her1Venus) homozygous fish were outcrossed with her1ci302 fish to generate gene-unpaired embryos with heterozygous Tg(her1:her1Venus). Homozygous Tg(her1:her1Venus) fish were outcrossed with her1ci301 her7hu2526 fish to generate gene-paired embryos with heterozygous Tg(her1:her1Venus). Embryos were collected within 15 minutes, incubated at 28°C till the tailbud stage, then transferred to 21.5°C until imaging. Before imaging, embryos were dechorionated and laterally aligned in holes (600 μm in diameter that fits yolk) in 1% agarose gel (in E3 medium with 4% tricaine) that were cast in 35-mm with 15-mm glass-bottom dish (Azer Scientific, ES56291, USA). The dish contained E3 medium with 4% tricaine to prevent muscle twitching at later stages and allowed to equilibrate at 21.5°C prior to imaging. Images were captured under Nikon Ti-E SpectraX Widefield Microscope (Plan Apo λ 10X) with an Andor Zyla 4.2 megapixel 16-bit sCMOS monochromatic camera, at a 512x512 pixel resolution. Four wild-type, four gene-paired, and four gene-unpaired embryos were imaged at a time; the experiment was repeated three times (12 embryos in total per genotype). The samples were excited by 508 nm solid-state diode laser and images were recorded in 2 channels, YFP (535/30 filter) and brightfield, 5 z-slices in 30 μm steps with a range of 120 μm, at a time interval of 5 minutes for 11 hours. The imaging temperature of the medium around the embryos was maintained at 21.4±0.1°C. Kymographs were generated from the YFP images in FIJI 32 using the LOI interpolator 33 from 14 to 25 somite stage for 11 hours. Kymographs were aligned at the last formed somite boundary (on the right side). The width of the segmented line was set to 20-pixel (52 μm), and the line was drawn along the PSM at the formation of each segment during somitogenesis. The intensity profiles were plotted at the anterior end of PSM from the kymographs, using the plot profile with a 4-pixel line width, after subtracting the minimum intensity along the line for each kymograph. The anterior amplitude of each somite from 15 to 25 was calculated by subtracting the trough intensity from the peak intensity before the somite formation. Amplitudes of gene-paired or gene-unpaired embryos were normalized to the mean amplitude of wild-type embryos for each somite stage within the same experiment. To compare the amplitudes preceding normal and disrupted segments, the amplitudes were normalized to the average amplitude of clock cycles preceding normal segments in gene-paired or gene-unpaired embryos. The error bars show S.E.M. of amplitude percentages.
Equipment and settings
Fig. 1d, 1k, S1a and S2a were acquired with Nikon A1R HD confocal on TiE microscope with a 100X NA 1.45 Plan objective and resonant scanner, and sampled at Nyquist (xy pixel size of 0.13 μm /px) with pinhole diameter of 75.35 μm that yielded an optical section thickness of 0.54 μm. Data were acquired as a series of overlapping multichannel z-stacks forming a tiled large that would cover the whole PSM tissue of an embryo with 0.27 μm z-step. Tiled images were stitched with Nikon NIS-Elements software. Embryos were flat mount with ProLong Gold antifade reagent (Life Technologies P36934) imaged at 22°C. Images were acquired as 12 bits/channel. 561 nm laser with 685/70 and 638 nm laser with 600/50 filters were used to quantify her7 and her1 transcripts. 405 nm laser with 450/50 filter was used for nuclear imaging. Fig. 3a was acquired with Nikon A1R HD confocal on TiE microscope with a 100X NA 1.49 TIRF Apo objective; the rest of conditions were kept the same as Fig. 1d, 1k, S1a and S2a images. Fig. 1e, 2c, 2d and S2c were acquired using Nikon SMZ1500 stereomicroscope (HR Plan Apo 1X WD 54), Nikon DS-Ri1 digital camera with reflected light at 23°C room temperature. Images were acquired as 16 bits. Fig. 3d–l were acquired by a Nikon Ti-E SpectraX Widefield Microscope (Plan Apo λ 10X) with an Andor Zyla 4.2 megapixel 16-bit sCMOS monochromatic camera. The imaging format was set to 512x512 pixel resolution (binning 4x4). The samples were excited by 508 nm solid-state diode laser, and images were recorded in 2 channels, YFP (535/30 filter) for 300 ms and brightfield for 1 ms, along 120 μm range of 5 z-slices with a 30 μm step-size, at a time interval of 5 minutes for 11 hours. The imaging temperature of the medium around the embryos was maintained at 21.4±0.1°C.
Computational modeling
We developed a time-delayed stochastic model consisting of 16 reactions with 15 parameters. The variables (Supplementary Table 12): mh1 and mh7 represent the number of her1 and her7 RNA molecules, respectively; ph1, ph7, and ph6 represent the number of Her1, Her7, and Hes6 proteins, respectively. The variables c1, c1h1h1, and c1h6h7 represent free, Her1-Her1-bound, and Hes6-Her7-bound states of chromosome 1, respectively. Similarly, the variables c2, c2h1h1, and c2h6h7 represent free, Her1-Her1-bound, and Hes6-Her7-bound states of chromosome 2, respectively. Each reaction describes a change in the state of DNA or the number of mRNA or protein molecules (Supplementary Tables 13, 14). Protein synthesis and degradation rates are described by psh1, psh7, pdh1, and pdh7 for Her1 and Her7, respectively. mRNA synthesis and degradation rates are described by msh1, msh7, mdh1, and mdh7 for her1/her7, respectively. DNA association rates of Her1-Her1 and Her7-Hes6 dimers to both chromosomes are represented by ah1h1 and ah6h7, respectively. DNA dissociation rates of Her1-Her1 and Her7-Hes6 dimers to both chromosomes are represented by dh1h1 and dh6h7, respectively. Transcriptional and translational delays are represented by tmh1, tmh7, tph1, and tph7 for her1 and her7, respectively. In our model, we have 16 reactions (Supplementary Table 14). We assumed that her1 or her7 mRNA is synthesized only if the chromosome is at the free state (i.e., c1 and c2). Only Her1-Her1 and Her7-Hes6 dimers can bind to sites on the promoter regions of her1 and her7 genes 12,13,24, to repress their transcription. Her1-Her1- and Her7-Hes6-bound states of chromosomes 1 and 2 (i.e., c1h1h1, c2h1h1, c1h6h7, and c2h6h7) are the inactive states of her1 and her7 genes. We modeled gene-unpaired heterozygous mutant as chromosomes 1 and 2 leading to transcription of her1 and her7 genes, respectively. Similarly, we modeled gene-paired heterozygous mutant as only chromosome 1 leading to transcription of both her1 and her7 genes. her1 and her7 mRNAs are assumed to be degraded at a linear rate. Similarly, Her1 and Her7 protein synthesis and degradation are modeled with a linear rate. In contrast to Her1 and Her7 proteins, Hes6 protein is assumed to be constant. The time needed to transcribe and translate mRNA is accounted for by the transcriptional and translational delay terms 8. The propensity equations for the model are provided in Supplementary Table 14. The model was simulated in Matlab (see code availability statement) for three different scenarios: 1) Transcription firing rates of her1 and her7 were kept constant (Fig. 2m, o). 2) The average transcription firing rates of her1 and her7 were kept constant. But, at each incidence of firing, the firing rate for each gene was separately and randomly chosen from a distribution that has the same average rate (Extended Data Fig. 4a, b). 3) Transcription and RNA degradation rates of her7 were set to 50% higher than those of her1 which led to similar average RNA numbers of two genes (Extended Data Fig. 4c, d).
Stochastic simulations
Probabilistically determined propensities and reaction times are used to decide which reaction fires at each iteration. Reactions with higher propensities are more likely to fire. As we have done in an earlier study, we performed the stochastic simulations using the next reaction method 11. A delayed reaction queue is incorporated into the standard next reaction method to accommodate time delays, as suggested 34. In total, we run 30 different 240 minutes simulations for each genetic background. We generated 30 different random number seeds and used them equally for the gene-paired and -unpaired genotypes so that their results are directly comparable. In the case of paired-gene transcription, their transcription rate was compared to a single random number, transcription firing was determined simultaneously for both genes. In contrast, for unpaired functional her1 and her7 genes, transcription rates were compared to two different random numbers and transcription firing was determined separately for each gene.
Statistical analysis
An independent samples t-test was run to determine if there were differences in the spatial amplitudes of her1 and her7 in Fig. 1f (the effect size was calculated by Cohen’s d: d=0.25 for her1 and d=0.30 for her7 (a small effect)) and in Extended Data Fig. 2d (the effect size was calculated by Cohen’s d: d=1.2 for her1 and d=2.4 for her7 (a large effect)). There were no outliers in the data as assessed by inspection of a boxplot in Extended Data Fig. 2d. One outlier is removed in Fig. 1f, though keeping the outlier did not change the statistical significance of our result. Spatial amplitudes for each genetic background were normally distributed, as assessed by Shapiro-Wilk’s test. Homogeneity of variances assumption, as assessed by Levene’s test for equality of variances, only failed for Extended Data Fig. 2d for her1 amplitude data. We have reported the Welch’s t-test for her1 amplitude comparison in this figure. A chi-square test for association was conducted between genotype and segmentation defect in Fig. 2e and 3n (between gene-paired and gene-unpaired embryos). All expected cell frequencies were greater than five. In Fig. 3n, the Fisher’s exact test of independence was conducted between wild-type and gene-paired embryos; we could not employ chi-squared test due to the zero disrupted frequency in wild-type embryos. A Mann-Whitney U test was run to determine if there were differences in the number of disrupted boundaries between gene-paired and gene-unpaired in Fig. 2f. Distributions of the number of disrupted boundaries were not similar, as assessed by visual inspection, thus we compared the mean rank of the number of disrupted boundaries between gene-paired and gene-unpaired. A Mann-Whitney U test was run to determine if there were differences in the co-firing probability between her1/her1 and her1/her7 for embryos raised at different temperatures. Distributions of the co-firing probability were not similar, as assessed by visual inspection (Fig. 1m, p), thus we compared the mean rank of the co-firing probability. A Mann-Whitney U test was run to determine if there were differences in the normalized amplitude levels between wild-type and gene-paired or gene-paired and gene-unpaired embryos (Fig. 3m) or if there were differences in the normalized amplitude preceding normal or disrupted segmentation both in and gene-paired and gene-unpaired embryos (Fig. 3o). Distributions of the amplitude were not similar, as assessed by visual inspection, thus we compared the mean rank of the normalized amplitude. A Spearman’s rank-order correlation was run to assess the correlation of her1 and her7 gene expressions. Pearson correlation was also run to confirm the results. Our analysis showed the relationship to be monotonic, as assessed by visual inspection of a scatterplot. However, it also showed our data, for some cases, failed assumptions of the Pearson correlation such as both variables being normally distributed, as assessed by Shapiro Wilk’s test, and no outliers. Thus, we reported the Spearman rank correlation in main figures. Pearson correlation scores were reported in Extended Data Fig. 3 to show that the choice of the correlation metric did not change our main findings. A Mann-Whitney U test was run to determine if there were differences in the Spearman rank and Pearson correlations in Fig. 1j, o, Fig. 2o, Fig. 3c, Extended Data Fig. 2f, Extended Data Fig. 3 and Extended Data Fig. 4b, d. This choice is made due to the failure of the assumptions of the t-test of independent samples such as existence of outliers and normality in parts of the dataset. Distributions of the Spearman rank and Pearson correlations were sometimes not similar, as assessed by visual inspection, thus we compared the mean rank of the correlation scores. All hypotheses testing has been done by using SPSS 26.0 (IBM). For the cases where multiple tests were done on the same dataset, Bonferroni correction is applied by multiplying the p-value by the number of tests. The corrected p-values are reported in the paper. A priori statistical power analysis was performed for sample size estimation, based on preliminary data for each experiment. The effect sizes for our preliminary data-excluding Fig. 1o, 1p (Pher7/her1 temperature comparison), S3a (WT vs. Heterozygous), and S3c-varied between 0.3 and 2.4, considered to be a medium-large effect using Cohen’s criteria 35. Using G*Power software, for each experiment, we determined the minimum sample size to collect the data for using the preliminary effect sizes, alpha=0.05 and power=0.8 36. For each experimental data, we also conducted a post hoc power analysis to determine whether our design had enough power. We had enough power (power>0.8) for all our experiments except Fig. 1o (power=0.6), S3c (power=0.7) and 1p (power=0.3 only for Pher7/her1 temperature comparison which had p<0.05), which does not change main conclusions.
Extended Data
Extended Data Fig. 1 |. Single RNA molecules are quantified in single cells in the zebrafish PSM.
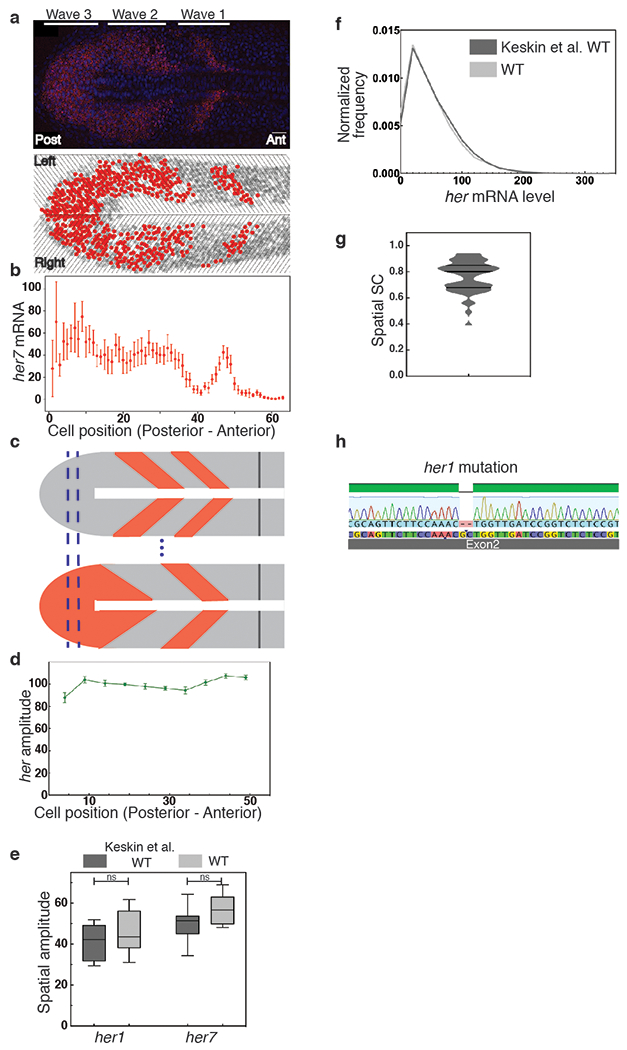
a, Top: A single z-section of PSM of a wild-type embryo. her7 mRNAs and nuclei are colored in red and blue, respectively. Scale bar, 30 μm, n=24, N=2. Bottom: The PSM is divided into single-cell-wide slices. Cells containing higher or lower RNA than an arbitrary threshold are plotted as red or gray circles, respectively. Left and right halves of the PSM are located at the upper and lower portions of the image, respectively. Three oscillatory waves of her7 are visible. b, her7 RNA counts are plotted along the posterior-to-anterior direction at the left half of PSM. Each dot corresponds to the average RNA number in a spatial cell population (slice); Center is mean, error bars indicate two standard errors (SEs). c, All embryos are aligned from their posterior ends and slices corresponding to the same anterior-posterior positions are grouped (blue dashed lines). d, The spatial amplitudes of oscillations of total her (her1+her7) RNA. Center is mean, error bar is standard error of the mean. e, The spatial amplitudes are averaged over all positions in the PSM. Comparison of new wild-type (silver, n=24, N=2) data obtained with a Nikon confocal microscope versus previously published data (dark gray, n=18, N=4) obtained by a Zeiss Apotome 14. The box spans the interquartile range, line labels median, the whiskers extend to maximal and minimal observations. Difference assessed by two-sided independent t-test with Bonferroni correction, her1 p=0.48; her7 p=0.106. f, Comparison of histograms of total her RNA obtained by two different microscopes. g, Spatial SC scores for wild-type embryos. h, Sequencing showing two base pairs deletion in the her1 coding sequence in her1ci301 her7hu2526 and her1ci302 fish. n is embryo number, N is independent experiment.
Extended Data Fig. 2 |. Gene pairing boosts correlated transcription.
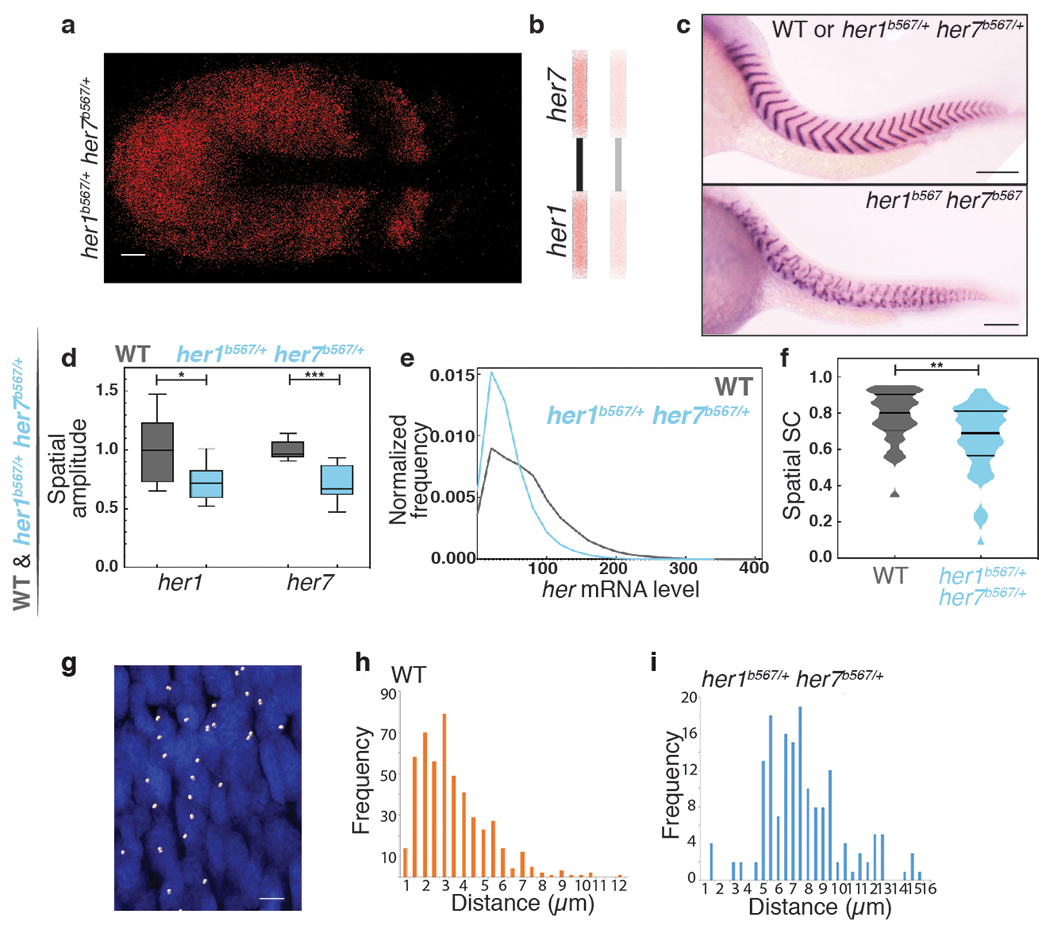
a, A her1b567/+ her7b567/+ embryo with oscillatory waves of her7 transcription. Scale bar, 30 μm. b, One of the chromosomes has a large deletion including the her1-her7 locus. c, The boundaries of somite segments are marked by xirp2a ISH staining in sibling wild-type or heterozygous her1b567/+ her7b567/+ (top) and homozygous her1b567 her7b567 (bottom) embryos. Scale bar, 100 μm d, her1b567/+ her7b567/+ embryos (n=24, N=2) have reduced spatial amplitude from wild-type (n=14, N=2) as assessed by two-sided Welch’s t-test with Bonferroni correction for her1 and the independent samples two-sided t-test for her7 (28% her1 amplitude t(13.6)=2.6, p=0.04, 28% her7 amplitude t(18)=5.3, p=9.800x10⁻⁵). The box spans the interquartile range, line labels median, the whiskers extend to maximal and minimal observations. e, The histogram of total her (her1+her7) RNA per cell is plotted in wild-type (gray) and her1b567/+ her7b567/+ (blue) embryos. her1b567/+ her7b567/+embryos have 38% less total her mRNA than wild-type. f, SC scores reflecting correlated expression of her1/her7 in wild-type (gray) and her1b567/+ her7b567/+ (blue) embryos as assessed by the two-sided Mann-Whitney U test, (U=392.5, z=−3.0, p=0.003). Median is the thick line, and 25% and 75% are thin black lines. g, The nascent transcription loci (dots) are detected in nuclei (blue) of cells located in a stripe-region in the anterior PSM of a her1b567/+ her7b567/+ embryo. Scale bar, 5 μm h, The histogram of the distance between two-closest loci in wild-type embryos. i, The histogram of the distance between two-closest loci in her1b567/+ her7b567/+ embryos. *, p≤0.05; **, p≤0.01; ***, p≤0.001. n is embryo number, N is independent experiment.
Extended Data Fig. 3 |. Spatial PC scores for all genotypes.
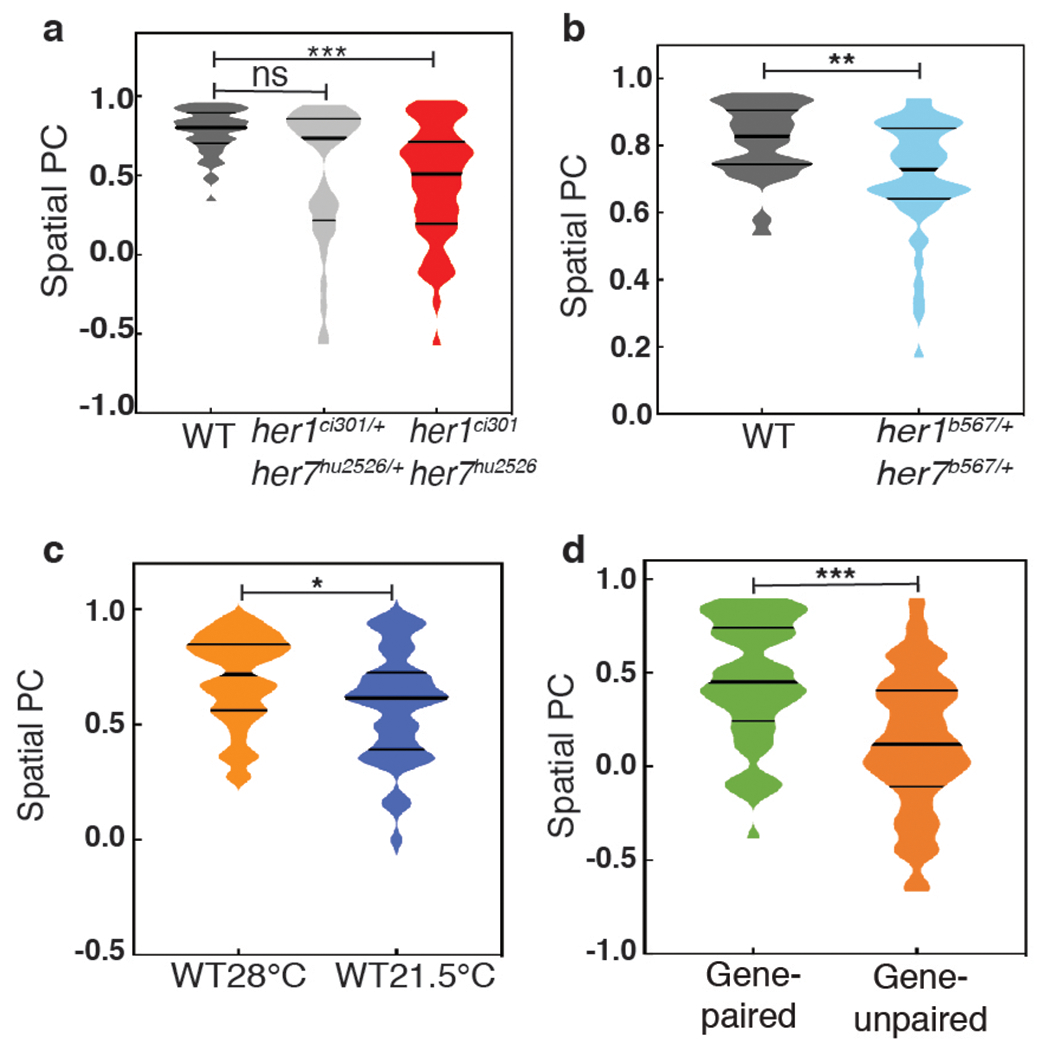
a, Spatial PC scores of her1/her7 in wild-type (dark gray), her1ci301/+ her7hu2526/+ (silver), her1ci301 her7hu2526 (red) embryos differences are assessed by the two-sided Mann-Whitney U test with Bonferroni correction (wild-type, her1ci301/+ her7hu2526/+, U=615, z=−2.3, p=0.072; wild-type, her1ci301 her7hu2526, U=576, z=−5.0, p=1.652x10⁻⁶; her1ci301/+ her7hu2526/+, her1ci301 her7hu2526, U=841, z=−1.3, p=0.546). b, Spatial PC scores of her1/her7 in wild-type (gray) and her1b567/+ her7b567/+ (blue) embryos (U=410, z=−2.8, p=0.005). c, Spatial PC scores of her1/her7 in wild-type embryos raised at 21.5°C or 28°C (U=772, z=−2.23, p=0.026). d, Spatial PC scores for gene-paired and gene-unpaired embryos raised at 21.5°C (U=1039, z=−4.6, p=4.000x10⁻⁶). a-d, Differences in PC scores are assessed by the two-sided Mann-Whitney U test (*, p≤0.05; **, p≤0.01; ***, p≤0.001).
Extended Data Fig. 4 |. Simulation of alternative scenarios.
a, b Scenario. a, Average transcription firing rates of her1 and her7 were kept constant. But, at each incidence of firing, the firing rate for each gene was separately and randomly chosen from a distribution that has the same average rate. b, Spatial SC score of her1 and her7 expression over time (U=3, z =−6.6, p=3.879x10⁻¹¹). Differences in SC scores are assessed by the two-sided Mann-Whitney U test. c, d Scenario 3. c Transcription and RNA degradation rates of her7 were set to 50% higher than those of her1 which led to similar average RNA numbers of two genes. d, Spatial SC score of her1 and her7 expression over time (U=0, z=−6.7, p=2.872x10⁻¹¹). Differences in SC scores are assessed by the two-sided Mann-Whitney U test (***, p≤0.001).
Supplementary Material
Acknowledgements:
We thank Sevdenur Keskin, Ifunanya Ejikeme, Mine Evren, Hannah Seawall, Laura Tweedie, Yin Y. Lee, Evan Meyer, Matthew Kofron, and Cincinnati Children’s Imaging Core and Veterinary Services for technical assistance, Muhammed Simsek, Abhyudai Singh, Tongli Zhang, Chris Hong, David Spinzak and members of Özbudak Lab for discussions, and Brian Gebelein and Rafi Kopan for editing the manuscript. This work was funded by an NIH grant (GM122956) to E.M.Ö.
Footnotes
Data Availability
Source data are provided with this paper. Data sets containing RNA counts in each cell for each embryo are provided as Excel files in Supplementary Tables 1–7, 9, 10. Original microscopy image files are provided at the BioStudies (https://www.ebi.ac.uk/biostudies/studies/) (accession number S-BSST434).
Code Availability
Matlab and Python codes are provided at GitHub (https://github.com/ozbudak/zinani_genepairing).
Competing interests: The authors declare no competing interests.
REFERENCES:
- 1.Ozbudak EM, Thattai M, Kurtser I, Grossman AD & van Oudenaarden A Regulation of noise in the expression of a single gene. Nat Genet 31, 69–73 (2002). [DOI] [PubMed] [Google Scholar]
- 2.Elowitz MB, Levine AJ, Siggia ED & Swain PS Stochastic gene expression in a single cell. Science 297, 1183–1186 (2002). [DOI] [PubMed] [Google Scholar]
- 3.Adachi N & Lieber MR Bidirectional gene organization: a common architectural feature of the human genome. Cell 109, 807–809 (2002). [DOI] [PubMed] [Google Scholar]
- 4.Yang L & Yu J A comparative analysis of divergently-paired genes (DPGs) among Drosophila and vertebrate genomes. Bmc Evol Biol 9 (2009). [DOI] [PMC free article] [PubMed] [Google Scholar]
- 5.Arnone JT, Robbins-Pianka A, Arace JR, Kass-Gergi S & McAlear MA The adjacent positioning of co-regulated gene pairs is widely conserved across eukaryotes. Bmc Genomics 13(2012). [DOI] [PMC free article] [PubMed] [Google Scholar]
- 6.Yan C, Wu S, Pocetti C & Bai L Regulation of cell-to-cell variability in divergent gene expression. Nature communications 7, 11099 (2016). [DOI] [PMC free article] [PubMed] [Google Scholar]
- 7.Hubaud A & Pourquie O Signalling dynamics in vertebrate segmentation. Nat Rev Mol Cell Biol 15, 709–721 (2014). [DOI] [PubMed] [Google Scholar]
- 8.Lewis J Autoinhibition with transcriptional delay: A simple mechanism for the zebrafish somitogenesis oscillator. Current Biology 13, 1398–1408 (2003). [DOI] [PubMed] [Google Scholar]
- 9.Giudicelli F, Ozbudak EM, Wright GJ & Lewis J Setting the Tempo in Development: An Investigation of the Zebrafish Somite Clock Mechanism. PLoS Biol 5, e150 (2007). [DOI] [PMC free article] [PubMed] [Google Scholar]
- 10.Harima Y, Takashima Y, Ueda Y, Ohtsuka T & Kageyama R Accelerating the tempo of the segmentation clock by reducing the number of introns in the hes7 gene. Cell reports 3, 1–7 (2013). [DOI] [PubMed] [Google Scholar]
- 11.Ay A, Knierer S, Sperlea A, Holland J & Özbudak EM Short-lived Her Proteins Drive Robust Synchronized Oscillations in the Zebrafish Segmentation Clock. Development 140, 3244–3253 (2013). [DOI] [PubMed] [Google Scholar]
- 12.Schroter C, et al. Topology and dynamics of the zebrafish segmentation clock core circuit. PLoS Biol 10, e1001364 (2012). [DOI] [PMC free article] [PubMed] [Google Scholar]
- 13.Hanisch A, et al. The elongation rate of RNA Polymerase II in the zebrafish and its significance in the somite segmentation clock. Development 140, 444–453 (2013). [DOI] [PubMed] [Google Scholar]
- 14.Keskin S, et al. Noise in the Vertebrate Segmentation Clock Is Boosted by Time Delays but Tamed by Notch Signaling. Cell reports 23, 2175–2185 e2174 (2018). [DOI] [PMC free article] [PubMed] [Google Scholar]
- 15.Choorapoikayil S, Willems B, Strohle P & Gajewski M Analysis of her1 and her7 mutants reveals a spatio temporal separation of the somite clock module. PLoS ONE 7, e39073 (2012). [DOI] [PMC free article] [PubMed] [Google Scholar]
- 16.Henry CA, et al. Two linked hairy/Enhancer of split-related zebrafish genes, her1 and her7, function together to refine alternating somite boundaries. Development 129, 3693–3704 (2002). [DOI] [PubMed] [Google Scholar]
- 17.Lleras Forero L, et al. Segmentation of the zebrafish axial skeleton relies on notochord sheath cells and not on the segmentation clock. Elife 7 (2018). [DOI] [PMC free article] [PubMed] [Google Scholar]
- 18.Becskei A, Kaufmann BB & van Oudenaarden A Contributions of low molecule number and chromosomal positioning to stochastic gene expression. Nature genetics 37, 937–944 (2005). [DOI] [PubMed] [Google Scholar]
- 19.Raj A, Peskin CS, Tranchina D, Vargas DY & Tyagi S Stochastic mRNA synthesis in mammalian cells. Plos Biology 4, 1707–1719 (2006). [DOI] [PMC free article] [PubMed] [Google Scholar]
- 20.Fukaya T, Lim B & Levine M Enhancer Control of Transcriptional Bursting. Cell 166, 358–368 (2016). [DOI] [PMC free article] [PubMed] [Google Scholar]
- 21.Schroter C, et al. Dynamics of zebrafish somitogenesis. Dev Dynam 237, 545–553 (2008). [DOI] [PubMed] [Google Scholar]
- 22.Kawamura A, et al. Zebrafish hairy/enhancer of split protein links FGF signaling to cyclic gene expression in the periodic segmentation of somites. Genes Dev 19, 1156–1161 (2005). [DOI] [PMC free article] [PubMed] [Google Scholar]
- 23.Novak B & Tyson JJ Design principles of biochemical oscillators. Nat Rev Mol Cell Biol 9, 981–991 (2008). [DOI] [PMC free article] [PubMed] [Google Scholar]
- 24.Trofka A, et al. The Her7 node modulates the network topology of the zebrafish segmentation clock via sequestration of the Hes6 hub. Development 139, 940–947 (2012). [DOI] [PMC free article] [PubMed] [Google Scholar]
- 25.Delaune EA, Francois P, Shih NP & Amacher SL Single-cell-resolution imaging of the impact of notch signaling and mitosis on segmentation clock dynamics. Dev Cell 23, 995–1005 (2012). [DOI] [PMC free article] [PubMed] [Google Scholar]
REFERENCES CITED IN METHODS:
- 26.Moreno-Mateos MA, et al. CRISPRscan: designing highly efficient sgRNAs for CRISPR-Cas9 targeting in vivo. Nature methods 12, 982–988 (2015). [DOI] [PMC free article] [PubMed] [Google Scholar]
- 27.Jao LE, Wente SR & Chen WB Efficient multiplex biallelic zebrafish genome editing using a CRISPR nuclease system. P Natl Acad Sci USA 110, 13904–13909 (2013). [DOI] [PMC free article] [PubMed] [Google Scholar]
- 28.Cooper MS, et al. Visualizing morphogenesis in transgenic zebrafish embryos using BODIPY TR methyl ester dye as a vital counterstain for GFP. Developmental dynamics : an official publication of the American Association of Anatomists 232, 359–368 (2005). [DOI] [PubMed] [Google Scholar]
- 29.Sarkans U, et al. The BioStudies database-one stop shop for all data supporting a life sciences study. Nucleic Acids Res 46, D1266–D1270 (2018). [DOI] [PMC free article] [PubMed] [Google Scholar]
- 30.Riedel-Kruse IH, Muller C & Oates AC Synchrony dynamics during initiation, failure, and rescue of the segmentation clock. Science 317, 1911–1915 (2007). [DOI] [PubMed] [Google Scholar]
- 31.Gomez C, et al. Control of segment number in vertebrate embryos. Nature 454, 335–339 (2008). [DOI] [PubMed] [Google Scholar]
- 32.Schindelin J, et al. Fiji: an open-source platform for biological-image analysis. Nature methods 9, 676–682 (2012). [DOI] [PMC free article] [PubMed] [Google Scholar]
- 33.Soroldoni D, et al. Genetic oscillations. A Doppler effect in embryonic pattern formation. Science 345, 222–225 (2014). [DOI] [PMC free article] [PubMed] [Google Scholar]
- 34.Anderson DF A modified next reaction method for simulating chemical systems with time dependent propensities and delays. The Journal of chemical physics 127, 214107 (2007). [DOI] [PubMed] [Google Scholar]
- 35.Cohen J Statistical power analysis for the behavioral sciences, (L. Erlbaum Associates, Hillsdale, N.J., 1988). [Google Scholar]
- 36.Faul F, Erdfelder E, Lang AG & Buchner A G*Power 3: a flexible statistical power analysis program for the social, behavioral, and biomedical sciences. Behav Res Methods 39, 175–191 (2007). [DOI] [PubMed] [Google Scholar]
Associated Data
This section collects any data citations, data availability statements, or supplementary materials included in this article.